Article
*e-mail: [email protected]
Determination of Pesticides Multiresidues in Shallow Groundwater in a Cotton-growing
Region of Mato Grosso, Brazil
Leandro Carbo,*,a Valéria Souza,a Eliana F. G. C. Doresb and Maria L. Ribeiroa
aDepartamento de Química Orgânica, Instituto de Química, Universidade Estadual Paulista,
14801-970 Araraquara-SP, Brazil
bDepartamento de Química, Universidade Federal de Mato Grosso, 78060-900 Cuiabá-MT, Brazil
Foi desenvolvido um método multirresíduos empregando CLAE/DAD para a determinação de doze pesticidas em águas subterrâneas em lavouras de algodão, baseado em extração em fase sólida, utilizado como adsorvente o copolímero estireno divinilbenzeno (SDVB). O método foi validado e obtiveram-se recuperações entre 73 e 113%, desvio padrão relativo entre 2 e 16% e limites de detecção variando de 0,06 a 0,57 µg L-1. O método foi aplicado em 110 amostras de águas
subterrâneas de lavouras de algodão localizadas em Primavera do Leste, Mato Grosso, Brasil. Dos pesticidas analisados, oito (acetamiprido, aldicarbe, carbendazim, carbofurano, diurom, imidacloprido, metomil e teflubenzurom) foram detectados nas amostras de água, sendo que 18% continham pelo menos um dos pesticidas, com concentrações variando de 0,78 a 68,79 µg L-1,
excedendo em alguns casos, os níveis estabelecidos pela União Européia. Esses resultados confirmam a vulnerabilidade do lençol freático no que diz respeito à contaminação por pesticidas.
Aiming to evaluate the contamination of groundwater by pesticides in cotton growing areas, an SPE-based method (styrene-divinylbenzene copolymer - SDVB) was developed for the simultaneous determination of twelve pesticides in water by HPLC/DAD. The method was validated and average recoveries ranged from 73 to 113%, with a relative standard deviation of 2 to 16%. Detection limits ranged from 0.06 to 0.57 µg L-1. The method was applied to groundwater samples (110) from cotton
fields located in “Primavera do Leste”, Mato Grosso state, Brazil. Eight pesticides (acetamiprid, aldicarb, carbendazin, carbofuran, diuron, imidacloprid, methomyl and teflubenzuron) were found in the analyzed groundwater samples and 18% of them contained at least one of the pesticides (with concentrations ranging from 0.78 to 68.79 µg L-1). In some cases, detected concentrations
exceeded the target levels set by the European Union. These findings confirm the vulnerability of shallow groundwater in the aforementioned areas to pesticide contamination.
Keywords:pesticides, groundwater, SPE extraction
Introduction
The state of Mato Grosso is very rich in water resources. The headwaters of many of the major rivers of three important hydrographic basins (Pantanal, Amazon and Araguaia) are located in Mato Grosso. The region of “Primavera do Leste” (state of Mato Grosso, central-western Brazil) is characterized by intensive farming with monoculture plantations, whose production has expanded greatly since its beginnings 30 years ago.
The monoculture system under which cotton is grown has led to its susceptibility to pest attacks, which are prevented
through the application of several different chemical classes of pesticides throughout the years. The pesticides most frequently used on cotton in the region of “Primavera do Leste” are organophosphates (16.7%), carbamates (12.5%), urea derivatives (12.5%), neonicotinoids (8.4%), pyrethroids (8.4%), benzimidazoles (4.2%) and others of minor importance (triazoles, chloroacetanilides, triazines, substituted glycines, phenoxyacetic acids, bipyridyls, strobilurins and organotins).1
After their application, pesticide residues may remain in crops, soil and surface and groundwater and constitute a health risk because of their toxicity.2-4 This problem is
rural and urban zones of “Primavera do Leste”. However, little monitoring of pesticide residues in groundwaters has been carried out in Brazil, and only a few studies have dealt with pesticide levels in aquatic systems in central-western Brazil.5,6
In Brazil, Ministry of Health regulation 518/2004 establishes limits for pesticides in drinking waters.7
However, this regulation fails to cover most of the pesticides currently in use, such as neonicotinoids and urea derivatives. The European Union has established the parametric value in drinking water at a concentration of 0.1 µg L-1 for any individual pesticide or 0.5 µg L-1 for total
pesticide levels.8
Due to the low detection levels required by regulatory bodies, efficient sample preparation and trace-level detection are important aspects in an analytical method. The development of multiresidue methods is difficult due to the fact that compounds with distinct physicochemical characteristics must be extracted and analyzed simultaneously.9-13
The extraction and preconcentration steps are sometimes carried out simultaneously using techniques such as liquid-liquid extraction (LLE) and solid-phase extraction (SPE). LLE is a simple and convenient technique used to separate organic compounds from solutions or aqueous suspensions, but presents as its main disadvantage a high consumption of high purity solvents if not used properly, besides the costs associated with their use and discard. SPE is used in the analysis of both polar and non polar analytes where the matrix and the analyte of interest are usually dissolved in a liquid.10,14-18
Therefore, the objective of this study was to adapt, optimize and validate a multiresidue method for simultaneously determining the following pesticides used in cotton cultures: lufenuron, azoxystrobin, thiamethoxan, teflubenzuron, carbofuran, diafenthiuron, thiacloprid, imidacloprid, aldicarb, carbendazin, diuron, acetamiprid, methomyl and triflumuron, aiming to analyze groundwater from monitoring wells located in cotton plantations in the region of “Primavera do Leste”, using solid-phase extraction followed by HPLC-photodiode array detection (DAD).
Experimental
Chemicals and materials
Certified standards of the pesticides were purchased from Dr. Ehrenstorfer (Augsburg, Germany). All the pesticide standards were of at least 95% purity. Terbuthylazine (98.5%) was used as the internal standard and was obtained from Dr. Ehrenstorfer (Augsburg, Germany). A stock
standard solution of each pesticide at ca. 100 mg L-1 was
prepared in acetonitrile. Working standard solutions of all pesticides together were prepared by diluting standard stock solutions with the mobile phase. Standard stock and working solutions of the internal standard were prepared in the same way. Acetonitrile and methanol were of HPLC grade (Mallinckrodt Baker, Paris, KY, USA) and deionised water (18.2 MΩ cm-1) was prepared using the
Milli-Q® system (Millipore, Bedford, MA, USA). The
styrene-divinylbenzene copolymer (SDVB) solid phase was acquired from Supelco (Bellefonte, PA, USA). SPE glass tubes (8 mL) were used in the preconcentration step. The SPE tubes were packed with 200 mg SDVB in the laboratory.
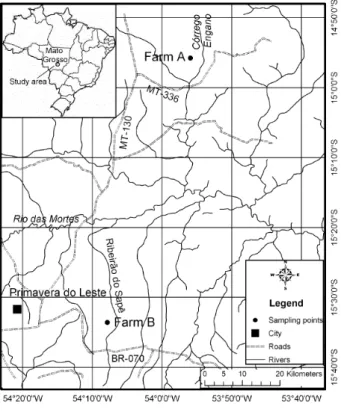
Study area and sampling
Water samples were collected from different monitoring wells in cotton fields located in “Primavera do Leste” (central-western Brazil). This area is characterized by intensive farming with soybean, cotton, rice and maize plantations. The samples were taken from two farms (A and B, Figure 1), which were chosen for their high potential for shallow groundwater contamination: proximity of the plantations to streams, and for a set of physical characteristics of the environment such as high declivity, medium to high soil permeability and shallow water table (less than 4.5 m deep).
Five monitoring wells were built on farm A and two on farm B. Water samples were collected monthly from each farm (70 samples from farm A and 40 from farm B) between January 2002 and March 2003. The containers were filled carefully just to overflowing, without allowing air bubbles to pass through the samples or air bubbles to be trapped in sealed containers, and the samples were stored at 4 °C. The extraction was done normally within 48 h, with a maximum storage time of 5 days.
Method
For the recovery experiments, the appropriate volumes of standard working solutions were added to 500 mL of water to obtain spiked water samples at 0.4, 1.0, 2.0, 10 and 20 µg L-1 of the pesticides. The recovery assays
5 mL min-1. The cartridge was dried leaving the vaccum
pump on for 30 min. The pesticides were eluted with 3 ×
5 mL of methanol:acetonitrile 7:3 (v/v) at a flow-rate of about 1 mL min-1. The combined fractions were concentrated in
a rotary evaporator (45 °C) and the residue was redissolved in 1 mL of acetonitrile, followed by the addition of 50 µL of standard terbuthylazine solution (100 µg mL-1) to the vial
and the injection of 10 µL into the HPLC/DAD.
Analytical instrumentation and operating conditions
The analysis was performed with a Varian HPLC system equipped with a 410 autosampler, a 240 quaternary pump and 330 UV diode-array detector linked to a personal computer running the software program Varian ProStar, version 5.5 (Varian, USA). The analytical column (250 mm
× 4.6 mm I.D.) used here was an Omnisphere 5 µm C18, and the guard column (20 mm × 4.6 mm I.D.) was also an Omnisphere 5 µm C18.
For the HPLC analysis, an aliquot (10 µL) was injected into the column and eluted at room temperature at a constant flow-rate of 1 mL min-1 under the following
conditions. The analytes were eluted with acetonitrile:water with initial composition of 18% acetonitrile, increasing to 40% at 6 min, 80% at 35 min, 90% at 40 min, and 100% acetonitrile at 45 min, where it was kept constant for 3 min and then linearly decreased to the initial analysis conditions
in 10 min. The detection and quantification were performed at 230 nm. Analytes were identified by their retention time and identification was confirmed by comparison of their UV spectra to that of standard solutions.
Results and Discussion
Validation
The above described extraction procedure was conducted based on previously described methods.19-22
No analytical method is reported in the literature for the simultaneous determination of these pesticides in water. Vega et al.,23 described a method for determining 32
pesticides in water, including methomyl, carbendazin, imidacloprid, acetamiprid, aldicarb, carbofuran, diuron, triflumuron and lufenuron. The procedures described by these authors were modified and further improved for water analysis.
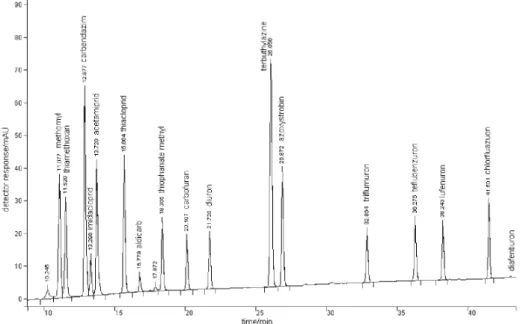
All the pesticides were completely separated using a gradient elution with acetonitrile and water in a C18 column. This afforded good resolution in a reasonable time (Figure 2).
The choice of SDVB as the solid-phase was based on the fact that it increases the retention of polar compounds and minimizes breakthrough compared to C18 and other materials.9,10,24,25 SPE with SDVB cartridge was used to
attain suitable sensitivity. Various extraction solvents were studied to elute the pesticides retained in this sorbent. The proportion of methanol:acetonitrile 7:3 (v/v) was considered the best for the extraction because a good baseline and fewer interfering peaks were obtained with these solvents.
The method’s performance was assessed based on quality parameters such as response linearity, accuracy, precision, detection limit and quantification. Five point analytical graphs were constructed between peak areas and analyte concentrations. Good linearities were achieved between 0.2 and 10 µg mL-1 and determination coefficients
were higher than 0.996. The active ingredients were quantitatively analyzed by the internal standard method. The pesticides were identified based on retention times and UV spectra acquired with standard solutions.
Recovery values (>70%) were found for all the pesticides at all fortification levels except for aldicarb, thiacloprid and imidacloprid. The mean recoveries of methomyl, thiamethoxan, acetamiprid, azoxystrobin, triflumuron, teflubenzuron, carbofuran, carbendazin and diuron ranged from 73% to 113%, with a relative standard deviation (RSD) of 2 to 16%, ensuring the method’s accuracy and precision (Table 1).
The limits of detection (LOD) were defined as a response three times the average height of the blank baseline noise and the limits of quantitation (LOQ) were defined as a response ten times the average height of the blank baseline noise.26 Based on these parameters, the results ranged from
0.06 to 0.57 µg L-1 for LOD and from 0.19 to 1.90 µg L-1
for LOQ. Ying and Kookana27 determined imidacloprid,
thiacloprid and thiamethoxan in water (50 mL) using SPE with C18 and HPLC/DAD, and found the following LOQ values: 2.0; 2.0 and 0.5 µg L-1, respectively. As can be
Figure 2. HPLC/DAD chromatogram of a standard mixture of the pesticides at 10.0 µg mL-1. For chromatographic conditions see text.
Table 1. Recovery and precision of the proposed method (*n=6)
Pesticides Fortification level / (µg L-1)
Average
recovery* / (%) RSD / (%)
methomyl
0.45 109 5
1.13 73 11
2.26 81 8
11.30 83 2
22.60 82 7
thiamethoxan
0.40 114 6
0.99 73 16
1.99 83 10
9.96 91 2
19.92 96 5
carbendazin
0.41 112 8
1.02 109 3
2.04 97 11
10.20 93 11
20.30 92 7
imidacloprid
1.98 80 14
9.90 83 6
19.80 84 5
acetamiprid
0.40 93 5
1.00 90 8
2.01 84 7
10.04 90 2
18.24 105 5
thiacloprid
1.96 93 7
9.80 90 2
19.60 88 5
Pesticides Fortification level /(µg L-1) recovery* / (%)Average RSD / (%)
aldicarb
1.01 91 8
2.02 102 7
10.10 88 4
20.20 73 4
carbofuran
0.44 106 6
1.10 91 9
2.20 78 13
11.00 92 6
22.08 84 14
diuron
0.42 102 5
1.06 91 7
2.12 100 9
10.60 97 8
21.12 94 9
azoxystrobin
0.42 110 5
1.05 89 4
2.10 84 5
10.50 87 3
21.00 89 3
triflumuron
0.41 108 6
1.02 103 10
2.04 79 7
10.20 85 3
20.40 77 8
teflubenzuron
0.41 114 3
1.02 93 7
2.04 81 7
10.20 85 3
seen, in comparison with their values, the LOQ values for these pesticides found by the method proposed herein were similar (Table 2). Brondi and Lanças18 determined diuron
in water (100 mL) using SPE with C18 and HPLC/UV, and found recoveries similar to our results but higher LOD and LOQ values (20 and 65 µg L-1, respectively). The different
solid phase and smaller water volume used by those authors may explain these higher limits.
We were unable to analyze imidacloprid at the two lower levels due to the low detector response for this pesticide and the fact that it elutes close to carbendazin which has a better response in the detector. So the poor separation of these two compounds may be the reason for the difficulties in the quantification of imidacloprid at lower levels. However, at the high levels, satisfactory recovery values of 80% were observed, with RSD values between 5 and 14%. Aldicarb and thiacloprid showed recovery rates exceeding 120% at the lower levels due to background problems. However, at the higher levels (2.0, 10.0 and 20.0 µg L-1) they showed
good recovery percentages and RSD values. Vega et al.,23
obtained good recoveries for imidacloprid and aldicarb at a lower level (0.05 µg L-1), using LC/ESI/MS.
Recovery percentages for lufenuron, chlorfluazuron and diafenthiuron were not satisfactory in this study. Recoveries (> 120%) for these pesticides at the lower fortification levels were high, probably due to background problems, while at the high concentration levels, lower recovery values (< 70%) were achieved as reported by Vega et al.,23 for lufenuron.
Detection limits for imidacloprid, thiacloprid and aldicarb were higher than the maximum limits established by the European Economic Commission for these pesticides in drinking water (0.1 µg L-1). However, Brazilian law does
not establish limits for most of the pesticides used in cotton plantations; thus, the application of this method provides results that are far from negligible, despite the fact that some of the analyzed pesticides present detection limits above the concentrations allowed by international legislation.
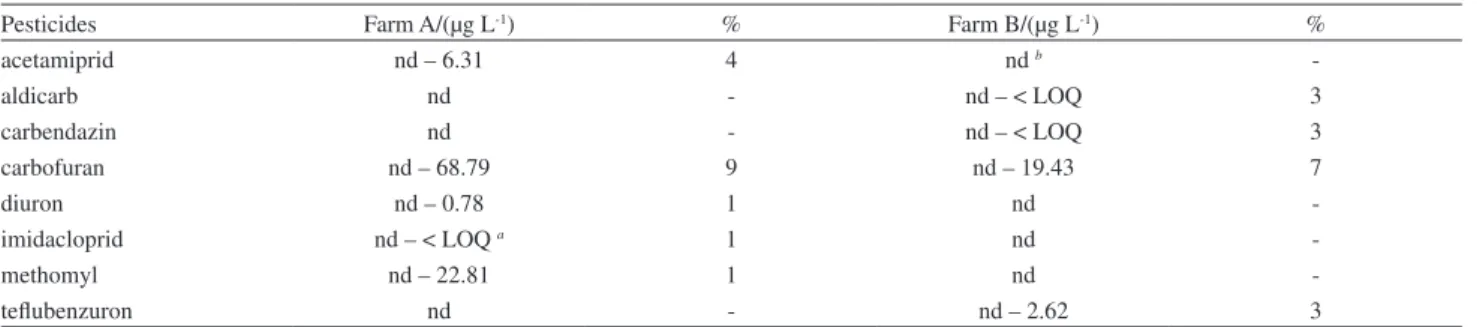
Analysis of real samples
Among the pesticides studied here, acetamiprid, aldicarb, carbendazin, carbofuran, diuron, imidacloprid, methomyl and teflubenzuron were found in the shallow groundwater samples (Table 3).
Table 2. Analytical parameters for pesticides in water samples
Pesticides Calibration curve equationa r2 LOD /(µg L-1) LOQ /(µg L-1)
methomyl y = 0.3639x – 0.007592 0.9980 0.10 0.45
thiamethoxan y = 0.3392x – 0.007407 0.9980 0.08 0.40
carbendazin y = 0.33883x – 0.015346 0.9998 0.11 0.41
imidacloprid y = 0.1077x + 0.01078 0.9991 0.57 1.98
acetamiprid y = 0.6248x – 0.007353 0.9983 0.06 0.40
thiacloprid y = 0.4538x – 0.02501 0.9968 1.26 1.96
aldicarb y = 0.06035x – 0.002472 0.9964 1.01 1.01
carbofuran y = 0.079153x – 0.0006248 0.9999 0.10 0.44
diuron y = 0.016678x – 0.0012366 0.9999 0.07 0.42
azoxystrobin y = 0.4756x – 0.005099 0.9983 0.08 0.42
triflumuron y = 0.2310x – 0.001835 0.9987 0.11 0.41
teflubenzuron y = 0.3132x – 0.005857 0.9982 0.06 0.41
a y = pesticide concentration; x = chromatographic response (peak area).
Table 3. Range of concentration (µg L-1) and detection frequency (%) of the pesticides in water samples
Pesticides Farm A/(µg L-1) % Farm B/(µg L-1) %
acetamiprid nd – 6.31 4 nd b
-aldicarb nd - nd – < LOQ 3
carbendazin nd - nd – < LOQ 3
carbofuran nd – 68.79 9 nd – 19.43 7
diuron nd – 0.78 1 nd
-imidacloprid nd – < LOQ a 1 nd
-methomyl nd – 22.81 1 nd
-teflubenzuron nd - nd – 2.62 3
On farm A, diuron, imidacloprid and methomyl were detected only once during the pesticides application period. Acetamiprid and carbofuran were the most frequently detected, i.e., 4% and 9% of the samples, respectively. On
farm B, carbofuran was detected in 7% of the samples, while aldicarb, carbendazin and teflubenzuron were found in 3% of the samples.
Aldicarb, a toxicological class I (extremely toxic) and environmental class II (very harmful) insecticide was not applied during the study period but was mentioned by the farmers to have been used in the past.28 However, it was
detected in 3% of the samples, probably due to its application in previous years. This pesticide is highly mobile in the environment thanks to its high solubility in water and low sorption in soil particles. Its half-life in basic medium is only a few days, but it persists in an acid medium, as is the case of the areas studied here. In an aquatic medium, aldicarb is degraded by microorganisms and by sunlight, thus representing a higher risk for underground waters than for surface waters.
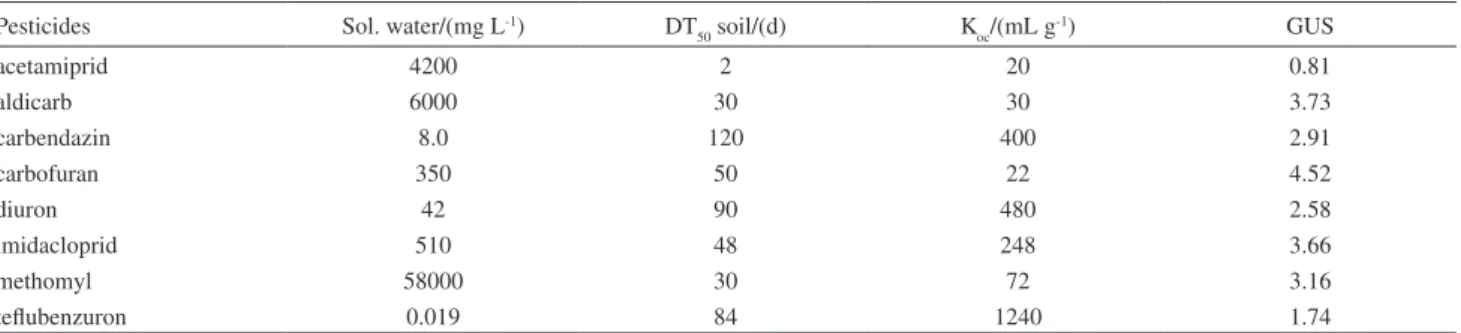
According to the criteria of the U.S. Environmental Protection Agency, the sorption coefficient (Koc), water solubility and half-life in soil are important parameters to classify pesticides as water contaminants (Table 4). All pesticides except acetamiprid and teflubenzuron are classified as groundwater leachers, according to the GUS index.29 On the other hand, acetamiprid, albeit classified as
non-leacher, shows high water solubility and low Koc and a half-life in soil that, although very low, should allow it to be released from soils.
Among the pesticides studied, carbofuran was the most frequently detected in high concentrations. Carbosulfan is applied several times from February to May in cotton plantations, coinciding with the period when carbofuran was detected. Carbosulfan degrades rapidly into carbofuran in soil. Therefore, the high level of contamination by this pesticide found in this study was caused by its physical characteristics of high water solubility and low Koc. Carbofuran has been detected in groundwater samples in different countries.30,31
Table 4. Physicochemical properties and GUS index of the pesticides detected in the water samples
Pesticides Sol. water/(mg L-1) DT
50 soil/(d) Koc/(mL g-1) GUS
acetamiprid 4200 2 20 0.81
aldicarb 6000 30 30 3.73
carbendazin 8.0 120 400 2.91
carbofuran 350 50 22 4.52
diuron 42 90 480 2.58
imidacloprid 510 48 248 3.66
methomyl 58000 30 72 3.16
teflubenzuron 0.019 84 1240 1.74
Source: Tomlin,33 Spadotto et al.34.
The “Primavera do Leste” region presents some important characteristics which should be considered when the vulnerability of water resources to contamination is under analysis: is located in an aquifer recharge area which has been intensively exploited in the urban and rural areas and soils are predominantly Oxisols, which are well drained and have medium permeability. Rainfall events are intense in the months from October to March which coincide with pesticides application in temporary crops.32
Intense rains just after pesticide application is likely to occur in this region, thus pesticides transport is intensified by run-off and leaching. Among the pesticides used in this region, several showed high potential of underground and/ or surface water contamination.
Although the analyzed pesticides were detected with low frequency in the areas under study, since the factors responsible for the degradation of these substances, such as sunlight, bacterial activity, oxygen concentration, are either absent or present at a much lower intensity in the deeper layers of the soil, the presence of these substances in groundwater is an indication of these waters’ vulnerability to contamination.
Conclusions
The SPE-based methodology developed here allows the simultaneous determination of 12 pesticides with different polarities by HPLC/DAD in water samples from agricultural areas. Internal quality control was applied in the analysis of these samples, and satisfactory accuracy and precision were achieved in monitoring trace levels of pesticides in water.
contamination in the selected areas and motivated currently ongoing studies to evaluate the influence of farming practices (such as non-tilling) on the fate of pesticides, aiming to minimize the impact of these compounds in cotton-growing areas.
Ackowledgments
The authors thank FACUAL and MCT/CNPq (Brazil) for their financial support and a fellowship.
References
1. Dores, F. G. C. D.; Monnerat, R. G.; Praça, L. B.; Sujii, E. R.; Vechiato, A. B. In Algodão: Pesquisa e Resultados para
o Campo; Moresco, E. (org). CTP: Cuiabá, 2006, v.2, ch.15,
p. 361.
2. El Atrache, L. L.; Sabbah, S.; Morizur, J. P.; Talanta2005, 65,
603.
3. Irace-Guigand, S.; Aaron, J. J.; Scribe, P.; Barceló, D.;
Chemosphere2004, 55, 973.
4. Gomes, M. A. F.; Spadotto, C. A.; Lanchote, V. L.; Pesticidas:
R. Ecotoxicol. Meio Ambiente 2001, 11, 65.
5. Dores, E. F. G. C.; Navickiene, S.; Cunha, M. L. F.; Carbo, L.; Ribeiro, M. L.; De-Lamonica-Freire, E. M.; J. Braz. Chem. Soc. 2006, 17, 866.
6. Souza, V.; Carbo, L.; Dores, E. F. G. C.; Ribeiro, M. L.; Vecchiato, A. B.; Weber, O. L. S.; Pinto, A. A.; Spadotto, C. A.; Cunha, M. L. F.; Annals of the XIII Congresso Brasileiro de Águas Subterrâneas, Cuiabá-MT, Brazil, CD-Rom, 2004. 7. Portaria MS nº 518/2004, Available at: http://portalweb05.saude.
gov.br/portal/arquivos/pdf/portaria_518_2004.pdf, accessed in July 2006.
8. Council Directive 98/83/EC of 3 November 1998 on the quality of water intended for human consumption OJ L 330, 5.12.1998, p. 32-54.
9. Sabik, H.; Jeannot, R.; Rondeau, B.; J. Chromatogr. A2000,
885, 217.
10. Pichon, V.; Charpak, M.; Henion, M. C.; J. Chromatogr. A1998,
795, 83.
11. Bruzzoniti, M. C.; Sarzanini, C.; Mentasti, E.; J. Chromatogr. A2000, 902, 289.
12. Ruberu, S. R.; Draper, W. M.; Perera, S. K.; J. Agric. Food.
Chem.2000, 48, 4109.
13. Mendas, G.; Drevenkar, V.; Zupancic-Kralj, L.; J. Chromatogr. A2001, 918, 351.
14. Fernandez-Alba, A. R.; Agüera, A.; Contreras, M.; Peñuela, G.; Ferrer, I.; Barceló, D.; J. Chromatogr. A1998, 823, 35.
15. Geerdink, R. B.; Niessen, W. M. A.; Th. Brinkman, U. A.; J.
Chromatogr. A2002, 970, 65.
16. Seccia, S.; Fidente, P.; Barbini, D. A.; Morrica, P.; Anal. Chim. Acta2005, 553, 21.
17. Garcia, M. D. G.; Galera, M. M.; Martinez, D. B.; Gallego, J.
G.; J. Chromatogr. A2006, 1103, 271.
18. Brondi, S. H. G.; Lanças, F. M.; J. Braz. Chem. Soc. 2005, 16,
650.
19. Junker-Buchheit, A.; Witzenbacher, M.; J. Chromatogr. A1996,
737, 67.
20. Baskaran, S.; Kookana, R. S.; Naidu, R.; J. Chromatogr. A1997,
787, 271.
21. Di Corcia, A.; Nazzari, M.; Rao, R.; Samperi, R.; Sebastiani, E.; J. Chromatogr. A2000, 878, 87.
22. Vandecasteele, K.; Gaus, I.; Debreuck, W.; Walraevens,
K.; Anal. Chem 2000, 72, 3093.
23. Vega, A. B.; Frenich, A. G.; Vidal, J. L. M.; Anal. Chim. Acta
2005, 538, 117.
24. Mills, G. R.; J. Chromatogr. A1998, 813, 63.
25. Morrica, P.; Fidente, P.; Seccia, S.; Biomed. Chromatogr.2005,
19, 107.
26. Ribani, M.; Bottoli, C. B. G.; Collins, C. H.; Jardim, I. C. S. F.; Mello, L. F. C.; Quim. Nova 2004, 27, 771.
27. Ying, G. G.; Kookana, R. S.; J. Environ. Sci. Health, Part B
2004, 39, 737.
28. Brasil (Agência Nacional de Vigilância Sanitária). Available at: http://www4.anvisa.gov.br/agrosia/asp/default.asp, accessed in July 2006.
29. Gustafson, D. I.; Environ. Toxicol. Chem1989, 8, 339. 30. Albanis, T. A.; Hela, D. G.; Sakellarides, T. M.; Konstantinou,
I. K.; J. Chromatogr. A1998, 823, 59.
31. Tariq, M. I.; Afazal, S.; Hussain, I.; Environ. International2004,
30, 471.
32. Dores, E. F. G. C.; De-Lamonica-Freire, E. M.; Quim. Nova
2001, 24, 27.
33. Tomlin, C. D. S.; A World Compendium: The e-Pesticide
Manual. 12nd ed.; version 2.1, 2001-2002.
34. Spadotto, C. A.; Filizola, H.; Gomes, M. A. F. R. Pesticidas:
Revista de Ecotoxicol. e Meio Ambiente 2001, 11, 127.
Received: September 28, 2007
Web Release Date: July 11, 2008