AR
TICLE
1 Programa de Pós-Graduação em Saúde Coletiva, Instituto de Saúde Coletiva, Universidade Federal de Mato Grosso (UFMT). Av. Fernando Correa s/n, Campus Universitário. 78060-900 Cuiabá MT Brasil. pignatimt@gmail.com 2 Núcleo de Estudos Ambientais e Saúde do Trabalhador, Instituto de Saúde Coletiva, UFMT. Cuiabá MT Brasil.
Spatial distribution of pesticide use in Brazil:
a strategy for Health Surveillance
Abstract The intensive use of pesticides in
Bra-zilian agriculture is a public health issue due to contamination of the environment, food and hu-man health poisoning. The study aimed to show the spatial distribution of the planted area of ag-ricultural crops, the use of pesticides and related health problems, as a Health Surveillance strate-gy. We obtained data from the planted area of 21 predominant crops, indicators of the consumption of pesticides per hectare for each crop and health problems. The amount of pesticides used in the Brazilian municipalities was spatially distribut-ed and correlatdistribut-ed with the incidence of pesticides poisoning: acute, sub-acute and chronic. There was a predominance of soybean, corn and sugar cane crops, which together accounted for 76% of the area planted in Brazil in 2015. Some 899 million liters of pesticides were sprayed in these crops, and Mato Grosso, Paraná and Rio Grande Sul used the largest quantities, respectively. The health problems showed positive and significant correlations with pesticide use. The methodolog-ical strategy facilitated the identification of pri-ority municipalities for Health Surveillance and the development of intersectoral actions to prevent and mitigate the impacts of pesticides on health and the environment.
Key words Spatial distribution, Pesticides, Agri-business, Health Surveillance
Wanderlei Antonio Pignati 1
Francco Antonio Neri de Souza e Lima 2
Stephanie Sommerfeld de Lara 1
Marcia Leopoldina Montanari Correa 1
Jackson Rogério Barbosa 2
Luís Henrique da Costa Leão 1
Pig
nat
Introduction
Brazil is one of the largest agricultural produc-ers in the world and the second largest country exporting these products, playing an important role in the Brazilian economy. To keep up this production, this sector uses intensively transgen-ic seeds and chemtransgen-ical inputs, such as fertilizers and pesticides. Brazil’s extensive planting area has made the country the largest consumer of pesti-cides in the world. The imposition of the Green Revolution Policy, transgenic crops, increased crop pests, subsidized agricultural credits and tax exemption are factors that have contributed to the increased consumption of pesticides1. In
addition to these factors are weaknesses in state surveillance over their use and the lack of poli-cies that curb the use of pesticides and encourage agroecological production.
In large areas of monocultures, these poison syrups are sprayed by tractors and airplanes over crops, which affect not only “pests” in plants, but also environmental matrices such as soil, surface water, air, rain and food. These are intentional pollutions, since spraying targets insects, fungi or “weeds”, and in this process, plantations and environmental matrices are contaminated, as well as workers, dwellers of the surroundings and other animals. This production model gen-erates complex risk situations and “rural acci-dents” that challenge health surveillance actions and their methodologies. These events have been denounced by social movements and evidenced by the society that coexists in this model of agri-cultural production2,3. However, there are few
re-cords of acute, sub-acute and chronic poisoning related to the use of pesticides.
The lack of data on the consumption of pes-ticides, their types and volumes used in Brazilian municipalities, the lack of knowledge about their toxic potential and of laboratory diagnoses and the pressure/harassment of agribusiness farmers who hold public positions favor concealment and invisibility of this important public health issue4,5.
In this setting, public institutions, research-ers, health professionals and society face difficul-ties in obtaining total/real data on the volume and types of pesticides used in a given farm or region, contravening Law Nº 12.527/20116 on
ac-cess to information. In addition, the Agricultural Census, which is an important and useful source of information on agriculture in the country, was not performed in 2016.
Considering the need for greater technical support for the implantation and
implementa-tion of the Health Surveillance of Populaimplementa-tions Exposed to Pesticides in the national territory, this paper aims to show the spatial distribution of the planted area of agricultural crops, to gen-erate estimates of the use of pesticides and asso-ciate the consumption of pesticides with indica-tors of acute, sub-acute and chronic poisoning by these substances in Brazilian municipalities. This methodological strategy aims to identify priority regions for promotion, prevention and precau-tion acprecau-tions related to health problems and envi-ronmental damage.
Methodology
This is an ecological epidemiological study. We carried out the spatial distribution of environ-mental indicators (planted area and consump-tion of pesticides) and the correlaconsump-tion with health indicators (acute, sub-acute and chronic poison-ing), considering as a possible cause the toxicity of pesticides from human exposure and occupa-tional, environmental and food contamination.
In order to establish correlations, the mu-nicipalities of Mato Grosso State were used to exemplify the usefulness of this methodological strategy for surveillance actions in Brazilian mu-nicipalities.
Environmental indicators
We retrieved data of crops planted area from the Municipal Agricultural Production (PAM) of the IBGE Automatic Retrieval System of the Brazilian Institute of Geography and Statistics (IBGE-SIDRA) for the year 20157. We opted for
the variable planted area to the harvest, in hect-ares of temporary and permanent crops and de-fined the use of pesticides sprayed according to crop type, “pests” to be combated and amount of hectares planted8.
This study used 21 varieties of predominant crops in the Brazilian territory dependent on chemical inputs, among the 66 crops available in IBGE-SIDRA. We selected the crops of pine-apple, cotton, rice, sugar cane, beans, tobacco, sunflower, watermelon, melon, corn, soybean, tomato and wheat in the temporary crop. Perma-nent crops were banana, coffee, papaya, mango, grape and citrus fruits (sum of orange, lemon and mandarin).
In order to estimate the consumption of pes-ticides, the methodology of Pignati et al.8
aúd
e C
ole
tiv
a,
22(10):3281-3293,
2017
used per hectare for four agricultural crops (cot-ton, sugar cane, corn and soybean) in Mato Gros-so, formulated from the Mato Grosso Agricul-tural Defense Institute (INDEA-MT)9 database,
which aggregated information on agronomic prescriptions containing the use of pesticides by municipality, volume (liters) used, size of the treated area and type of “pest” to be combated.
Based on this database and methodology, the mean amount of pesticide used per hectare was generated for other 17 crops and the estimated values for soybean, sugar cane, corn and cotton crops were updated based on consultancies with agronomists and farmers during research carried out by the Center for Environmental Studies and Workers’ Health (NEAST). Literature that quan-tified mean pesticide used per hectare in some crops was also used10,11.
The types of active ingredients frequently used in Mato Grosso’s crops were adapted from three sources. The first one, by Pignati et al.8,
which listed the most used active ingredients in 2012 and their respective volumes per hect-are in Mato Grosso; the second, from the 2014 sales data made available by IBAMA; the third, from research projects conducted by NEAST of the Federal University of Mato Grosso (UFMT) for 2016, which includes agronomic prescription data from the second, third and eleventh largest municipal pesticide users in Mato Grosso in the 2014/2015 harvest.
The calculation to estimate the use of pes-ticides in the municipalities was based on the multiplication of indicators (mean amount of pesticides used per hectare of a given crop) by the hectares planted in the 21 agricultural crops studied. Subsequently, we added the total amount of liters of pesticides obtained from all agricultural crops for each municipality, obtain-ing the total estimate of pesticide use by Brazil-ian municipality. We listed the most used active ingredients in Mato Grosso and their respective volumes used in soybean, corn, sugar cane and cotton crops and potential health problems that each product may cause8.
Health indicators
We obtained health data from the Depart-ment of Information Technology of the Unified Health System (DATASUS) of the Ministry of Health12. We selected a health indicator of each
poisoning type with probable cause of occupa-tional, food and environmental exposure to the use of pesticides: acute (pesticide poisoning),
sub-acute (fetal malformations) and chronic (childhood and juvenile cancer).
Data on poisoning by pesticides for agri-cultural, veterinary and rat poison use, by place of residence were retrieved from the Notifiable Diseases Information System (SINAN). Fetal malformation data were acquired from the Live Birth Information System (SINASC), referring to the evidence of congenital anomalies by moth-er’s place of residence. Scientific evidence shows a higher occurrence of malformation in mothers living in rural areas, where mother exposure and mother/father occupational exposure13,14 to
pes-ticides is found.
Cancer data were obtained from the Mortali-ty Information System (SIM), referring to cancer deaths in the 0-19 age group, characterized as childhood cancer, following the 10th
Internation-al Classification of Diseases (ICD-10) ), Codes C00 to C97, by place of residence. The children and adolescents group was chosen due to the sus-ceptibility to environmental exposure to chem-icals and since most cases of cancer (80%) are environment-related15.
From the health data, mean coefficients of each health indicator were generated by mu-nicipality of Mato Grosso, represented by the following calculation: we added the number of disease/death cases from 2012 to 2014. Then, the arithmetic mean was calculated by the number of years studied (5 years). The arithmetic mean was used in the numerator and the 2013 population was used as denominator, referring to half of the period, and later, the value found was multiplied by the standardized constant for each indicator16.
Thus, we obtained the 2013 population estimate in DATASUS. These are negative indicators, be-cause the higher their value, the greater the risk of occurrence and deaths in the population.
Statistical review
Excel 2010 software was used for the elabo-ration of tables and Esri’s ArcGis 10.1 was used to make thematic maps. Environmental indi-cators were classified in geometric intervals of eight classes for the municipalities of Brazil and five classes for the municipalities of Mato Gros-so, and later, the environmental information was spatialized so that the darker shades represented the largest amount of planted area and consump-tion of pesticides.
Pig
nat
estimated using Spearman’s correlation test, con-sidering non-parametric data distribution, as indicated by the Kolmogorov-Smirnov test. The correlation matrix was constructed between the amount of liters of pesticides consumed (inde-pendent variable) and the mean coefficient of acute, sub-acute and chronic poisoning by pes-ticides (dependent variables) in the 141 munici-palities of Mato Grosso.
The discussion about statistical significance was expanded, which in this study, in addition to the p-value of 5%, a p-value of less than 20% was considered significant, based on the precaution-ary principle that seeks to avoid damage due to scientific uncertainty on its impact18, so that this
proposal becomes relevant for the implementa-tion of acimplementa-tions of Health Surveillance of Popula-tions Exposed to Pesticides. The approach shown is also based on the perspective of Critical Epi-demiology, proposed by Breilh19 that emphasizes
participatory monitoring, based on situations of exposure and imposition of pesticides observed in reality, in a dialectical, critical and reflexive way.
Results
In 2015, Brazil planted 71.2 million hectares of crops in the 21 crops analyzed, and among them, soybean accounted for 42% of the country’s total planted area (32.2 million hectares), followed by corn with 21% (15.8 million hectares) and sugar cane with 13% (10.1 million hectares). Together, these three crops accounted for 76% of Brazil’s total planted area and were the ones that con-sumed pesticides the most, corresponding to 82% of all Brazilian consumption in 2015 (Table 1). An estimated total of 899 million liters of pesti-cides formulated products were sprayed on the 21 types of Brazilian crops that year.
Soybean was the crop that most used pesti-cides in Brazil, accounting for 63% of the total, followed by corn (13%) and sugar cane (5%). Tobacco was the crop with the highest mean amount of liters of pesticides per hectare with 60 l/ha. Cotton came second, consuming 28.6 l/ha, followed by citrus fruits (23 l/ha), tomato (20 l/ ha), soybean (17.7 l/ha), grape (12 l/ha), banana (10 l/ha), rice (10 l/ha), wheat (10 l/ha), papaya (10 l/ha), corn (7.4 l/ha) and sunflower (7.4 l/ha). Other crops used less than five liters per planted hectare.
According to analyzed crops, Mato Grosso planted 13.9 million hectares and consumed 207 million liters of pesticides, followed by Paraná,
with 10.2 million planted hectares, consuming 135 million liters of pesticides and Rio Grande do Sul, with 8.5 million planted hectares, using 134 million liters of pesticides (Table 2).
The amount of planted area of monocultures was spatialized by Brazilian municipalities as shown in Figure 1, facilitating the identification of the regions with the largest planted areas.
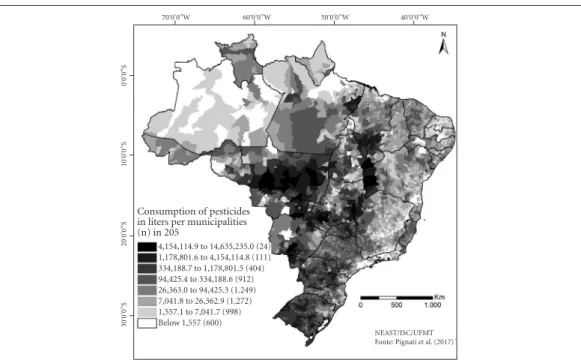
Likewise, the municipalities that obtained the largest quantities of planted area were also the ones that used the most pesticides, as shown in Figure 2.
The ten municipalities that used the most pesticides in liters in Brazil were: Sorriso-MT (14.6 million), Sapezal-MT (11.1 million), São Desidério-BA (10.2 million), Campo Novo do Parecis-MT (9.1 million), Nova Mutum-MT (9.0 million), Formosa do Rio Preto-BA (8.1 million), Nova Ubiratã-MT (8.0 million), Diamantino-MT (7.6 million), Rio Verde-GO (7.3 million), Cam-po Verde-MT (6.7million). In 2015, 24 munici-palities used between 4.1 and 14.6 million liters of pesticides, 111 municipalities used 1.1 mil-lion to 4.1 milmil-lion liters, 404 used 334,000 to 1.7 million liters, 912 municipalities used between 94,400 and 334,000 liters, 1,249 municipalities used between 26,300 to 94,400 liters, 1,272 mu-nicipalities used between 7,000 and 26,300 liters, 998 municipalities used between 1,500 and 7,000 liters and 600 municipalities under 1,500 liters.
Information on the type of pesticides (her-bicides, insecticides or fungicides) and active ingredients used in the municipalities’ crops is fundamental to the association with the most frequent health effects in the population of pre-dominantly agricultural municipalities.
The 20 most frequently used active ingredi-ents in the period 2012-2016 were Glyphosate (herbicide), Chlorpyrifos (insecticide), 2.4-D (herbicide), Atrazine (herbicide), mineral oil (adjuvant), Mancozeb (fungicide), Methoxy-fenozide (Insecticide), Acephate (insecticide), Haloxyfop-P-methyl (herbicide), Lactofen (her-bicide), Methomyl (insecticide), Diquat (herbi-cide), Picoxystrobin (fungi(herbi-cide), Flumetsulam (herbicide), Teflubenzuron (insecticide), Imida-cloprid (insecticide), Lambda-cyhalothrin (in-secticide), Imazethapyr (herbicide), Azoxystrob-in (Fungicide) and Flutriafol (Fungicide). Of these 15% are extremely toxic, 25% highly toxic, 35% moderately toxic, and 25% are poorly toxic in the toxicological classification for humans.
aúd
e C
ole
tiv
a,
22(10):3281-3293,
2017
ha), 2.4-D (1.0 l/ha), Metolachlor (0.7 l/ha), Tebuthiuron (0.6 l/ha), Trifluralin (0.4 l/ha), Paraquat (0.3 l/ha), Flutriafol (0.25 l/ha), Carbo-furan (0.2 l/h) and others. In corn crops, active ingredients were Atrazine (3.55 l/ha), Glyphosate (0.4 l/ha), Chlorpyrifos (0.25 l/ha), Methomyl (0.2 l/ha), Tebuthiuron (2.0 l/ha) and others. In cotton crops, active ingredients were Chlorpyri-fos (6.25 l/ha), Clomazone (3.8 l/ha), Trifluralin (2.6 l/ha), Methomyl (1.35 l/ha), Diuron 1.2 l/ ha), Ethephon (1.0 l/ha) and others. In sugar cane crops, active ingredients were Glyphosate (1.3 l/ha), Metribuzin (0.5 l/ha), Trifluralin (0.5 l/ha), 2.4-D (0.25 l/ha), Tebuconazole (0.4 l/ha), Diuron (0.45 l/ha), MSMA (0.25 l/ha), Carbofu-ran (0.2 l/ha) and others.
The following health indicators were selected from the acute and chronic diseases described in scientific literature8,21 related to exposure to
pes-ticides: acute poisoning by pesticides, incidence of fetal malformation (sub-acute poisoning) and childhood cancer mortality (chronic poisoning).
Figure 3 shows, as an example, the spatial dis-tribution thematic map, with the environmental and health indicators for the state of Mato Gros-so. However, maps can be built for all Brazilian states through this methodology.
The mean coefficients of health indicators were concentrated in the municipalities of cen-tral and southern Mato Grosso, accompanying the municipalities with the highest consumption of pesticides. These indicators were correlated to the environmental indicator of consumption of pesticides by municipality of Mato Grosso.
Spearman’s correlation coefficient between pesticide use (liters) in 2015 and the mean acute poisoning coefficient (2012-2014) was 13.2% for a p-value of 0.11. In addition, Spearman’s cor-relation coefficient between consumption of pes-ticides (liters) in 2015 and the mean coefficient of incidence of fetal malformation (2012-2014) was 14% for a p-value of 0.09. Finally, Spear-man’s correlation coefficient between consump-tion of pesticides (liters) in 2015 and the mean coefficient of childhood cancer mortality (2012-2014) was 17% for a p-value of 0.04.
It is observed that both health indicators showed a positive correlation with the environ-mental indicator, indicating that insofar as con-sumption of pesticides increases, the mean coef-ficient of acute, sub-acute (fetal malformation) and chronic (childhood cancer) poisoning also increases.
Table 1. Planted area, mean use per hectare and total pesticides by type of crop in Brazil, 2015.
Crop Planted area (hectares) Mean use of pesticides (liters/hectares)
Pesticides consumption (liters)
Soybean 32,206,787 17.7 570,060,129.90
Corn 15,846,517 7.4 117,264,225.80
Sugar cane 10,161,622 4.8 48,775,785.60
Cotton 1,047,622 28.6 29,961,989.20
Wheat 2,490,115 10 24,901,150.00
Tobacco 406,377 60 24,382,620.00
Rice 2,162,178 10 21,621,780.00
Coffee 1,988,272 10 19,882,720.00
Citrus fruits 766,516 23 17,629,868.00
Bean 3,130,036 5 15,650,180.00
Banana 484,430 10 4,844,300.00
Tomato 63,626 20 1,272,520.00
Grape 78,026 12 936,312.00
Sunflower 111,843 7.4 827,638.20
Papaya 30,445 10 304,450.00
Watermelon 97,910 3 293,730.00
Pineapple 69,565 3 208,695.00
Mango 64,412 3 193,236.00
Melon 20,837 3 62,511.00
Total 71,227,136 - 899,073,840.70
Pig
nat
Discussion
The results showed the predominance of plant-ed area of soybean, corn and sugar cane crops in the country. This reflects the Brazilian devel-opment-oriented policy focused mainly on the production of primary goods for export. This
“commoditization” generates impacts on pub-lic health, affects vast territories and involves different population groups when compared to peasant, agroecological and family agriculture1.
Regional discrepancies in agricultural produc-tion are accompanied by a technological and tax incentive process for land exploitation and use
Table 2. Planted area of the analyzed crops, their respective consumption of pesticides and predominance of agricultural crops by Federated Unit, Brazil, 2015.
Federated Unit
Studied crops planted area
(hectare)
%* Consumption of
pesticides (liters) Crop predominance in the Federated Units
MT 13,980,996 98.7 207,735,607 Soybean (63%), corn (25%), cotton (4%), sugar
cane (2%), bean (2%), rice (1%), sunflower (1%)
PR 10,255,468 96.3 135,470,543 Soybean (49%), corn (23%), wheat (12%), sugar
cane (6%) bean (4%), tobacco (1%)
RS 8,543,105 95.3 133,788,693 Soybean (59%), rice (13%), wheat (10%), corn
(10%), tobacco (2%), bean (1%), grape (1%)
SP 8,136,504 96 61,797,269 Sugar cane (66%), corn (10%), soybean (9%),
citrus fruits (5%), wheat (1%), bean (1%), banana (1%)
GO 5,830,192 95.5 75,135,233 Soybean (53%), corn (23%), sugar cane (15%),
bean (2%), cotton (1%)
MG 5,130,624 94.5 52,731,202 Soybean and corn (24%), coffee (18%), sugar cane
(17%), bean (6%)
MS 4,665,446 98.2 58,029,601 Soybean (49%), corn (35%), sugar cane (11%),
cotton (1%)
BA 3,643,888 72.9 49,108,595 Soybean (29%), corn (16%), bean (11%), cotton
(11%), coffee (3%), sugar cane (2%), banana (2%), citrus fruits (1%)
MA 1,627,532 88.9 20,649,982 Soybean (42%), corn (25%), Rice (13%), Bean
(5%), sugar cane (3%), cotton (1%)
SC 1,481,843 93 23,918,055 Soybean (38%), corn (25%), rice (9%), tobacco
(7%), bean (5%), wheat (5%), banana (2%), sugar cane (1%)
PI 1,416,818 90.8 17,358,130 Soybean (43%), corn (26%), bean (14%), rice
(6%) sugar cane and cotton (1%)
TO 1,173,302 97.7 17,403,387 Soybean (69%), corn (13%), rice (10%), sugar
cane (3%) watermelon (1%), bean (1%)
CE 997,257 66.1 6,551,303 Corn (33%), bean (27%), banana (3%), sugar cane
(1%), rice (1%)
PE 763,751 91.4 4,490,610 Sugar cane (38%), corn and bean (23%), banana
(4%), mango (1%), grape (1%)
PA 762,574 57.2 9,443,170 Soybean (25%), corn (17%), rice (5%), banana
(3%), bean (3%), citrus fruits (1%), sugar cane (1%), pineapple (1%)
ES 593,627 91 5,456,549 Coffee (68%), sugar cane (12%), banana (4%),
corn (3%), bean (2%), papaya (1%)
RO 568,795 92.7 6,910,076 Soybean (38%), corn (29%), coffee (13%), rice
(7%), bean (4%), banana (1%)
AL 417,845 90.3 2,755,645 Sugar cane (67%), bean (11%), corn (7%), tobacco
(2%) citrus fruits (1%), banana (1%), rice (1%), pineapple (1%)
aúd
e C
ole
tiv
a,
22(10):3281-3293,
2017
that continues to coexist with fragilities in envi-ronmental legislation, social control, and policies that favor this chemical-dependent model.
Bombardi22 says that the high agricultural
productivity of Brazilian agribusiness is respon-sible, in total terms, for the greater consumption of pesticides, so that soybean, corn and sugar cane crops together account for almost 70% of all the use of pesticides in Brazil. This study found that these three crops accounted for 82% of the total volume of pesticides used in the country in 2015, indicating a trend of increased use in these crops.
For Altieri23, transgenic monocultures may
influence the upswing of pesticide use, such as the glyphosate herbicide used in RR (Roundap Ready) soybean tolerant to this pesticide. This
would entail the emergence of pest resistance, also increasing the consumption of other types of pesticides. In face of the findings of phytosan-itary emergencies, pesticides previously banned by regulatory agencies and which are proven to be toxic to living organisms, such as insecticide Emamectin benzoate24 will be authorized. The
falling prices of more toxic pesticides and some tax exemptions also lead to an increased amount of pesticides used, exposing the population to higher chemical loads, as well as to multiple ex-posure to different classes of use and types of pesticides1,8.
The use of maps such as those shown in this study facilitates the highlight of the potential en-vironmental pollution sites, which are
propor-Federated Unit
Studied crops planted area
(hectare)
%* Consumption of
pesticides (liters) Crop predominance in the Federated Units
SE 308,188 81.1 2,922,050 Corn (46%), sugar cane (15%), citrus fruits (13%),
bean (4%), rice (1%), banana (1%)
PB 278,061 85.2 1,631,397 Sugar cane (37%), corn and bean (20%), banana
and pineapple (3%) citrus fruits (1%)
RN 175,913 56.7 986,017 Sugar cane (19%), bean and corn (14%), Melon
(3%), banana (2%), watermelon (2%), mango (1%), pineapple (1%), papaya (1%)
DF 154,322 95.8 1,838,655 Soybean (43%), corn (41%), bean (10%), wheat
(1%), citrus fruits (1%)
RJ 133,257 88.5 1,014,804 Sugar cane (53%), banana (13%), coffee (10%),
citrus fruits (6%), pineapple (2%), tomato (2%), corn (2%), bean (1%)
AC 73,363 62.9 584,454 Corn (36%), banana (8%), bean (7%), rice (5%),
sugar cane (3%), coffee (1%), watermelon (1%), citrus fruits (1%)
RR 56,806 87.4 763,059 Soybean (37%), banana (17%), rice (12%), corn
(8%), bean (4%), citrus fruits (4%), watermelon (2%) cotton (1%), papaya (1%)
AM 36,145 29 306,916 Corn and banana (5%), watermelon (4%), citrus
fruits (3%), sugar cane (3%) and pineapple (3%), bean (2%), rice (2%), coffee (1%) and papaya (1%)
AP 21,514 62.4 292,838 Soybean (33%), banana (6%), corn and rice (5%),
pineapple (3%), citrus fruits (3%), bean (3%), watermelon (2%)
Total 71,227,136 92.7 899,073,840,70 Soybean (42%), corn (21%), sugar cane (13%), bean (4%), wheat (3%), rice (3%) and coffee (3%), cotton (1%), citrus fruits (1%), banana (1%), tobacco (1%)
* In reference to the 66 crops offered by IBGE-SIDRA. Source: IBGE-SIDRA20; Pignati et al.8
Pig
nat
tional to the intensity of agricultural production and pesticide use. In addition, maps allow us to determine the locations that should be a priority for the prevention of risks related to
contami-nation in water, rain, air, food, workers, exposed populations and animals, among others25-27, an
important tool for participatory and precaution-ary surveillance.
Figure 1. Total planted area of crops studied, by Brazilian municipality, 2015.
Figure 2. Estimated consumption of pesticides used in crops studied by Brazilian municipality, 2015. Planted area in hectares by
municipalities (n) in 2015
340,961 to 1,083,993 (19) 107,198 to 340,960 (83) 33,655 to 107,197 (347) 10,517 to 33,654 (897) 3,283 to 10,516 (1,314) 948 to 3,237 (1,281) 228 to 947 (996) Below 227 (635
NEAST/ISC/UFMT Source: Pignati et al. (2017)
30
º0’0’
’S
20
º0’0’
’S
10
º0’0’
’S
0
º0’0’
’S
70º0’0’’W 60º0’0’’W 50º0’0’’W 40º0’0’’W
NEAST/ISC/UFMT Fonte: Pignati et al. (2017)
30
º0’0’
’S
20
º0’0’
’S
10
º0’0’
’S
0
º0’0’
’S
70º0’0’’W 60º0’0’’W 50º0’0’’W 40º0’0’’W
aúd
e C
ole
tiv
a,
22(10):3281-3293,
2017
Figure 3. Consumption of pesticides and coefficients of acute (a), sub-acute (b) and chronic (c) poisoning by pesticides in the municipalities of Mato Grosso, 2015.
The extensive areas of high pesticide con-sumption monocultures are mainly located in the Cerrado (type of savanna) biome. According to the Brazilian forest code (Law Nº 12.651/2012),
the preservation of 35% of legal reserve with native vegetation is allocated to this biome and, consequently, 65% of the area is cleared for de-forestation. This makes the Cerrado one of the
52º0’0’’W 56º0’0’’W
60º0’0’’W
52º0’0’’W 56º0’0’’W
60º0’0’’W
10
º0’0’
’S
14
º0’0’
’S
18
º0’0’
’S
10
º0’0’
’S
14
º0’0’
’S
18
º0’0’
’S
10
º0’0’
’S
14
º0’0’
’S
18
º0’0’
’S
A)
B)
C)
3,311,376.7 to 14.635.235,0 (22)
744,168.4 to 3,311,386.6 (31)
162,157.0 to 744,168.3 (37)
30,209.7 to 162,156.9 (22)
296.0 to 30,209.6 (29)
Consumption of pesticides in liters in Mato Grosso state municipalities, 2015
50.1 to 87 (3)
20.1 to 50 (13)
6.1 to 20 (38)
Below 6 (33)
Silent municipality (54)
Mean coefficient of acute poisoning from agricultural pesticides per 100,000 inhabitants in the period 2012-2014
20.1 to 37 (3)
10.0 to 20 (24)
5.1 to 10 (44)
Below 5 (39)
Silent municipality (31)
Mean coefficient of incidence of fetal malformation per thousand live births in the period 2012-2014
16.1 to 32.7 (9)
8.1 to 16 (16)
2.1 to 8 (26)
Below 2 (3)
Silent municipality (87)
Mean coefficient of mortality fro childhood and juvenile cancer (C00 to C97) per 100,000 inhabitants in the period 2012-2014
NEAST/ISC/UFMT Source: Pignati et al. (2017) Datasus (MS): SINAN, SINASC and SIM
0 100 200
Km
0 100 200
Km
0 100 200
Pig
nat
most deforested biomes in the country and with a high probability of contamination of pesticides in its watersheds and aquifers. The remaining portions of the Cerrado are also directed towards the expanded agricultural border by the National Institute of Colonization and Agrarian Reform (Incra) and the Brazilian Agricultural Research Corporation (Embrapa) in a project for the states of Maranhão, Tocantins, Piauí and Bahia (acro-nym Matopiba), as observed in Figure 1.
In these regions of high and medium pesti-cide use, it will be necessary to prioritize the im-plementation of the Health Surveillance of Pop-ulations Exposed to Pesticides (VSPEA). These methodological strategies add important aspects to the operationalization of the guidelines of the National Worker Health Policy, environmen-tal health and population exposed to pesticides. Knowledge of these territories, their productive activities, social movements and operating insti-tutions, the morbidity and mortality indicators of the municipality are fundamental for the imple-mentation of a more effective Health Surveillance process enhanced by Participatory Monitoring19.
The spatial distribution of the use of pesti-cides and health diseases can also assist explor-atory analyses, generation of hypotheses and ter-ritorial associations, which can later be confirmed in statistical tests28. At the municipal level,
envi-ronmental contamination and human poisoning estimates may be inferred according to the type of predominant crop in the municipality, the types of pesticides used and their toxicological charac-teristics (such as toxicodynamics and toxicokinet-ics), serving as a warning to health professionals to subsidize Health Surveillance actions.
There is a high consumption of pesticides and health indicators do not show a significant correlation in some municipalities shown on the map. The political factors of domination and/ or harassment of agribusiness institutions over municipal governments may interfere with the non-notification of cases, as observed by Nasrala Neto et al.4 and Onishi5, generating an
“inten-tional invisibility” of those diseases.
The formulation of health indicators with pesticide poisoning data is also a challenge due to thigh underreporting of these diseases. For each reported case of acute poisoning, another 50 are not reported or are underestimated as a public health problem, interfering with the gov-ernmental information-decision-making-action process29,30.
Prolonged exposure to pesticides and acute poisoning cycles may lead to sub-acute and
chronic poisoning with irreversible damage. Some pesticides may have effects on human de-velopment, such as fetal malformations. Litera-ture indicates that mothers’ environmental expo-sure to pesticides was associated with a higher oc-currence of fetal malformation in municipalities with high pesticide use, in all quarters of preg-nancy in Mato Grosso13. Studies associate father
or mother occupational exposure to pesticides with the occurrence of fetal malformation14,31.
Exposure to chemical substances (pesticides) in regions of medium and high agricultural pro-duction has been identified as potential causal factors for cancers, since the International Agency for Research on Cancer (IARC/WHO) has classi-fied pesticides frequently used in crops as poten-tially carcinogenic, for example, glyphosate32.
Childhood cancer is an important indicator of environmental vulnerability and is the second cause of death of the population aged 0-19 years in Brazil. One of the limitations pointed out in literature regarding the study of childhood can-cer mortality is the lack of reliable records for all cancer-related deaths in this age group33.
Litera-ture points to a higher incidence of leukemia and lymphoma in the central and southern regions of the state of Mato Grosso, which correspond to re-gions with high agricultural production34,35. It is
also observed that hospitalizations for childhood cancer in the Cancer Hospital of Mato Grosso and the higher prevalence is of users coming from regions with high agricultural production34,36.
Thus, from the results of this study, we can ob-serve that health indicators (acute poisoning, inci-dence of fetal malformation and childhood cancer mortality) showed a positive correlation with the environmental indicator (consumption of pesti-cides), indicating an association between the in-creased consumption of pesticides and the mean coefficients of health indicators. It is possible to identify the concentration of pesticide consump-tion in the municipalities of the Midwest (3.3 to 14.6 million liters) and South (744 thousand to 3.3 million liters) of the state of Mato Grosso, where agricultural production is more intense.
aúd
e C
ole
tiv
a,
22(10):3281-3293,
2017
actions, overcoming the reduced linear causality model and incorporating integrated approaches to health surveillance.
Conclusions
The effectiveness of health surveillance actions in Brazil depends on interinstitutional and partic-ipatory processes and practices that incorporate information on social, environmental and health impacts related to the agricultural production process and to occupational, food, environmen-tal and population exposure to pesticides.
The methodological strategy shown in this paper contributes to the collectivization of cru-cial information for the knowledge and action of the sectors, institutions and stakeholders central to health surveillance actions, especially consid-ering the relationship between the production processes and people’s health-disease process.
This methodology can be used in Brazilian municipalities or health regions and/or regions,
based on data from agricultural production, av-erage amount of pesticides used per hectare of crops and some diseases related to their acute, sub-chronic or chronic impacts on human health. The spatial distribution of information allows us to identify patterns of consumption and priority areas with greater exposure to pesticides and gen-erate exploratory analysis and statistical, spatial and visual correlations.
The information produced is important for the processes of health education among exposed populations, workers and entities that are part of social control, aiming at strengthening surveil-lance actions, as well as integrated actions of ag-riculture, environment, labor and health inspec-tion agencies.
Pig
nat
References
1. Carneiro FF, Rigotto RM, Augusto LGS, Friedrich K, Búrigo AC, organizadores. Dossiê ABRASCO: um alerta sobre os impactos dos agrotóxicos na saúde. Rio de Janei-ro: EPSJV, São Paulo: Expressão Popular, 2015. 2. Pignati WA, Machado JMH. O agronegócio e seus
impactos na saúde dos trabalhadores e da população do Estado de Mato Grosso. In: Gomez CM, Machado JHM, Pena PG, organizadores. Saúde do trabalhador na sociedade brasileira contemporânea. Rio de Janeiro: Fiocruz; 2011. p. 245-272.
3. Oliveira LC. Intoxicados e silenciados: contra o que se luta? Tempus, actas saúde colet 2014; 8(2):109-132. 4. Neto EN, Lacaz FAC, Pignati WA. Vigilância em saúde
e agronegócio: os impactos dos agrotóxicos na saúde e no ambiente. Perigo à vista! Cien Saude Colet 2014; 19(12):4709-4718.
5. Onishi CA. Vigilância em saúde dos trabalhadores e po-pulações expostas a agrotóxicos no município de Campo Verde – MT [dissertação]. Cuiabá: Universidade Fede-ral de Mato Grosso; 2014.
6. Brasil. Lei nº 12.527, de 18 de novembro de 2011. Re-gula o acesso a informações. Diário Oficial da União 2011; 18 nov.
7. Instituto Brasileiro de Geografia e Estatística (IBGE). Sistema IBGE de Recuperação Automática. Produção Agrícola Municipal. [online]. Brasília, Distrito federal; 2015. [acessado 2017 jan 03]. Disponível em: http:// www2.sidra.ibge.gov.br/bda/acervo/acervo9.asp?e=-c&p=PA&z=t&o=11
8. Pignati W, Oliveira NP, Silva AMC. Vigilância aos agro-tóxicos: quantificação do uso e previsão de impactos na saúde-trabalho-ambiente para os municípios brasilei-ros. Cien Saude Colet 2014; 19(12):4669-4678. 9. Instituto de Defesa Agropecuária do Mato Grosso
(IN-DEA-MT). Planilha de Dados do Sistema de Informação de Agrotóxicos dos anos de 2005 a 2012 [banco de dados eletrônico]. Cuiabá: INDEA-MT; 2013.
10. Falk JW, Carvalho LA, Silva LR, Pinheiro S. Suicídio e doença mental em Venâncio Aires – RS: Conseqüên-cia do uso de agrotóxicos organofosforados? Salão de Iniciação Científica; 1996 Set 09-13; Porto Alegre, RS. Livro de resumos: UFRGS/PROPESQ; 1996
11. Instituto Brasileiro de Geografia e Estatística (IBGE). Indicadores de Desenvolvimento Sustentável: Brasil 2010. Rio de Janeiro: IBGE; 2010.
12. Brasil. Departamento de Informática do SUS. Aces-so a informação – demográficas e Aces-socioeconômicas. Estimativa populacional. [online]. Brasília, Distrito Federal; 2017. [acessado 2017 jan 03]. Disponível em: http://www2.datasus.gov.br/DATASUS/index.php?a-rea=0206&id=6943&VObj=http://tabnet.datasus.gov. br/cgi/deftohtm.exe?ibge/cnv/popt
13. Oliveira NP, Moi GP, Atanaka-Santos M, Silva AMC, Pignati WA. Malformações congênitas em municípios de grande utilização de agrotóxicos em Mato Grosso, Brasil. Cien Saude Colet 2014; 19(10):4123-4130.
Collaborations
aúd
e C
ole
tiv
a,
22(10):3281-3293,
2017
14. Ueker ME, Silva VM, Moi GP, Pignati WA, Mattos IE, Silva AMC. Parenteral exposure to pesticides and oc-curence of congenital malformations: hospital-based case–control study. BMC Pediatr 2016; 16(125):1-7. 15. Belpomme D, Irigaray P, Hardell L, Clapp R,
Montag-nier L, Epstein S, Sasco Aj. The multitude and diver-sity of environmental carcinogens. Environ Res 2007; 105(3):414-429.
16. Merchán-Hamann E, Tauil PL, Costa MP. Terminolo-gia das medidas e indicadores em EpidemioloTerminolo-gia: sub-sídios para uma possível padronização da nomenclatu-ra. Inf Epidemiol Sus 2000; 9(61):273-284.
17. SPSS Inc. Released 2009. PASW Statistics for Windows [Programa de computador], Version 18.0. Chicago: SPSS Inc; 2009.
18. Varella MD, Platiau AF, organizadores. O princípio da precaução. Belo Horizonte: Del Rey; 2004.
19. Breilh J. De la vigilancia convencional al monitoreo participativo. Cien Saude Colet 2003; 8(4):937-951. 20. Instituto Brasileiro de Geografia e Estatística (IBGE).
Sistema IBGE de Recuperação Automática. Produção Agrícola Municipal. [online]. Brasília, Distrito federal; 2017. [acessado 2017 fev 14]. Disponível em: https:// sidra.ibge.gov.br/home/ipp/brasil.
21. The Pesticide Properties Database. A to Z List of Pes-ticide Active Ingredients. [online] Reino Unido: Uni-versity of Hertfordshire; 2017 [acessado 2017 abr 02]. Disponível em: http://sitem.herts.ac.uk/aeru/ppdb/en/ atoz.htm
22. Bombardi LM. Agrotóxicos e agronegócio: arcaico e moderno se fundem no campo brasileiro. In: Merlino T, Mendonça ML, organizadores. Direitos humanos no Brasil 2012: relatório da Rede Social de Justiça e Direitos Humanos. São Paulo: Rede Social de Justiça e Direitos Humanos; 2012. p. 75-86.
23. Altieri M. Agroecologia: Bases Científicas para uma Agricultura Sustentável. 3ª ed. São Paulo, Rio de Janeiro: Expressão Popular; 2012.
24. Brasil. Lei nº 12.873, de 24 de outubro de 2013. Auto-riza o Poder Executivo a declarar estado de emergência fitossanitária ou zoossanitária. Diário Oficial da União 2013; 25 out.
25. Belo MSS, Pignati W, Dores EGC, Moreira JC, Peres F. Uso de agrotóxicos na produção de soja do esta-do de Mato Grosso: um estuesta-do preliminar de riscos ocupacionais e ambientais. Rev bras saude ocup 2012; 37(125):78-88.
26. Moreira JC, Peres P, Simões AC, Pignati WA, Dores EF, Vieira S, Strussmann C, Mott T. Contaminação de águas superficiais e de chuva por agrotóxicos em uma região de Mato Grosso. Cien Saude Colet 2012; 17(6):1557-1568.
27. Palma DCA, Lourencetti C, Uecker ME, Mello PRB, Pignati WA, Dores EFGC. Simultaneous determina-tion of different classes of pesticides in breast milk by solid-phase dispersion and GC/ECD. J Braz Chem Soc 2014; 25(8):1419-1430.
28. Medronho R, Bloch KV, Luiz RR, Werneck GL, orga-nizadores. Epidemiologia. 2ª ed. São Paulo: Atheneu; 2009.
29. Faria ET, Faria NMX, Rosa JAR, Faccini LA. Intoxica-ções por agrotóxicos entre trabalhadores rurais de fru-ticultura, Bento Goncalves, RS. Rev Saude Publica 2009; 43(2):335-344.
30. Organização Pan-americana da Saúde (OPAS), Orga-nização Mundial de Saúde (OMS). Manual de vigilân-cia da saúde de populações expostas a agrotóxicos. Brasí-lia: OPAS, OMS; 1996.
31. Regidor E, Ronda E, García AM, Domínguez V. Pater-nal exposure to agricultural pesticides and cause speci-fic fetal death. Occup Environ Med 2004; 61(4):334-339. 32. Guyton KZ, Loomis D, Grosse Y, El Ghissassi F,
Benbrahim-Tallaa L, Guha N, Scoccianti C, Mattock H, Straif K. Carcinogenicity of tetrachlorvinphos, pa-rathion, malathion, diazinon, and glyphosate. Lancet Oncol 2015; 16(5):490-491.
33. Bassil KL, Vakil C, Sanborn M, Cole DC, Kaur JS, Kerr KJ. Cancer health effects of pesticides: systematic re-view. Can Fam Physician 2007; 53(10):1704-1711. 34. Curvo HRM, Pignati WA, Pignatti MG. Morbi
morta-lidade por câncer infantojuvenil associada ao uso agrí-cola de agrotóxicos no Estado de MT- Brasil. Cad Saúde Coletiva 2013; 21(1):10-17.
35. Cunha MLON. Mortalidade por câncer e a utilização de pesticidas no estado de Mato Grosso [dissertação]. São Paulo: Faculdade de Medicina da Santa Casa de São Paulo; 2010.
36. JC. Perfil epidemiológico, o uso dos agrotóxicos e os ca-sos de câncer atendidos no Hospital de Câncer de Mato Grosso [monografia]. Cuiabá: Universidade Federal de Mato Grosso; 2016.
Article submitted 30/05/2017 Approved 26/06/2017