OBJECTS GROUPING FOR SEGMENTATION OF ROADS NETWORK IN HIGH
RESOLUTION IMAGES OF URBAN AREAS
M. Maboudi a,b*, J. Amini a, M. Hahn b
a School of Surveying and Geospatial Engineering, College of Engineering - University of Tehran- (mmaboudi, jamini)@ut.ac.ir b Department of Geomatics Engineering, University of Applied Sciences, Stuttgart, Germany- [email protected]
ThS 15
KEY WORDS: Road extraction, Segmentation, Objects grouping, Object based image analysis, Maximal similarity region merging.
ABSTRACT:
Updated road databases are required for many purposes such as urban planning, disaster management, car navigation, route planning, traffic management and emergency handling. In the last decade, the improvement in spatial resolution of VHR civilian satellite sensors – as the main source of large scale mapping applications – was so considerable that GSD has become finer than size of common urban objects of interest such as building, trees and road parts. This technological advancement pushed the development of “Object-based Image Analysis (OBIA)” as an alternative to pixel-based image analysis methods.
Segmentation as one of the main stages of OBIA provides the image objects on which most of the following processes will be applied. Therefore, the success of an OBIA approach is strongly affected by the segmentation quality. In this paper, we propose a purpose-dependent refinement strategy in order to group road segments in urban areas using maximal similarity based region merging. For investigations with the proposed method, we use high resolution images of some urban sites. The promising results suggest that the proposed approach is applicable in grouping of road segments in urban areas.
1. INTRODUCTION
Updated road databases are required for many purposes such as urban planning, disaster management, car navigation systems, route planning, traffic management, emergency handling, etc. (Grote, et al., 2012). Intensive research has been conducted on automatic road extraction from VHR optical images (Mayer, et al., 2006), SAR images (Hedman, et al., 2004; Saati, et al., 2015), LiDAR data (Samadzadegan, et al., 2009) and on the integration of different data sources (Rahimi, et al., 2015). Nevertheless it is still one of the important and challenging subjects in urban remote sensing.
The advent of VHR satellites led to a paradigm shift in optical remote sensing (Blaschke, et al., 2014; Dey, et al., 2010). The spatial resolution (GSD) of VHR satellite sensors has become finer than the size of common urban objects of interest such as buildings, trees and road parts. These objects are imaged in several pixels. A consequence of this is the increase of the within-class spectral variability and the decrease of the potential accuracy of per-pixel approaches (Blaschke, et al., 2014). Object-based image analysis (OBIA) or Geographic Object-Based Image Analysis (GEOBIA) was shown to be superior to pixel-based analysis in many applications especially when applied to high-resolution images (). For example, in object based classification processes spectral, textural, structural information as well as context can be used.
Regions as the smallest meaningful entities (objects) can be generated by an image segmentation process (Wang, et al., 2010). This step is crucial since it provides the basic units (image objects) on which later process will be applied. Therefore, the success of an OBIA approach is related to the quality of segmentation result (Sebari, et al., 2013; Wang, et al., 2014; Maboudi, et al., 2015; Nikfar, et al., 2015).
* Corresponding author
In recent years an increasing body of research has delved into the problem of segmentation and region merging (Dey, et al., 2010; Wang, et al., 2014; Grote, et al., 2012; Baatz, et al., 2000). (Arbelaez, et al., 2014) presented combinatorial grouping to achieve multi-scale regions. (Calderero, et al., 2010) proposed a statistical based family of unsupervised region merging methods providing a set of the most relevant multi-level region-based explanations of an image. The methodology described by (Peng, et al., 2011) considers segmentation as a region-merging process which is formulated as an inference problem. The proposed predicate is based on measuring the dissimilarity between pixels along the boundary of two regions which can be interpreted as a combination of a consistency measure and a similarity measure. In (Grote, et al., 2012), initial normalized cuts segmentation is followed by a grouping algorithm based on radiometric and geometric criteria of the segments in order to compensate for oversegmentation of semi-urban areas in aerial images. The combination of the grouping criteria is based on a fuzzy system. This algorithm which is designed for road extraction, produces impressive results. Nevertheless, abundance of thresholds and parameters which are set empirically, still leaves room for improvement. (Ning, et al., 2010) proposed a threshold free interactive region merging method based on histograms of image regions. In their method, the interactive information is introduced as markers, which are input by the users to indicate some parts of the object and background. This method calculates the similarity of different regions and merges them based on a maximal similarity rule. The object is extracted from the background when the merging process ends.
region merging is presented in section 2.1. Afterwards, experimental results and conclusions are drawn in sections 3 and 4, respectively.
2. METHODOLOGY
In this paper, an object based method for purpose dependent grouping of the segments is proposed to group road segments in high resolution images. As it is shown in Figure 1, a multi resolution segmentation is employed to initially generate image regions. Next a rule-based classification partitions these regions into three classes, in our application into road and non-road objects (both will serve as initial markers) and unclassified objects. In addition a super-pixel segmentation is adopted to over-segment the image. The markers are then refined to match with the super-pixels and form the final marker image. Finally, the high resolution image and marker image as well as super-pixels are employed as input of Maximal Similarity based Region Merging (MSRM) to group the objects i.e. road and background objects. Details of all stages are described in following sections.
Figure 1. Flowchart of the proposed approach.
2.1 Marker Generation
As an important part of interactive maximal-similarity based region merging, the user needs to specify information about the road and background by drawing markers, which could be lines, curves and strokes on the image. Utilizing these markers, the image regions can be divided into three categories: 1) road marker regions, 2) background marker regions and 3) non-marked regions. This approach relies on a considerable user interaction to separate road objects from background. This makes automatic image segmentation and grouping techniques more appealing (Peng, et al., 2011). As an alternative to the interactive marker drawing we aim at defining the marker regions by classification and refinement. This is explained in the following.
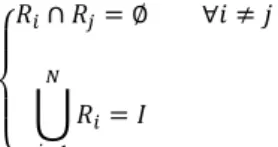
2.1.1 Multi Resolution Segmentation: Formally, image segmentation is defined as a procedure of dividing an image into non-overlapping regions of pixels which have similar properties according to a criteria (Pal, et al., 1993). To be more exact, a complete segmentation of an image (I) can be considered as a set of regions = { , = , , … , } that fulfil the following conditions (Sonka, et al., 2008):
{
∩ = ∅ ∀ ≠
⋃ =
�
=
(1)
Multi-resolution segmentation according to (Baatz, et al., 2000) is a bottom up region-merging technique starting with one-pixel objects. In each merging step, the algorithm tries to minimize the fusion factor of resulting objects, which is defined as:
� = W� . �ℎ� + Wℎ� �. �ℎℎ� � . (2) where W� and Wℎ� � are the weight of color heterogeneity and the weight of shape heterogeneity and �ℎ� and �ℎℎ� � are the difference in spectral heterogeneity and the difference in shape heterogeneity. W� controls the significance of color heterogeneity and Wℎ� � determines the impact of shape heterogeneity in merging two objects. This weights must fulfil the following constraint:
W� + Wℎ� �= . (3)
There are some attempts to optimize the multi resolution segmentation parameters (Saba, et al., 2016). However, in our application, the extraction of objects need not to be restricted by shape constraints (referring to smoothness and compactness) and we just need to consider the spectral heterogeneity. Therefore, we set Wℎ� � to 0. So, the fusion factor between two objects can be defined as (Baatz, et al., 2000):
� = �ℎ� = . ℎ − . ℎ + . ℎ . (4)
where and are the indices of the two neighboring objects, is the index of the merged object and is the number of pixels in each of the objects. ℎ is the spectral heterogeneity defined by the standard deviation of pixel values in each object.
Figure 2(a) shows an image which was taken from Google Earth to illustrate the processing. The segmentation result using a multi resolution method that is based on the fusion factor (4) is shown in Figure 2(b).
a b
Figure 2. a) High resolution image; b) multi resolution segmentation results
The irregular shape of the objects indicates that no shape constraint is included in the fusion factor employed for segmentation.
2.1.2 Classification: After segmentation, we use the linearity
feature index LFI (Miao, et al., 2013) to discriminate potential road segments from other segments. LFI is defined as:
=����2 , (5)
where � is the diagonal of minimum bounding rectangle of the object and is the area of the object.
VHR Image
Maximal Similarity
Region Merging Road segments
Super-pixel segmentation
Markers Generation
Multi resolution segmentation
Classification
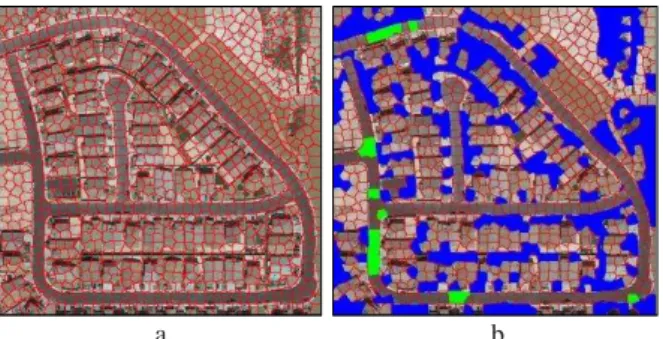
Classification by applying a threshold on the LFI values of objects results in road segments as well as elongated non-road objects. Next, we eliminate very narrow and long objects using external knowledge about the width of the roads. Further, objects are removed from the classification result utilizing some spectral and textural features. These features include hue, saturation, and standard deviation of pixel values in each band and second angular momentum of pixels of each object. The result of classification is depicted in Figure 3.
Figure 3. Object based classification result
Highlighted in green are the road markers. The blue regions represent the background markers. All other regions are unmarked because they are unclassified.
2.2 Super-Pixel Segmentation and Markers Refinement:
Super-pixel segmentation groups pixels into perceptually meaningful atomic regions which can be used to replace the rigid structure of the pixel grid. They capture image redundancy, provide a convenient primitive to compute image features, and greatly reduce the complexity of subsequent image processing tasks (Achanta, et al., 2012). There are many approaches to generate super-pixels, each with its own advantages and limitations. In this research the super-pixel segmentation method proposed in (Mori, 2005) is employed to partition the image into homogenous regions. We adopt this method due to its high robustness and less computational costs. Moreover, it demonstrates a very good boundary recall performance (Achanta, et al., 2012). A high boundary recall indicates that very few true edges were missed. Super-pixels achieved by this method are depicted in Figure 4(a).
a b
Figure 4. Markers refinement. a) Super-pixel segmentation result; b) Refined markers
It can be seen from Figure 2(b) and Figure 4(a) that objects achieved from multi-resolution segmentation and super-pixel segmentation do not coincide. There are many possibilities for transferring the classification result related to the multi-resolution segmentation into super-pixels. Here, we use the following rules:
1. If a super-pixel does not coincide with any labelled object, consider it as unclassified.
2. If a super-pixel coincides with more than one object, consider it as unclassified.
3. If the overlapping area between a super-pixel and a labelled object is more than 30% of the areas of the super-pixel, label the super-pixel same as that object.
The 30% value is found empirically. The final classification result utilizing these three rules is depicted in Figure 4(b). A high completeness of the classification result is not critical. But important is the correctness of labeled markers as the next processing step relies on this result.
2.3 Maximal-similarity based region merging
The last step aims at a perceptually coherent grouping of the raw regions produced by super-pixel segmentation (Figure 4(a)). Object grouping can be considered as grouping of relevant regions such that:
= { , = , , … , }, < (6)
where is number of region after grouping and is the number of all segments before grouping defined in (1).
(Luo, et al., 2003) categorized the region grouping algorithms into following groups:
1. Non-purposive grouping (NPG) 2. Purposive grouping (PG)
NPG is based on general expectations of a good segmentation. First, NPG involves merging small regions into large regions, and merging neighbouring regions with similar properties. In addition, NPG also tries to group regions belonging to the same object based on smooth, non-coincidental connection of joints between parts of the same object, without resorting to knowledge of specific objects. In contrast, PG or application dependent grouping relies or properties or models of specific objects. Because the focus in road extraction is on a specific object, i.e. road, a purpose dependent strategy is employed in this paper. Our goal is to select an assembly of regions that is maximally road-like. MSRM introduced by (Ning, et al., 2010) is a region merging approach which relies on user defined markers. It performs well in separating an object from background. Roads in remote sensing images mostly tend to show up as connected road segments. Motivated by this fact, we adopted MSRM to group road segments and separate them from background, i.e. non-road segments.
One of the key issues in region merging algorithms is the merging criterion that defines the cost of merging two regions or the similarity between two regions. In MSRM the similarity between two arbitrary objects and is defined as:
, = ∑ √ ∙
�
(7)
where � = � and � is number of bins of each colour channel histogram, and are the normalized histograms of and , respectively, and is a superscript which represents the th element of histograms. This similarity measure can be considered geometrically as (Ning, et al., 2010):
After defining the similarity measure, a strategy for finding the image objects for a merge is required. Starting with an arbitrary object , different heuristics can be applied to find an adjacent object for the merge. (Baatz, et al., 2000) presented four strategies by an increasing constraint in terms of freedom of choice: 1)Fitting; 2) Best Fitting; 3) Local mutual best fitting and 4) Global mutual best fitting. MSRM belongs to the second category. The merging strategy used in MSRM states that two arbitrary regions and can merge together if and only if the condition (9) is fulfilled.
, = max ( , ) (9)
where is the set of ’s adjacent regions. The interested readers can find further detail of this algorithm in (Ning, et al., 2010).
MSRM with more markers performs better than with few markers (Ning, et al., 2010). Moreover, objects and background can be correctly extracted as long as the markers cover its main regions. However in aerial or satellite images, a road network may split into many parts due to occlusion, shadows, etc. Furthermore, spectral variations on a road surface may lead to disjointed road parts. In consequence, interactive methods of introducing markers would be very elaborative and time consuming. Therefore, we use the classification result for which the correctness is high (Figure 4(b)) as the markers for MSRM. Figure 5(a) shows the result of MSRM using the classification based markers.
a b
c)
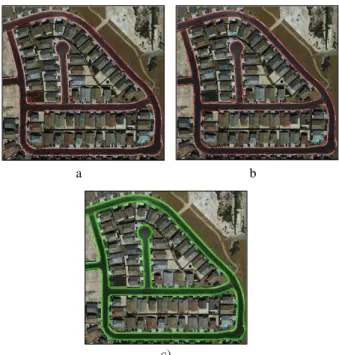
Figure 5. Study a) MSRM result obtained by classification based markers; b) MSRM result produced by interactive
markers; c) Ground truth
For comparison, an interactive grouping result using some user marked road and non-road objects is depicted in Figure 5(b). Finally the ground truth of this dataset in shown in Figure 5(c). As can be seen in Figure 5(a), the approach was mostly successful to join the road segments correctly. Although there are some small areas that are wrongly attached to road parts.
3. EXPERIMENTAL RESULTS
Experimental results are presented to validate the efficiency of proposed method for grouping road segments in a high resolution image. Figure 7 depicts a high resolution image of an urban site.
Figure 6. An urban study area
The test image has three RGB bands with the approximate spatial resolution of 1m/pixel. In our study, no proper geographical database for road network was available. Therefore the reference road network is digitized manually in ArcGIS 10.3 and is shown in Figure 7.
Figure 7. Ground truth of study area
Figure 8. result of proposed grouping approach
It can be seen from Figure 8 that most parts of the roads are properly extracted.
In order to assess the performance of proposed approach quantitavely, three metrics are employed:
1. Completeness: the ratio of the true positives over the sum of the true positives and false negatives.
2. Correctness: the ratio of the true positives over the sum of the true and false positives.
3. Quality: the ratio of the true positives over the sum of the true and false positives and false negatives.
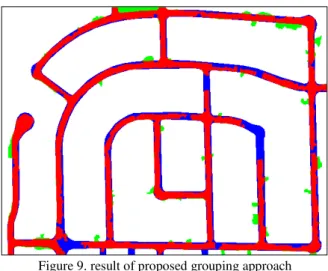
In Figure 9 true positive are shown in red, false positive in green and false negative in blue.
Figure 9. result of proposed grouping approach
The quantitative evaluation results are shown in Table 1.
Metric Correctness Completeness Quality
Value 91% 75% 70%
Table 1. Quantitative evaluation results in terms of the three evaluation metrics: completeness, correctness, and quality
As it can be seen from Table 1, the correctness of approach extracted is high. However some road segments are missing. Missing parts are mostly due to the lack of the object markers near those segments or because of a misclassification of initial objects.
4. CONCLUSION
In this paper, we have presented a strategy for automating the grouping of road segments in VHR images based on a purpose dependent grouping approach. The method is an extended version of the MSRM algorithm proposed by (Ning, et al., 2010) which is customized for road network segmentation. Image segmentation is performed in two steps. In the first step, a rough and robust rule-based classification method is utilized to produce markers rather than interactively drawing the markers. This is the main extension to the original MSRM. In the next step, markers are used for grouping image objects which are not previously classified. The methodology was successfully evaluated by inspection of results. It approves the applicability of the proposed methodology for the segmentation of road networks in urban areas. However, MSRM just relies on histograms of pixel values and it leads to some wrong groupings of objects which are spectrally similar to the road. Furthermore, it is very sensitive to any false marking. Thus there is still room for an improvement in the grouping step. Future works can concentrate on employing more advanced object similarity criteria and improving the classification quality. Moreover the result of this approach can be used as a very good initial value for snake-based approaches.
ACKNOWLEDGEMENTS
This paper is supported by the Department of Geomatics Engineering, Stuttgart University of Applied Sciences.
REFERENCES
Achanta, R., A. Shaji, K. Smith, A. Lucchi, P. Fua, and S. Süsstrunk. 2012. SLIC Superpixels Compared to State-of-the-Art Superpixel Methods. IEEE TPAMI, 34 (11), pp. 2274-2282.
Arbelaez, P., J. Pont-Tuset, J. Barron, F. Marques, and J. Malik. 2014. Multiscale Combinatorial Grouping. In: CVPR2014. Columbus, Ohio, pp. 328-335.
Baatz, Martin, and Arno Schäpe. 2000. Multiresolution Segmentation: an optimization approach for high quality multi-scale image segmentation. In: Angewandte Geographische Informations verarbeitung XII, Salzburg, Vol.58: , pp. 12-23.
Blaschke, Thomas, Geoffrey J. Hay, Maggi Kelly, Stefan Lang, Peter Hofmann, Elisabeth Addink, Raul Queiroz Feitosa, et al. 2014. Geographic Object-Based Image Analysis – Towards a new paradigm. ISPRS Journal of Photogrammetry and Remote Sensing, 87, pp. 180–191.
Calderero, F., and F. Marques. 2010. Region Merging Techniques Using Information Theory Statistical Measures. IEEE Transactions on Image Processing, 19 (6), pp. 1567-1586.
Dey, V., Y. Zahng, and M. Zhong. 2010. A review on image segmentation techniques with remote sensing perspective. In: IAPRS, Vienna, Austria, ,Vol. XXXVIII, Part 7A, pp. 31-42.
Grote, Anne, Christian Heipke, and Franz Rottensteiner. 2012. Road network extraction in suburban areas. The Photogrammetric Record, 27 (137), pp. 8-28
Luo, Jiebo, and Cheng-en Guo. 2003. Perceptual grouping of segmented regions in color images. Pattern Recognition, 36, pp. 2781 – 2792.
Maboudi, Mehdi, and Jalal Amini. 2015. Object based Segmentation Effect on Road Network Extraction from Satellite Images. In: Proceedings of ACRS 2015, Manila, Philippines.
Mayer, Helmut, Stefan Hinz, Uwe Bacher, and Emmanuel Baltsavias. 2006. A Test of Automatic Road Extraction Approaches. In: IAPRS, Bonn, Germany, 'PCV 06', pp. 209-214.
Miao Z., Shi W., Zhang H. and Wang X.. 2013. Road Centerline Extraction From High-Resolution Imagery Based on Shape Features and Multivariate Adaptive Regression Splines. IEEE Geoscience and Remote Sensing Letters 10 (3), pp. 583-587.
Mori, G. 2005. Guiding model search using segmentation. In: ICCV 2005. Beijing, China, pp. 1417-1423.
Nikfar, M., Valadan Zoej M. J, Mokhtarzade M, and Aliyari M.. 2015. Designing a New Framework Using Type-2 FLS and Cooperative-Competitive Genetic Algorithms for Road Detection from IKONOS Satellite Imagery. Remote Sensing, 7, pp. 8271-8299.
Ning, Jifeng, Lei Zhang, David Zhang, and Chengke Wu. 2010. Interactive image segmentation by maximal similarity based region merging. Pattern Recognition, 43 (2), pp. 445 - 456.
Pal, Nikhil R, and Sankar K Pal. 1993. A review on image segmentation techniques. Pattern Recognition, 26 (9), pp. 1277-1294.
Peng, B., L. Zhang, and D. Zhang. 2011. Automatic Image Segmentation by Dynamic Region Merging. IEEE Transactions on Image Processing, 20 (12), pp. 3592-3605.
Rahimi, S., Arefi H, and Bahmanyar R., 2015. Automatic Road Extraction Based on Integration of High Resolution LiDAR and Aerial Imagery. In: ISPRS - IAPRS. Kish, Iran, Vol. XL-1/W5, pp. 583-587.
Saati, M, Amini J., and Maboudi M.. 2015. A Method for Automatic Road Extraction of High Resolution SAR Imagery. Journal of the Indian Society of Remote Sensing, 43 (4), pp. 697-707.
Saba, F., Zoej, M. J., & Mokhtarzade, M., 2016. Optimization of multiresolution segmentation for object-oriented road detection from high-resolution images. Canadian Journal of Remote Sensing.
Samadzadegan, F., M. Hahn, and B. Bigdeli. 2009. Automatic road extraction from LIDAR data based on classifier fusion. In: IEEE Joint Urban Remote Sensing Event, Shanghai, China.
Sebari, Imane, and Dong-Chen He. 2013. Automatic fuzzy object-based analysis of VHSR images for urban objects extraction. ISPRS Journal of Photogrammetry and Remote Sensing, 79, pp. 171-184..
Sonka, Milan, Vaclav Hlavac, and Roger Boyle. 2008. Image Processing, Analysis, and Machine Vision.. Thomson, pp. 176
Wang, M., and Li R.. 2014. Segmentation of High Spatial Resolution Remote Sensing Imagery Based on Hard-Boundary Constraint and Two-Stage Merging. IEEE Transactions on Geoscience and Remote Sensing, 52 (9), pp. 5712-5725.