Iterative Single-Image Digital Super-Resolution
Using Partial High-Resolution Data
Eran Gur, Member, IAENG and Zeev Zalevsky
Abstract—The subject of extracting high-resolution data from low-resolution images is one of the most important digital processing applications in recent years, attracting much research. In this work the authors show how to improve the resolution of an image when a small part of the image is given in high-resolution. To obtain this result the authors use an iterative procedure imposing the low frequencies complete data of the original low-resolution image and the high-resolution data present only in a fraction of the image. The result is a clearer image, with higher correlation to the required high-resolution image. The authors show the use of such a procedure on Rosetta images to demonstrate the higher frequencies obtained and on a text sample to show improvement in textual understanding.
Index Terms—Image Processing, Signal reconstruction, Super-
resolution.
I. INTRODUCTION
In recent years many researchers tried to address the subject of super resolution (SR). SR refers to recovering high resolution data from images that due to mis-focus, compression or other forms of distortion have lost the high frequencies data that were originally embedded in the image, and hence are now given as low resolution images. The methods to overcome this problem of data loss, and generate SR, are quite versatile. In some cases the method is to obtain data about the blurring function and use an inverse filter to reconstruct the high-resolution image [1,2]. Unfortunately, two main problems limit this approach. The first, usually it is impossible to identify the exact blurring function since it is a result of stochastic noise and thus only its statistical properties are known.
The second, even if the blurring function is known making an inverse filter might not be practical (e.g. if the original blurring filter has zeros the inverse filter must have singular values to obtain exact restoration). Other methods use large databases; they are divided into two groups. In the first group [3,4] one takes a large amount of different test-images present both in low resolution and high resolution and attempt to find
the blurring procedure that will yield the best results with respect to all images. There are two problems with this approach, no two pictures are identical and therefore we cannot be sure that the inverse blurring procedure found will be applicable for the required new image, and, usually the blurring procedure varies from one test-image to another and thus the “anti-blurring” filter will be an average of many filters, and not an exact filter.
Manuscript submitted February 20, 2007
Eran Gur is with Shenkar College of Engineering & Design, Ramat Gan, 52526, Israel (corresponding author, phone: +972-3-6005367; fax: +972-3-6005370; e-mail: [email protected]).
Zeev Zalevsky is with Bar Ilan University, Ramat Gan, 52900, Israel (e-mail: [email protected]).
The second group of SR using large databases assumes one has many low-resolution pictures of the required subject [5,6]. Since in every picture a different portion of the high-resolution data is missing it is possible to extract some high-resolution data from these images to obtain a single high-resolution image. The main drawback of these methods is the large database required in order to increase the resolution of a single image.
In our work we suggest a novel approach assuming only one image is given – the required image. Suppose one has to scan an image with high resolution, it is time and memory consuming. However, if only a small portion will be scanned with high accuracy and most of the data scanned with lower accuracy the process it much faster and the storage capacity required to store the images is much smaller (e.g. with CT scanning if the patient has to spend less time on the scanning device his/her inconvenience is reduced). This is the exact principle used in this work. We assume only a small portion of the required image is given in high-resolution and use this data (assuming it has similar statistical properties to the neighboring low-resolution portion of the image) to increase the resolution of the entire image. To do this we use an iterative procedure relying on two initial assumptions: in one small portion of the image we have all the high-resolution data, and the entire image contains all the low frequencies of the original high-resolution image. In the following sections we explain the procedure and show some test cases supporting this approach.
II. ITERATIVE SINGLE IMAGE SUPER-RESOLUTION
A. Concept
frequency-domain restriction on the image. We also know that a certain portion of the image is presented in high-resolution so we can impose an object-domain restriction on the image. These two restrictions allow us to bounce back and forth from the object-domain to the frequency-domain, with a procedure similar to the one used for phase retrieval, as shown in the following subsection.
B. Review: Iterative Phase Retrieval
A well-known problem is to determine the phase of a phase only object plane filter that will produce a required intensity distribution in the Fourier domain. In there paper [7] Gerchberg and Saxton suggested an iterative manner to do just that. This method is proven to converge to a phase filter with a minimal MSE [8].
The concept is quite simple: We begin with an arbitrary phase-only filter in the object domain multiplying the input object (the original image), after a Fourier transform we obtain a Fourier domain image and we impose the require Fourier intensity (actually the magnitude), leaving the phase unharmed. An inverse Fourier transform brings us back to the object domain. Since we demand a phase-only filter we impose the intensity of the input object in this plane. Next we calculate the Fourier transform and return to the Fourier domain, and so on. This procedure is required since using only the phase of the complex filter that converts the input image exactly to the Fourier image gives poor results. As can be seen, if we impose half of the information (intensity or phase) in both the input and the output domains the procedure converges monotonically. In later work Gerchberg [9] and Papoulis [10] suggested the use of this method for super-resolution. However, both presented relatively simple test cases and assumed the properties of all iterations to be identical (accept when noise reduction was addressed).
There are of course other methods for obtaining the phase filter, such as Simulated Annealing [11], which ensures that the MSE has indeed a global minimum, but it is time and resources consuming.
C. Super-Resolution by factor of 2
Now we present the approach used to obtain a factor-2 Super-resolution (i.e. the original image had 2N by 2N pixels but we obtain only an N by N pixels image).
Let us indicate the required image by where , and the low-resolution image as
(
mng ,
)
N 2 n m
1≤ , ≤ gLR
( )
m,nwhere . Since the size of the images is not the same we begin by planting zeros between each row and column element of , thus generating:
N n m 1≤ , ≤
(
mn gLR ,)
(
)
(
)
⎪⎩ ⎪ ⎨ ⎧ ⎟ ⎠ ⎞ ⎜ ⎝ ⎛ + + = otherwise 0 n m odd 2 1 n 2 1 m g n m g LR 1 & ,, (1)
The new image has the same number of pixels as the required high-resolution image.
We assume that a certain portion of the image is known completely, so we may impose it on the new image:
(
) (
)
1 2 1 21m n gmn m m m n n n
g , = , ≤ ≤ , ≤ ≤ (2)
In the Fourier plane we obtain for the high-resolution image:
( )
(
)
∑∑
= = ⎥⎦ ⎤ ⎢ ⎣ ⎡ ⎟ ⎠ ⎞ ⎜ ⎝ ⎛ × + × π × × = M 2 1 m N 2 1n 2N
l n M 2 k m 2 j n m g N 2 M 2 1 l k G exp , , (3)
whereas for the low-resolution image, the DFT is
( )
(
)
∑∑
= = ⎥⎦ ⎤ ⎢ ⎣ ⎡ ⎟ ⎠ ⎞ ⎜ ⎝ ⎛ × + × π × × = M 1 m N 1 n LR N l n M k m 2 j n m g N M 1 l k G exp , , (4)Since the low-resolution image contains all the low frequencies of the high-resolution image we may deduce that we can use the following restriction:
( )
k l 4 G( )
k l k Ml NG1 , = × LR , ≤ , ≤ (5) Where is the DFT of , and the factor of 4 is required since the size of and is not the same.
If m2−m1+1=M and then we have only
25% of the data in the object plane and 25% of the data in the Fourier plane. This is less than the required amount stated by the phase retrieval algorithm shown before and therefore the convergence to a minimal MSE is not assured.
N 1 n n2− 1+ =
In fact, when using the iterative procedure for this case we obtain the following: at first, the MSE decreases monotonically, but after several iterations the requirements are not strong enough to keep the results in the right track, and the MSE starts to rise. For this reason we add a new condition to the iterative procedure: halt when MSE reaches local minima.
In addition we noticed that a smaller (better) MSE minimum could be obtained by gradually increasing the frequency domain requirements, i.e., imposing only very low frequencies at the beginning and gradually increasing the frequencies imposed, up to the maximum value given in (5). This is due to the fact that primarily g1
( )
m,n is quite different from g(
m,n)
(yielding a large MSE) and thus imposing a large portion of the Fourier domain at an early stage sets the results way out of track.
The following summarizes the procedure steps:
2. Implant zeros between data points to increase image
size to .
3. Impose high-resolution portion on image. 4. Perform DFT.
5. Impose low frequencies on DFT. 6. Perform IDFT.
7. Impose high-resolution portion on image.
8. Calculate MSE. If local minimum is obtained then increase the range of low frequencies to impose. 9. If the range of low frequencies has reached the
complete range available in the original low-resolution image then stop, else go to step 4.
When using this method we can obtain a sharp image at relatively short processing times. To demonstrate this lets assume that each M by N image requires 1 time unit to process. Thus the original high-resolution image would require 4 time units (because its size is 2M by 2N), however, an image containing only one quarter of the data in high-resolution will require 1.75 time units: 1 time unit for the N by M high resolution and 0.25 time units per each remaining M/2 by N/2 quarters (the zero padding is not relevant in this case). Thus, the processing time is less then half of the original one required if all data were given at high resolution.
III. SIMULATION RESULTS
We tested the method on two typical examples. The first, a test rosette containing a variety of frequencies, thus making it easy to view how resolution is improved. The second, a text example showing how barely readable text can be sharpened.
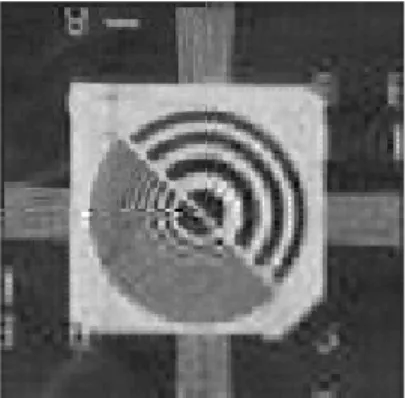
Fig. 1 shows the required high-resolution rosette image, whereas Fig. 2 shows the low-resolution rosette. Fig. 3 collaborates the low-resolution data, after padding with zeros to obtain same image size as the high-resolution image, with a portion of the high-resolution image in the first quarter of the image. The first quarter was used since in most cases the higher frequencies lie in the center of the image and we wanted to avoid a biased result.
As can be seen, the high-resolution portion of the image contains both high and low frequencies. The MSE between the first two images is calculated to be (normalized to 1). In Fig. 4 one can see the result of the super resolution iterative procedure. MSE is reduced to (normalized 0.0388) and the correlation coefficient between the high-resolution image and the one obtained is 97.4%.
6
10 337
4. ×
5
10 685
1. ×
Fig. 2.Original low resolution rosette image containing 64 by 64 pixels.
Fig. 3. Low-resolution rosette image after padding with zeros and embedding
the high-resolution data in top left corner.
The results of the second test case are given in Fig. 5 through Fig.7.
As can be seen, in the original high-resolution image (Fig. 5) the text is relatively sharp, whereas in the original low-resolution image the text is quite smeared (Fig. 6). The original MSE in this case is and the correlation coefficient is 78.2%.
5
10 214
3. ×
However, when applying the novel iterative approach one obtains the image shown in Fig. 7. The MSE is (an improvement by a scale of over 4) and the correlation coefficient is 90.8%, which is much higher than the one obtained by simple reconstruction.
4
10 0088
8. ×
Fig. 4. Reconstructed rosette image
Fig. 7. Reconstructed text image, according to super resolution
iterative procedure.
Fig. 5. Original high-resolution text image containing 128 by 128
pixels.
IV. CONCLUSION
In this paper the authors suggested a novel iterative method for achieving super resolution using a low-resolution image accompanied by a small portion of the high-resolution image. The new method allows obtaining only a small part of the data with high accuracy and thus saving time while obtaining the images and memory while saving the data before processing. This method may be applicable either as a simple and fast algorithm for slightly improving image content, or as a preliminary process before applying advanced digital techniques (e.g., text oriented recognition methods).
Fig. 6. Original low-resolution text image containing 64 by 64
pixels.
REFERENCES
[1] S. Bellini, “Blind Deconvolution,” S. Haykin (Editor), chapter 2, pp. 8-55, 1994.
[2] N.K. Bose, Wavelet-Based Blind Superresolution from Video Sequence and in MRI, PENNSYLVANIA STATE UNIVERSITY – Final Report, 2005.
[3] W. T. Freeman, T. R. Jones, and E. C. PasztorA, Example-Based Super-Resolution, IEEE - Computer Graphics and Applications: Vol. 22, No. 2, pp.56–65, 2002.
[4] H. Chang, D-Y Yeung, and Y. Xiong, Super-Resolution Through Neighbor Embedding, IEEE - Computer Vision and Pattern Recognition (CVPR2004): pp.275-282, 2004.
[6] A. Zomet and S. Peleg, Multi-sensor Super-Resolution, IEEE workshop on Applications of Computer Vision (WACV02), pp. 27-31, 2002. [7] R.W. Gerchberg and W. O. Saxton, A practical algorithm for
determination of phase from image and diffraction plane picture, Optik (Stuttgart), Vol. 35, pp. 237-246, 1972.
[8] J. R. Feinup, Phase retrieval algorithms – a comparison, Applied Optics, Vol. 21, No. 15, pp. 2758-2769, 1982.
[9] R.W. Gerchberg, Super-resolution through error energy reduction, Optica Acta, Vol. 21, No. 9, pp. 709-720, 1974.
[10] A. Papoulis, A new algorithm in spectral analysis and band-limited extrapolation, IEEE transactions on Circuits and Systems, Vol. 22, No. 9, pp. 735-742, 1975.