Hydrol. Earth Syst. Sci., 17, 371–378, 2013 www.hydrol-earth-syst-sci.net/17/371/2013/ doi:10.5194/hess-17-371-2013
© Author(s) 2013. CC Attribution 3.0 License.
Hydrology and
Earth System
Sciences
Dissolved organic carbon characteristics in surface ponds from
contrasting wetland ecosystems: a case study in the Sanjiang Plain,
Northeast China
L. L. Wang, C. C. Song, and G. S. Yang
Northeast Institute of Geography and Agroecology, Chinese Academy of Sciences, Changchun 130012, China
Correspondence to:C. C. Song ([email protected])
Received: 4 June 2012 – Published in Hydrol. Earth Syst. Sci. Discuss.: 25 June 2012 Revised: 23 December 2012 – Accepted: 4 January 2013 – Published: 29 January 2013
Abstract.Dissolved organic carbon (DOC) is a significant component of carbon and nutrient cycling in fluvial ecosys-tems. Natural wetlands, as important DOC sources for river and ocean ecosystems, have experienced extensive natural and anthropogenic disturbances such as climate change, hy-drological variations and land use change in recent years. The DOC characteristics in surface ponds from contrasting wet-lands in the Sanjiang Plain, Northeastern China were inves-tigated. Surface ponds at seven sites (two natural phialiform wetlands, three natural riparian wetlands, one degraded wet-land and one artificial wetwet-land, i.e., rice paddy) were moni-tored during the growing seasons of 2009 and 2010. The re-sults show that the surface ponds at the five natural wetland sites exhibited a wide range of DOC concentrations (10.06– 48.73 mg L−1) during the study period. The DOC
concentra-tions showed no annual differences (P >0.05) at all the wet-land sites, except one of the phialiform wetwet-land sites. The two phialiform wetlands exhibited higher DOC concentra-tions than the three riparian wetlands (P <0.05). The DOC concentration in the surface pond at the artificial wetland site was relatively low (P <0.05) compared to that at the de-graded wetland site. The C/C ratios (the color per carbon unit ratio, Abs400/DOC concentration) showed inconsistent vari-ations among these seven wetland sites, while the E4/E6 ra-tio (Abs465/Abs665, fulvic acid/humic acid) from the surface pond in the rice paddy land exerted 42.07–55.36 % reduc-tions (P <0.05), compared to those at the five natural wet-land sites. Furthermore, the E4/E6 ratio in the surface pond at the rice paddy site was significantly lower compared to that at the degraded wetland site (P <0.05), which indicated that disturbance to wetland DOC in surface ponds might
be stronger when natural wetlands were converted to rice paddies in comparison with wetland degradation. This study could not only provide insightful points for understanding the aquatic DOC dynamics from different wetland ecosys-tems, but also support data information for incorporating the aquatic DOC into the model for regional carbon budgets in the future.
1 Introduction
Dissolved organic carbon (DOC) is a collective term for dis-solved and colloidal organic compounds in various stages of decomposition, defined as the organic fractions that pass through a 0.45 µm filter (Roulet and Moore, 2006; Clay et al., 2009). It consists of a variety of molecules that range in size and structure from simple acids and sugars to complex hu-mic substances (Thurman, 1985; Wallage et al., 2006). These different fractions of DOC differ in relation to the spectro-scopic properties (Kalbitz et al., 2003; Hudson et al., 2007; Fellman et al., 2008). Previous studies have used a wide range of absorbances to measure DOC chemical character-istics (Thurman, 1985; Weishaar et al., 2003; Wallage et al., 2006; Fellman et al., 2008; Krupa et al., 2012). For exam-ple, specific UV (ultra-violet) absorbance (e.g., 280 nm) can be used for the initial assessment of the contribution of com-plex compounds to DOC (Rostan and Cellot, 1995; Kalb-itz et al., 2003). The specific UV light absorption at 254 nm (SUVA254)has been suggested as an index of the
Fluorescence spectroscopy can provide an excellent tool to identify DOC fractions (Hudson et al., 2007).
These qualities of absorbance characteristics tend to vary with different sources of DOC from variable sites ( ˚Agren et al., 2008). For instance, H¨oll et al. (2009) reported that specific UV absorbance values (280 nm, SUVA280) of
DOC showed significant difference in seasons or different sites (winter-rewetted site to winter moderately drained site, summer-rewetted site to summer moderately drained site). Natural wetland ecosystems store a substantial amount of carbon (Post et al., 1982; Mitra et al., 2005), despite only occupying 4 to 6 % of the Earth’s land area (Matthews and Fung, 1987; Aselmann and Crutzen, 1989). Natural wetlands are important sources of DOC to the fluvial environment (Koprivnjak and Moore, 1992; Worrall and Burt, 2005; Wal-lage et al., 2006). DOC concentrations in streams draining 42 catchments showed consistent relationships with the vari-able percent wetland in the catchment (Eckhardt and Moore, 1990). Though wetland ecosystems have been reported to be highly correlated with river DOC export (Gergel et al., 1999; Freeman et al., 2001; Fellman et al., 2008), studies on the chemical quality of DOC from different wetland types are less (Fellman et al., 2008).
Wetland conversion activities in the Sanjiang Plain were extensive in the past 50 yr (Song et al., 2008). The conversion of natural ecosystems to artificial wetlands (i.e., rice paddy land) in this region has been accompanied by wetland degra-dation caused by the decrease of standing water depth and the input of nutrients during agricultural activities (Song et al., 2011) as well as the changing climate (Qian and Ruby Leung, 2007). Our previous study found that the DOC con-centration from the surface pond decreased from the natural phialiform wetlands to rice paddy lands (Wang et al., 2010), while there was no significant difference between the ripar-ian wetland and degraded wetland (Song et al., 2011). How-ever, these preliminary findings are insufficient, thus, here a continuous two-year DOC monitoring was installed to ex-amine whether the observed variations in DOC concentra-tions were maintained. Furthermore, we aimed to compare the DOC concentrations between (1) the natural riparian wet-land and rice paddy wet-land, (2) the DOC differences between phialiform wetlands and degraded wetlands, and lastly, (3) to compare DOC concentrations from rice paddy land and those from degraded wetland to clarify which exerts more in-fluence on DOC dynamics. Especially, we want to figure out the DOC spectral characteristics among these different sites. Here absorbance at 400 nm was used, and also at 465 nm and 665 nm (Thurman, 1985) to represent the DOC color charac-teristics (Thurman, 1985; Wallage et al., 2006). A wide va-riety of studies have predicted DOC concentrations based on water color measurements (Moore and Jackson, 1989; Tao, 1998; Worrall et al., 2002, 2003; Worrall and Burt, 2005). This study aimed to better understand the aquatic DOC dy-namics from different wetland ecosystems in the context of land use change and climate change.
2 Site description and methods
2.1 Site description
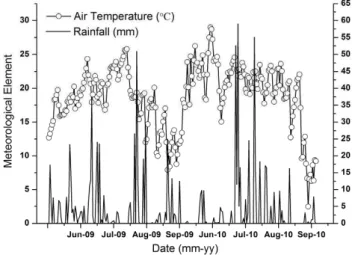
The Sanjiang Plain is framed by the Heilong River, Wusuli River and Songhua River (Fig. 1); moreover, many tributary rivers, such as Nongjiang River, Yalv River, Bielahonghe River and Naoli River exist in this area. The riparian wet-lands developed from the flood plains near the rivers in this region. In addition, there are phialiform wetlands originat-ing from the lowlands around the terrace, one of the typ-ical geomorphic types (Liu and Ma, 2002). The geomor-phic characteristics, boreal climate and hydrogeological con-ditions lead to the large areas with distributed natural wet-lands in this region. Air temperatures in the Sanjiang Plain increase gradually from January to August, and then decline until December. Nearly half of the annual rainfall occurs in July and August. The Sanjiang Experimental Station of Wet-land Ecology, Chinese Academy of Sciences, is located in the Sanjiang Plain. The climate in the station represents the regional weather pattern. The site-specific weather observa-tions in the station showed that the mean air temperatures from June to September were 17.83◦C in 2009 and 19.79◦C in 2010. The total rainfall during this period was 509.40 mm for 2009 and 414.70 mm for 2010, respectively. This indi-cates that the general weather during our study period was warmer and drier in 2010 than that in 2009 (Fig. 2).
In this study we chose two typical phialiform natu-ral wetlands – Calamagrostis angustifolia phialiform wet-land (CAPW), and Carex lasiocarpa phialiform wetland (CLPW), three riparian natural wetlands near three tributary rivers – Bielahonghe riparian wetland (BRW), Nongjiang ri-parian wetland (NRW) and Yalv riri-parian wetland (YRW), the artificial wetland (AW: rice paddy land) and the de-graded wetland (DW). The CAPW located in the outside position with a higher terrain is seasonally inundated, while the CLPW with lower terrain is permanently inundated with higher water level (Table 1). The hydrological conditions in the riparian wetlands are largely affected by rivers. The ri-parian wetlands show more drastic hydrological fluctuations. The contents of soil total nitrogen and soil organic matter (SOM) in the riparian wetlands are lower compared with the two phialiform wetlands. Compared with natural wetlands, the water level and SOM in the disturbed wetlands (DW and AW) decreased (Table 1). (NH4)2HPO4and urea are
fertil-ized in the rice paddy land during the rice growth season. Hydrological and chemical characteristics of the study sites are listed in Table 1.
2.2 Water sample collection and DOC analysis
L. L. Wang et al.: Dissolved organic carbon characteristics in different wetland surface ponds 373
Table 1.Characteristics of the seven studying sites in the Sanjiang Plain, Northeastern China.
Water Total Soil total N
Site level (cm) N (g kg−1) SOM (%) (g kg−1)
CAPW 12.49±2.49 1.68±0.27 9.47±0.43 6.67±0.61 CLPW 23.79±1.71 1.29±0.23 20.77±0.71 21.17±1.17 BRW 23.99±4.51 0.69±0.09 7.30±0.23 5.77±0.18 NRW 24.61±1.48 1.01±0.24 7.43±0.44 5.23±0.17 YRW 25.52±1.94 0.74±0.14 7.73±0.22 5.83±0.33 DW 8.83±0.49 0.64±0.24 5.57±0.38 3.73±0.19 AW 8.75±0.79 1.17±0.41 4.07±0.23 2.67±0.15
Note:Calamagrostis angustifoliaphialiform wetland (CAPW), andCarex lasiocarpa
phialiform wetland (CLPW), Bielahonghe riparian wetland (BRW), Nongjiang riparian wetland (NRW) and Yalv riparian wetland (YRW), the artificial wetland (AW-rice paddy land) and the degraded wetland (DW); the abbreviations in the following table source from the same full names.
Fig. 1.The location of the Sanjiang Plain, Northeast China (Wu, 2009).
of wetlands. Three sampling replicates at about 20 m inter-vals were collected from each site. For every sampling bottle, the sampled water consisted of water from four directions. In this study, the data of DOC concentrations for 2009 were cited from Wang et al. (2010) and Song et al. (2011). We col-lected topsoil (0–20 cm) with three soil profiles on each plot in September 2010 to analyze SOM and soil total nitrogen. The water samples were transported to the laboratory imme-diately after sampling, and were filtered through 0.45 µm fil-ters. The first 100 mL of each sample was used to rinse the filter three times. The remaining was filtered into separate vials without any head space to minimize degassing (Wang et al., 2010; Song et al., 2011). Multi N/C 2100 Analyzer (Analytik Jena AG, Germany) was used to analyze total or-ganic carbon (TOC) and total inoror-ganic carbon (TIC) of the water samples. The analyzer used a non-dispersive infrared detector to quantitatively measure CO2levels to get the
con-centrations of TIC and TOC. DOC concon-centrations were de-termined by TOC minus TIC. Each sample was injected at least two times to obtain a standard deviation of≤2 %.
Fig. 2.Air temperature and rainfall in the Sanjiang Plain Wetland Station during the growing seasons of 2009 and 2010.
2.3 Determination of specific absorbance values and data analysis
The C/C ratio (the color per carbon unit ratio, Abs400/DOC concentration) of the samples was obtained by dividing the absorbance values at 400 nm (Abs400)by the corresponding DOC concentrations (Wallage et al., 2006). A high C/C ra-tio indicates that the DOC comprises a greater proporra-tion of colored humic substances compared to uncolored non-humic substances (Wallage et al., 2006). The E4/E6 ratio was deter-mined by dividing the absorbance at 465 nm (Abs465)by that at 665 nm (Abs665)for the individual samples (Wallage et al., 2006). This ratio can be used to measure the proportion of fulvic acid to humic acid in the colored humic compo-nent of DOC (Thurman, 1985; Wallage et al., 2006). The ab-sorbance measurements of 400 nm, 465 nm and 665 nm were made on a UV-7504 spectrophotometer using deionized wa-ter as a blank. A quartz cell with a 1.0-cm path length was utilized.
In addition, the SPSS 11.5 software and Origin 7.5 sta-tistical packages were used in the stasta-tistical analysis. The difference in DOC, C/C and E4/E6 ratios among different sites was tested by the repeated measures analysis of vari-ance tests (ANOVAs). In analysis whereP <0.05, the com-parisons were considered statistically significant.
3 Results
3.1 DOC concentrations
374 “ ” “ L. L. Wang et al.: Dissolved organic carbon characteristics in different wetland surface ponds”
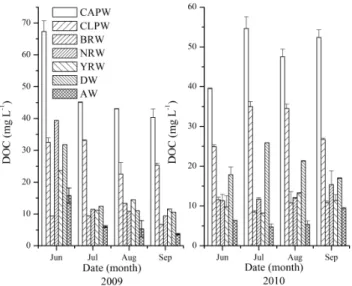
Fig. 3.Monthly DOC concentrations in surface ponds from con-trasting wetland ecosystems in the Sanjiang Plain during the grow-ing seasons of 2009 and 2010. Note: the data for 2009 is cited from Wang et al. (2010) and Song et al. (2011);Calamagrostis
angusti-foliaphialiform wetland (CAPW), andCarex lasiocarpaphialiform
wetland (CLPW), Bielahonghe riparian wetland (BRW), Nongjiang riparian wetland (NRW) and Yalv riparian wetland (YRW), the ar-tificial wetland (AW-rice paddy land) and the degraded wetland (DW); the abbreviations in the following figures source from the same full names.
at seven sites. The highest two-year mean DOC concentra-tion was found in the surface pond at the CAPW site, fol-lowed by the CLPW site (29.33±1.75 mg L−1), the DW site
(18.48±2.67 mg L−1), the NRW site (15.21±3.51 mg L−1),
the YRW site (12.91±1.67 mg L−1) and the BRW site
(10.06±0.72 mg L−1), while the lowest value was observed in the surface pond at the AW site. The two-year DOC con-centrations in the surface pond from CAPW were higher than that in CLPW (P <0.05). There was no significant differ-ence among the three riparian natural wetlands (P >0.05). The two-year DOC concentrations in surface ponds from both CAPW and CLPW sites were significantly higher com-pared to those in the three riparian natural wetlands, the degraded wetland and the rice paddy land (P <0.05). The DOC concentrations at the BRW site was higher than those at the degraded wetland site (P <0.05), yet there were no significant differences between the other two riparian wet-lands (NRW and YRW) and the DW. The DOC concentra-tions at the NRW site were significantly higher than that at the AW site, while no great differences were observed be-tween the other two riparian wetlands (BRW and YRW) and the AW (P >0.05). It is notable that the DOC concentra-tions at the DW site were remarkably higher than that at the AW site (P <0.05). As for the between-year difference, the DOC concentration in the surface pond at the CLPW site in 2009 was greater than that in 2010 (P <0.5). No significant differences in DOC concentrations were observed between
Fig. 4.Monthly C/C ratio in surface ponds from contrasting wet-land ecosystems in the Sanjiang Plain during the growing season of 2010.
2009 and 2010 for the surface ponds at the other six sites (P >0.5).
3.2 C/C ratio
The C/C ratios ranged from 0.06 to 0.65 in the surface ponds we sampled from April to September in 2010 (Table 2 and Fig. 4). The C/C value at the CAPW and CLPW sites showed little difference (P >0.5). Also, no significant C/C difference between the three riparian wetlands was observed (P >0.5). The C/C value at the CAPW site is greater than those at the three riparian wetland sites, DW and AW sites (P <0.5), while the C/C at the CLPW site is much higher than those at the YRW, DW and AW sites. The C/C value in the degraded wetland was lower compared to those in the three riparian wetlands (P <0.5), and the C/C ratios were al-most the same in the three riparian sites (P >0.5). The ratio at the NRW site was relatively high compared to that at the AW site, but we observed no large differences between the other two riparian sites and the AW sites (P >0.5). In addi-tion, the differences between the DW and AW sites can be ignored (P >0.5).
3.3 E4/E6 ratio
L. L. Wang et al.: Dissolved organic carbon characteristics in different wetland surface ponds 375
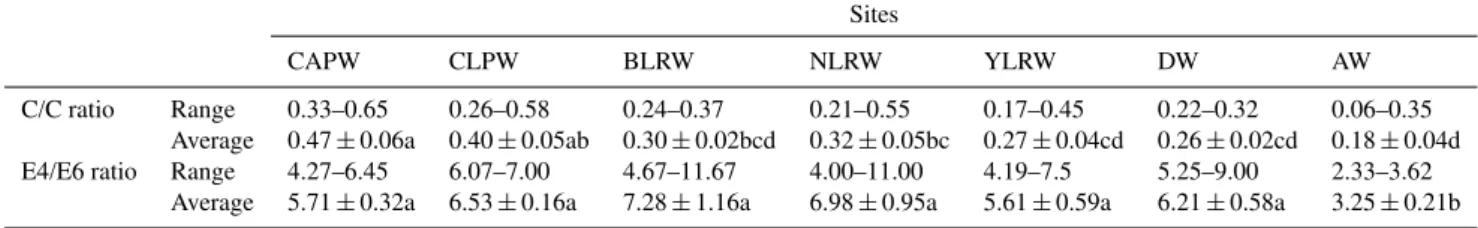
Table 2.Average values of C/C and E4/E6 ratios in surface ponds from contrasting wetlands in the Sanjiang Plain during the growing season of 2010.
Sites
CAPW CLPW BLRW NLRW YLRW DW AW
C/C ratio Range 0.33–0.65 0.26–0.58 0.24–0.37 0.21–0.55 0.17–0.45 0.22–0.32 0.06–0.35
Average 0.47±0.06a 0.40±0.05ab 0.30±0.02bcd 0.32±0.05bc 0.27±0.04cd 0.26±0.02cd 0.18±0.04d E4/E6 ratio Range 4.27–6.45 6.07–7.00 4.67–11.67 4.00–11.00 4.19–7.5 5.25–9.00 2.33–3.62
Average 5.71±0.32a 6.53±0.16a 7.28±1.16a 6.98±0.95a 5.61±0.59a 6.21±0.58a 3.25±0.21b
Note: Average is (mean±SE); there is significant difference among those averaged values with different lower-alpha after the averaged values, whereas no significant difference.
natural wetland sites. Furthermore, the E4/E6 ratio in the sur-face pond at the AW site revealed relatively low values com-pared to that at the DW site (P <0.5).
4 Discussion
4.1 Comparisons with other studies
Natural wetlands, as significant carbon pools, have been in-creasingly recognized as important DOC sources for adja-cent waters (Wallage et al., 2006; Dawson and Smith, 2007; Baker et al., 2008). Much work has been completed concern-ing the concentration and bioavailability of soil dissolved or-ganic carbon from wetland ecosystems in the Sanjiang Plain (Zhang et al., 2005; Zhang et al., 2008; Guo et al., 2010), yet rare information is available about how the dynamics of DOC are derived from surface ponds in wetland ecosystems of the Sanjiang Plain (Wang et al., 2010; Song et al., 2011). In this study we determined that the averaged DOC value was 23.25 mg L−1 for the surface ponds at the five natural
wetland sites in the Sanjiang Plain during the two-year sam-plings. Nagao et al. (2007) showed that DOC concentrations in river waters from tributaries of the Amur River in the San-jiang Plain were generally lower than 10 mg L−1. The higher concentrations we recorded suggest that the natural wetlands in our study could serve as alternative DOC sources for tribu-taries along the Amur River in the Sanjiang Plain. Similarly, Waiser and Robarts (2004) reported that natural wetlands across the Canadian prairies exhibited high DOC concentra-tions (>10 mg L−1), acting as significant DOC pools for
ad-jacent waters. Raphael et al. (1996) and Arrigoni et al. (2008) pointed out that the Tivoli Bay’s freshwater tidal wetlands exported DOC to the main channel of the Hudson River, but the magnitude of DOC concentrations (<7 mg L−1) in their
studies were much lower than in our study. These variations might result from different rates of DOC production, solubil-ity and transport under freshwater and tidal wetlands. Alter-natively, this study together with previous studies provided substantial evidence for the importance of natural wetlands on DOC export to adjacent rivers. This is also confirmed by Hope et al. (1997) who reported a significant correlation between the average of DOC concentration in 11 Scottish catchments and the percentage of natural wetland cover.
Fig. 5.Monthly E4/E6 ratios in surface ponds from contrasting wet-land ecosystems in the Sanjiang Plain during the growing season of 2010.
4.2 DOC characteristics from different natural wetland ecosystems
UK have also reported that the DOC releases from differ-ent wetland types depended on nutritional grounds (Mitsch and Gosselink, 1993; Freeman et al., 2004). The significant differences in two-year DOC concentrations between CAPW and CLPW, which is also confirmed by Wang et al. (2010), might come from the fact that they held different contents of soil organic carbon (Table 1; Zhang, 2006) along with dif-ferent hydrologic characteristics (Wang et al., 2010). Further-more, soil pH values from wetland ecosystems showed a con-trary trend compared to soil organic carbon (SOC) changes (Yang, 2006), and also affected the microbial species (Li et al., 2001), which might influence DOC variations from surface ponds in wetland ecosystems.
In addition to DOC concentrations, this study investigated color/carbon ratios (C/C). The C/C ratios showed no signif-icant difference between the two phialiform wetland sites, while the C/C ratios were higher at the CAPW sites com-pared with those at the three riparian wetland sites. This sug-gests that, for every carbon unit (e.g., per mg C), the DOC at the CAPW site contained higher proportions of colored humic substances compared to uncolored non-humic sub-stances (Wallage et al., 2006) than per unit of carbon at the riparian sites. However, the E4/E6 differences between the two phialiform wetland sites and the riparian wetland sites were not significant. It implied that the fulvic acid/humic acid ratios of these two wetland types are similar.
4.3 DOC dynamics from artificial wetland and degraded wetland
In the present study, DOC concentration in the surface pond at the artificial wetland is much lower than the degraded wetland site (P <0.5). It implied that the DOC concentra-tions leaching to water bodies was lower from rice paddy land compared with degraded wetland. This might be be-cause the agricultural management practices (e.g., fertilizer use and irrigation) within the rice paddy land reduce DOC concentrations in water bodies. It has been reported that ad-ditions of acid anions like sulphate (SO24−)and nitrate (NO−3) to wetland soils could lead to DOC consumption during re-dox reactions (Bartlett et al., 2005). In addition, compared with the two phialiform wetlands, we found DOC concentra-tion depleconcentra-tion in the rice paddy land, which is also verified by our precious study (Wang et al., 2010). Special attention of DOC concentrations should be paid on the degraded wet-lands, which showed lower DOC values than those of the two phialiform counterparts. However, the DOC concentrations from surface ponds in the rice paddy land or degraded wet-land only showed significant differences with one of the three riparian wetlands. This difference shows that highly variable ecosystem functions in different wetland types (Groffman et al., 1996) might be taken into account, with regard to DOC changes disturbed by human activities.
The E4/E6 values during our study period were the lowest in the surface pond at the artificial site compared to those at
the phialiform wetland sites, the riparian wetland sites, and the degraded wetland sites (P <0.5). This clear difference in the E4/E6 ratios between the artificial wetland site and the other sites implied that DOC at the rice paddy site was less dominated by immature fulvic acids compared with those at the other sites. It might be caused by the relatively low level of microbial activity (Wallage et al., 2006) in the rice paddy land. It has been reported that the microbial biomass carbon significantly decreased after natural wetlands were converted to rice paddy lands (Zhang, 2006). There are no significant differences in the E4/E6 ratio between the surface pond at the natural wetland sites and the degraded sites. This in-dicates that natural wetland conversion to rice paddies has stronger effects on aquatic DOC chemical characteristics in comparison with wetland degradation.
5 Conclusions
In this study, surface ponds from the five natural wetlands in the Sanjiang Plain showed wide ranges of DOC concen-trations (10.06–48.73 mg L−1), C/C ratios (0.27–0.47) and
E4/E6 ratios (5.61–7.28). Different scenarios of DOC varia-tions among the two phialiform wetlands and the three ripar-ian wetlands were introduced, compared with artificial wet-land or degraded wetwet-land. In the various wetwet-land ecosystems in northeast China, ignoring the wetland types would lead to biases of the DOC loss potential with land use change and other environmental stresses. In addition, lower DOC con-centrations in the surface pond of the artificial wetland than that in the degraded wetland were observed. Lower E4/E6 ra-tio was also found in the artificial wetland than those at the other six sites, though no differences were observed between natural sites and degraded sites. Natural wetland conversion to rice paddies might exert stronger effects on aquatic DOC chemical characteristics compared with those from wetland degradation. Additional site-specific field measurements are required to further refine the differences in DOC charac-teristics among the natural sites, arable land sites and de-graded sites in Northeastern China, and the corresponding parameters, such as SOC, pH-values or redox conditions need to be monitored to identify the underlying reasons for DOC dynamics.
Acknowledgements. This work has been supported by the
Knowl-edge Innovation Program of the Chinese Academy of Sciences (KZCX2-YW-JC301), Strategic Priority Research Program – Climate Change: Carbon Budget and Related Issue of the Chinese Academy of Sciences (Grant No. XDA05050508, XDA05020502), the National Natural Science Foundation of China (41125001, 41101090 and 40930527), the National Key Basic Research Support Foundation of China (2009CB421103). The editor Peter Grathwohl and two anonymous referees are appreciated for their valuable comments and fruitful suggestions.
L. L. Wang et al.: Dissolved organic carbon characteristics in different wetland surface ponds 377
References
˚
Agren, A., Buffam, I., Berggren, M., Bishop, K., Jansson, M., and Laudon, H.: Dissolved organic carbon characteristics in bo-real streams in a forest-wetland gradient during the transition between winter and summer, J. Geophys. Res., 113, G03031, doi:10.1029/2007JG000674, 2008.
Arrigoni, A., Findlay, S., Fischer, D., and Tockner, K.: Predicting carbon and nutrient transformations in tidal freshwater wetlands of the Hudson River, Ecosystems, 11, 790–802, 2008.
Aselmann, I. and Crutzen, P.: Global distribution of natural fresh-water wetlands and rice paddies, their net primary productivity, seasonality and possible methane emissions, J. Atmos. Chem., 8, 307–358, 1989.
Baker, A., Cumberland, S., and Hudson, N.: Dissolved and total organic and inorganic carbon in some British rivers, Area, 40, 117–127, 2008.
Bartlett, R., Bottrell, S., and Coulson, J.: Behaviour of sulphur dur-ing diagenesis of a maritime ombrotrophic peat from Yell, Shet-land IsShet-lands, UK, Appl. Geochem., 20, 1597–1605, 2005. Chapin, F., Matson, P., and Mooney, H.: Principles of
Terres-trial Ecosystem Ecology. Springer-Verlag, New York, NY, USA, 2002.
Clay, G., Worrall, F., and Fraser, E.: Effects of managed burning upon dissolved organic carbon (DOC) in soil water and runoff water following a managed burn of a UK blanket bog, J. Hydrol., 367, 41–51, 2009.
Dawson, J. and Smith, P.: Carbon losses from soil and its conse-quences for land-use management, Sci. Total Environ., 382, 165– 190, 2007.
Eckhardt, B. and Moore, T.: Controls on dissolved organic carbon concentrations in streams, southern Quebec, Canadian Journal of Fisheries and Aquatic Sciences, 47, 1537–1544, 1990.
Fellman, J. B., D’Amore, D. V., Hood, E., and Boone, R. D.: Flu-orescence characteristics and biodegradability of dissolved or-ganic matter in forest and wetland soils from coastal temperate watersheds in southeast Alaska, Biogeochemistry, 88, 169–184, 2008.
Freeman, C., Evans, C., Monteith, D., Reynolds, B., and Fenner, N.: Export of organic carbon from peat soils, Nature, 412, p. 785, 2001.
Freeman, C., Fenner, N., Ostle, N., Kang, H., Dowrick, D., Reynolds, B., Lock, M., Sleep, D., Hughes, S., and Hudson, J.: Export of dissolved organic carbon from peatlands under ele-vated carbon dioxide levels, Nature, 430, 195–198, 2004. Gergel, S. E., Turner, M. G., and Kratz, T. K.: Dissolved organic
car-bon as an indicator of the scale of watershed influence on lakes and rivers, Ecol. Appl., 9, 1377–1390, 1999.
Groffman, P. M., Hanson, G. C., Kiviat, E., and Stevens, G.: Vari-ation in microbial biomass and activity in four different wetland types, Soil Sci. Soc. Am. J., 60, 622–629, 1996.
Guo, Y., Wan, Z., and Liu, D.: Dynamics of dissolved organic car-bon in the mires in the Sanjiang Plain, Northeast China, J. Envi-ron. Sci., 22, 84–90, 2010.
H¨oll, B. S., Fiedler, S., Jungkunst, H. F., Kalbitz, K., Freibauer, A., Dr¨osler, M., and Stahr, K.: Characteristics of dissolved organic matter following 20 years of peatland restoration, Sci. Total En-viron., 408, 78–83, 2009.
Hope, D., Billett, M. F., and Cresser, M. S.: Exports of organic car-bon in two river systems in NE Scotland, J. Hydrol., 193, 61–82,
1997.
Hudson, N., Baker, A., and Reynolds, D.: Fluorescence analysis of dissolved organic matter in natural, waste and polluted waters – a review, River Res. Appl., 23, 631–649, 2007.
Kalbitz, K., Schmerwitz, J., Schwesig, D., and Matzner, E.: Biodegradation of soil derived dissolved organic matter as re-lated to its properties, Geoderma, 113, 273–291, 2003.
Koprivnjak, J. F. and Moore, T.: Sources, sinks, and fluxes of dis-solved organic carbon in subarctic fen catchments, Arctic Alp. Res., 24, 204–210, 1992.
Krupa, M., Spencer, R. G., Tate, K. W., Six, J., Kessel, C. V., and Linquist, B. A.: Controls on dissolved organic carbon composi-tion and export from rice-dominated systems, Biogeochemistry, 108, 447–466, 2012.
Li, Z., Sun, B., and Lin, X. X.: Density of soil organic carbon and the factors controlling its turnover in East China, Scientia Geo-graphica Sinica, 8, 301–307, 2001 (in Chinese with English Ab-stract).
Liu, X. T. and Ma, X. H.: Natural environment change and ecolog-ical conservation of the Sanjiang Plain, Beijing: Science Press, 2002, (in Chinese).
Matthews, E. and Fung, I.: Methane emission from natural wet-lands: global distribution, area, and environmental characteristics of sources, Global Biogeochem Cy., 1, 61–86, 1987.
Mitra, S., Wassmann, R., and Vlek, P.: An appraisal of global wet-land area and its organic carbon stock, Current Science, 88, 25– 35, 2005.
Mitsch, W. and Gosselink, J.: Wetlands Van Nostrand Reinhold, New York, 1993.
Moore, T. and Jackson, R. J.: Dynamics of dissolved organic carbon in forested and disturbed catchments, Westland, New Zealand. 2. Larry River, Water Resour. Res., 25, 1331–1339, 1989. Nagao, S., Terashima, M., Kodama, H., Kim, V., Shestekin, P., and
Makhinov, A.: Migration Behaviour of Fe in the Amur River Basin, Report on Amur-Okhotsk Project, 4, 37–48, 2007. Post, W., Emanuel, W., Zinke, P., and Stangenberger, A.: Soil
car-bon pools and world life zones, Nature, 298, 156–159, 1982. Qian, Y. and Leung, L. R.: A long-term simulation and observations
of the hydroclimate in China, J. Geophys. Res., 112, D14104, doi:10.1029/2006JD008134, 2007.
Raphael, B., Findlay, S., and Millbrook, N.: Sources and character-ization of dissolved organic carbon in the Tivoli Bays freshwater tidal wetland, Section I, edited by: Waldman, J. R., Nieder, W. C., and Blair, E. A., 23 pp., Final Reports of the Tibor T Polgar Fellowship Program, 1995 Hudson River Foundation, NY, 1996. Rostan, J. C. and Cellot, B.: On the use of UV spectrophotometry to assess dissolved organic carbon origin variations in the Upper Rhˆone River, Aquatic Sciences-Research Across Boundaries, 57, 70–80, doi:10.1007/BF00878027, 1995.
Roulet, N. and Moore, T.: Environmental chemistry: Browning the waters, Nature, 444, 283–284, 2006.
Song, C. C., Wang, L. L., Guo, Y. D., Song, Y. Y., Yang, G. S., and Li, Y. C.: Impacts of natural wetland degradation on dissolved carbon dynamics in the Sanjiang Plain, Northeastern China, J. Hydrol., 398, 26—32, 2011.
Tao, S.: Spatial and temoral variation in DOC in the Yichun River, China, Water Res., 32, 2205–2210, 1998.
Thurman, E.: Organic geochemistry of natural waters, Springer, 1985.
Waiser, M. and Robarts, R.: Photodegradation of DOC in a shallow prairie wetland: evidence from seasonal changes in DOC opti-cal properties and chemiopti-cal characteristics, Biogeochemistry, 69, 263–284, 2004.
Wallage, Z., Holden, J., and McDonald, A.: Drain blocking: An ef-fective treatment for reducing dissolved organic carbon loss and water discolouration in a drained peatland, Sci. Total Environ., 367, 811–821, 2006.
Wang, L., Song, C., Song, Y., Guo, Y., Wang, X., and Sun, X.: Effects of reclamation of natural wetlands to a rice paddy on dissolved carbon dynamics in the Sanjiang Plain, Northeastern China, Ecol. Eng., 36, 1417–1423, 2010.
Weishaar, J., Aiken, G., Bergamaschi, B., Fram, M., Fujii, R., and Mopper, K.: Evaluation of specific ultraviolet absorbance as an indicator of the chemical composition and reactivity of dissolved organic carbon, Environ. Sci. Technol., 37, 4702–4708, 2003. Worrall, F. and Burt, T.: Predicting the future DOC flux from upland
peat catchments, J. Hydrol., 300, 126–139, 2005.
Worrall, F., Burt, T. P., Jaeban, R. Y., Warburton J. F., and Shed-den, R.: Release of dissolved organic carbon from upland peat, Hydrol. Process., 16, 3487–3504, 2002.
Worrall, F., Burt, T. P., and Shedden, R.: Long term records of river-ine carbon flux, Biogeochemistry, 64, 165–78, 2003.
Wu, H. T.: Study on Soil fauna community succession and its func-tional responses in typical wetland in the Sanjiang Plain, PhD. Thesis, Graduate school of Chinese Academy of Sciences, 2009. Yang, J. S.: Study on Dynamics of Organic Carbon ofDeyeuxia
angutifoliaWetland Ecosystem in Sanjiang Plain, PhD. Thesis,
Graduate school of Chinese Academy of Sciences, 2006. Zhang, J. B.: Effects of wetland cultivation and land use on soil
car-bon fraction in the Sanjiang Plain, PhD. Theses, Graduate school of Chinese Academy of Sciences, 2006.
Zhang, J. B., Song, C., and Yang, W.: Influence of land-use type on soil dissolved organic carbon in the Sanjiang Plain, China Envi-ronmental Science, 25, 343–347, 2005 (in Chinese with English Abstract).