477
Phylogeographic pattern of
Jenynsia multidentata
(Cyprinodontiformes: Anablepidae) in the southern boundary
of the Brazilian Subregion, Argentina
María Cecilia Bruno
1, Jorge Rafael Casciotta
2,3, Adriana Edith Almirón
2and
Marta Susana Lizarralde
1The Atlantic drainage basins are located in the southern Pampean area, in the southernmost part of the Brazilian subregion. Tectonic and paleoclimatic phenomena, occurring during the Quaternary, have currently isolated these basins from the present hydrographic system. Their ichthyofaunal composition is similar to that of hydric systems located further northward. Jenynsia multidentata is a species with wide distribution in the Atlantic drainage basins, as well as in those Northern basins. Here we investigated the phylogeographic pattern of Jenynsia multidentata and analyzed its relationships with the paleoclimatic and geologic history of the region. The analysis of the population’s assemblage showed moderate genetic diversity, demo-graphic equilibrium and marked genetic structure in the populations that occupy the extremes of the distributional range. The populations in the center of the range did not present genetic diversity, sharing a single haplotype. These results allow inferring that the presence of Jenynsia multidentata in the area results from historical demographic processes that are independent but complementary. In turn, these processes could arise from paleoclimatic changes occurred during the Quater-nary.
Las cuencas de pendiente atlántica del área pampeana Austral son el límite meridional de la subregión Brasílica. Fenómenos tectónicos y paleoclimáticos ocurridos durante el Cuaternario han dejado aisladas a estas cuencas del diseño hidrográfico actual. La composición íctica de estás cuencas es similar a la de los sistemas hídricos ubicados más al norte. Jenynsia multidentata es una especie con un amplia distribución en las cuencas de pendiente atlántica, como así también, en las cuencas ubicadas al norte. En el presente trabajo se investigó el patrón filogeográfico de Jenynsia multidentata, y se examinó la relación entre este patrón y la historia paleoclimática y geológica de la región. En el análisis del conjunto de poblaciones se encontró evidencia de una moderada diversidad genética, equilibrio demográfico, y una marcada estructura poblacional, en las poblaciones que ocupan los extremos de la distribución. Mientras que en las poblaciones que ocupan el centro de la distribución no se encontró diversidad genética presentando un único haplotipo. De los resultados obtenidos se infiere que la presencia de Jenynsia multidentata en el área es el resultado de procesos demográficos históricos independientes pero complementarios. A su vez, estos procesos podrían surgir de los cambios paleoclimáticos ocurridos durante el Cuaternario.
Key words: Control region, Genetic structure, Ichthyofauna, Phylogeography, Southern Pampean area.
1Centro Regional de Estudios Genómicos, Universidad Nacional de La Plata. Av. Calchaquí km 23,5, 1888 Florencio Varela, Buenos Aires,
Argentina; CONICET. mcecibruno@gmail.com; mslizarralde@gmail.com
2División Zoología Vertebrados, Universidad Nacional de la Plata, Paseo del Bosque s/n, 1900 La Plata, Buenos Aires, Argentina.
jrcas@fcnym.unlp.edu.ar; aalmiron@fcnym.unlp.edu.ar
3Comisión de Investigaciones Científicas de la provincia de Buenos Aires, CIC.
Introduction
The Neotropical freshwater ichthyofauna is the most diverse in the world (Reis, 2003). The actual number of species could reach 8,000 according to Schaefer (1998), Vari & Malabarba (1998) and Reis et al. (2003). The reasons for such a marked diversity are likely to be both historical and ecological, a result of millions of years of evolution from the breakup of Gondwana to the present (Ribeiro, 2006). Much of
the diversification of Neotropical freshwater fishes took place in the dynamically changing rivers and watersheds of South America during the Late Cretaceous and Cenozoic. These continental waters were at once agents and the products of landscape evolution (Lundberg et al., 1998).
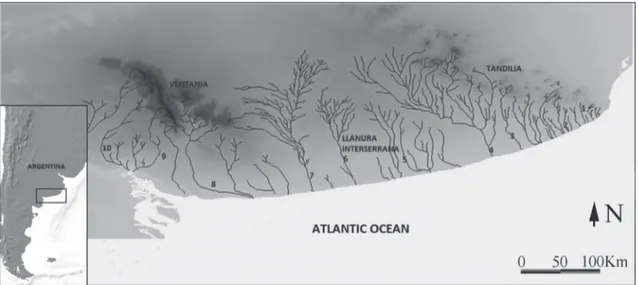
drainage in the southern Pampean area, Argentina (Casciotta et al., 1999) (Fig. 1). The courses in this drainage basin flow southwards following a parallel pattern and are isolated from each other. Moreover, all these water courses, mostly relatively small, are also separated from the ones located to the north (Almirón et al., 1997; Casciotta et al., 1999).
Geologists distinguish several geologic provinces in the southern Pampean area: Tandilia, the Llanura Interserrana Bonaerense (Inter-mountainous Pampean Plain), Ventania, and the Colorado Basin (Rolleri, 1975). Tandilia is a fault-mountain system mainly formed by late Precambrian to early Paleozoic rocks (Yrigoyen, 1975). Ventania is also a fold-mountain system, but formed mostly by late Precambrian to late Paleozoic rocks (Llambias & Prozzi, 1975). The Colorado basin is an extensional basin with strong subsidence formed during late Triassic to early Cretaceous times (Zambrano, 1980; Uliana & Biddle, 1988). Finally, the Llanura Interserrana Bonaerense, wich belong to Claromecó basin is covered by the late Miocene to Holocene so-called Pampean sediments (Fidalgo et al., 1975).
Most of the streams in the southern Pampean area run south from Tandilia, Ventania and the Llanura Interserrana Bonaerense (Casciotta et al., 1999). When the whole positive area of Tandilia, the Llanura Interserrana Bonaerense and Ventania are considered, the drainage pattern appears to be radial. The hydrogeographic pattern of the region is the result of a combination of tectonics, climate and sea level changes since the Miocene (Casciotta et al., 1999). Due to eustatic and/ or neotectonic changes occurred during the late Pleistocene and Holocene, the current river beds could have been tributaries of different water courses in the past (Frenguelli, 1956;Tonni & Cione, 1997). In fact, the Sauce Grande River has been proposed to have been part of the Colorado River basin during the Quaternary (Casciotta et al., 1999; Ponce et al., 2011). The southern Pampean area has been characterized by alternating arid and cold/humid and warm conditions during the Quaternary and even since the Miocene (Aguirre et al., 1999; Aramayo et al., 2002; Quattrocchio et al., 2008). Paleoclimatic reconstructions suggest an arid-semiarid habitat for the southern Pampean region during much of the Quaternary (Quattrocchio et al., 1988, 1993; Tonni et al., 1999; Nabel et al., 2000) (Fig. 1).
The fish fauna present in the Atlantic coastal drainage in southern Buenos Aires province, Argentina is very poor in terms of species richness. The number of recorded species is no higher than 14, and it is particularly interesting that the ichthyofauna of these basins is similar to that of hydric systems located further north, even though there is at present no connection between these basins.
According to Cione & Barla (1997) and Casciotta et al. (1999) the presence of Brazilian species in these basins may be explained by the following hypotheses: 1. These fishes were present in the area before the last glacial period and resisted unfavorable climates; 2. These fishes entered the area during periods of marine regression, through basins that are currently submerged in the ocean platform. These basins may have been connected with others situated farther north.
The fishes of the genus Jenynsia are small viviparous cyprinodontiforms. This genus comprises thirteen species distributed in highland drainages of southeastern Brazil, lowlands in the La Plata basin, coastal Atlantic drainages of southern and southeastern Brazil, Uruguay, western and northeastern Argentina, and southeastern Bolivia (Ghedotti, 1998, 2003; Lucinda et al., 2006).
Jenynsia multidentata is a species with widespread distribution in Argentina (Liotta, 2005). In addition, its fossil record in the study area dates back to the Middle Pleistocene (Bogan et al., 2009). Because of these characteristics, it is a good model for phylogeographic and historical biogeographic studies, as it can provide information about the arrangement of the basins in this region before the tectonic and paleoclimatic processes determined their isolation from northern basins.
In this work we investigate the phylogeographic pattern and historical demography of Jenynsia multidentata. In addition, we analyze the relationship between this pattern and the geomorphologic and paleoclimatic history of the region, in order to test the hypotheses proposed about the ichthyofaunal population presence in the research area.
Material and Methods
Sample collections. Tissue samples were obtained from 99 Jenynsia multidentata specimens from ten localities that span the entire study area (Fig. 1). Each locality was considered as a population. Once the tissue was removed for DNA extraction, the specimens were fixed in 10% formaldehyde and kept in 70% ethyl alcohol. The tissue samples were deposited in the tissue collection of the Centro Regional de Estudios Genómicos, Universidad Nacional de La Plata, Argentina (CREG-EM tissue bank). The well-preserved specimens were deposited in the ichthyological collection of Museo Argentino de Ciencias Naturales Bernardino Rivadavia, Argentina (MACN-Ict). Voucher identification number is indicated in Table 1.
DNA extraction, amplification and sequencing. DNA was extracted following the protocol of Aljanabi et al. (2007), which consists of protein precipitation in ClNa and subsequent DNA precipitation with isopropanol.
following the alcohol purification protocol (Sambrook, et al., 1989). Amplicons were sequenced in a capillary sequencer model ABI 3100 (Macrogen Inc., korea).
Chromatograms were edited using the software Proseq (Filatov, 2002) and aligned using Clustal W (Thompson et al., 1994) with default parameters.
Genetic variation. The software ARLEQUIN 3.5 (Excoffier et al., 2010) and DNAsp 5.10 (Librado et al., 2009) were used to
estimate genetic diversity on the basis of two different parameters: haplotype diversity (h), defined as the probability that two randomly chosen haplotypes are different in the sample (Nei, 1987), and nucleotide diversity (π) defined as the probability that two randomly chosen nucleotide sites are different (Nei, 1987).
Genealogic relationships among haplotypes. To evaluate the phylogenetic relationships among mitochondrial DNA
Fig. 1. Geographical distribution of Jenynsia multidentata in the Southern Pampean area. Numbers represent sample locali-ties. 1: arroyo Chapadmalal. 2: arroyo Chocorí. 3: arroyo El Moro. 4: río Quequén Grande. 5: arroyo Cortaderas. 6: arroyo Claromecó. 7: río Quequén Salado. 8: río Sauce Grande. 9: arroyo Saladillo. 10: arroyo Sauce Chico.
Table 1. Vouchers of tissue and specimen samples. CREG: Centro Regional de Estudios Genómicos. MACN-Ict. Museo Argentino de Ciencias Naturales Bernardino Rivadavia.
Locality Coordenates CREG MACN
arroyo Chapadmalal 38°08’1.9”S 57°44’40”W
EM-1846, EM-1848, EM-1849, EM-1850, EM-1851, EM-1852, EM-1853, EM-1861,
EM-1863, EM-1871
arroyo Chocorí 38°16’11.5”S 58°09’26.8”W
EM-1001, EM-1002, EM-1003, EM-1004, EM-1005, EM-1007, EM-1009, EM-1011,
EM-1012, EM-1013
arroyo El Moro 38°25’42.1”S 58°27’44”W
EM-1730, EM-1731, EM-1736, EM-1739, EM-1743, EM-1744, EM-1745, EM-1747
río Quequén Grande 38°11’7.1”S 59°12’2.4”W
EM- 1609, EM-1612, EM-1613, EM-1616, EM-1618, EM-1621, EM-1622, EM-1623,
EM-1624, EM-1625, EM-1626
MACN-Ict 9811, MACN-Ict 9812, MACN-Ict 9813, MACN-Ict 9813
arroyo Cortaderas 38°38’16.1”S 59°12’2.4”W
EM-1081, EM-1082, EM-1083, EM-1084, EM-1086, EM-1087, EM-1088, EM-1089, EM-1090, EM-1091, EM-1094, EM-1095,
EM-1096, EM-1099
arroyo Claromecó 38°42’13.7”S 60°10’10”W
EM-1196, EM-1197, EM-1199, EM-1200, EM-1201, EM-1202, EM-1203, EM-1204,
EM-1205, EM-1206, EM-1208
río Quequén Salado 38°44’7.4”S 60°34’20.9”W
EM-1231, EM-1232, EM-1233, EM-1234, EM-1236, EM-1237, EM-1238, EM-1239
MACN-Ict 9820, MACN-Ict 9821, MACN-Ict 9822
río Sauce Grande 38°45’44.6”S 61°42’42”’’W
EM-1341, EM-1342, EM-1343, EM-1344, EM-1345
MACN-Ict 9823, MACN-Ict 9824, MACN-Ict 9825
arroyo Saladillo 38°33’42.6”’’S 62°33’3.2”W
EM-1503, EM-1504, EM-1506, EM-1508, EM-1512, EM-1513, EM-1514, EM-1515
MACN-Ict 9826, MACN-Ict 9827, MACN-Ict 9828, MACN-Ict 9829
arroyo Sauce Chico 38°29’49.9”S 62°38’45.4”W
EM-1454, EM-1456, EM-1457, EM-1458, EM-1459, EM-1460, EM-1461, EM-1462,
EM-1464
haplotypes we used both evolutionary and genetic distance methods. The software JModelTest (Posada & Buckley, 2004; Posada, 2008) was used to select the model of nucleotide substitution that best fit the data. The nucleotide substitution model was TPM3uf+G. Parameters for this model (discrete gamma distribution with six rate categories, base frequencies, and proportion of invariable sites) were estimated by optimizing the data on the trees. Indels detected by the multiple alignment produced by Clustal W were treated as missing data.
For the first approach, a Maximum Parsimony (MP) analysis was performed as implemented in PAUP* 4.0b10
(Swofford, 2002). A heuristic search with 1,000 random stepwise additions and tree bisection and reconnection (TBR) branch swapping was made. On the other hand, a Maximum likelihood (ML) was conducted in RAxML (Stamatakis et al., 2006). Node support was assessed by 1,000 bootstrap replicates using the fast bootstrapping algorithm implemented in the RAxML web-servers (Stamatakis et al., 2008).
For the second approach, an analysis based on genetic distances was made using the Neighbor-Joining method (NJ) implemented in PAUP*4.0b10. Because of, TPM3uf+G is not
a model available in PAUP, we select the GTR model, for calculating genetic distances.
Both MP and NJ methods, a 1,000 bootstrap replicates (Felsenstein, 1985) were conducted to assessed node support values by calculating the 70% Majority Rule Consensus Tree. Sequences from the Cyprinodotiformes Xiphophorus montezumae and Poecilia latipinna (GenBank acc. number: DQ445680.1 and HM567257.1 respectively) were used as outgroup to root the trees.
Because traditional methods of phylogenetic analysis have not been designed to be used at intraspecific level (Posada & Crandall, 2001), evolutionary relationships between haplotype variants were obtained by constructing a haplotype network. This was performed using the software Network 4.5.1 (http://www.fluxus-engineering.com), applying the Median-Joining algorithm (Bandelt et al., 1999).
Historical demography. Historical demography was assessed by means of neutrality tests including Fu’s Fs (Fu, 1997) and Tajima’s D (Tajima, 1989), and the R2 statistic (Ramos-Onzins & Rozas, 2002). Fu’s Fs and Tajima’s D tests evaluate departure from neutrality (mutation- genetic drift equilibrium) as expected under a demographic expansion model. Significant negative values are expected in populations that have undergone recent expansion. The R2 statistic is based on the difference between the number of singleton mutations and the mean number of nucleotide differences between sequences in a sample. The populations that have undergone large expansion are expected to exhibit low R2 values. The significance of these tests was assessed using 10,000 replicates of coalescent simulations in DNAsp (Librado et al., 2009). Additionally, a mismatch distribution analysis was performed, which are the distribution of pairwise differences among haplotypes (Slatkin & Hudson, 1991; Rogers &
Harpending, 1992). These distributions are ragged and erratic in samples from populations that have been stationary for a long time, whereas they are smooth and usually unimodal in populations that have been growing for a long time or that have experienced a single burst of population growth in the past (Harpending, 1994). To test the validity of the population expansion model of the observed mismatch distribution with respect to the expected one, a goodness of fit test was made using the sum of square deviations (SSD) and a Harpending’s Raggedness index (r) (Harpendig, 1994). These analyses were performed using the software ARLEQUIN 3.5 (Excoffier & Lischer, 2010).
Population structure. To estimate the genetic distance between populations the pairwise Φ
ST’s among localities was
calculated (Reynolds et al., 1983; Slatkin, 1995).
A description of the genetic structure was obtained by means of Analysis of Molecular Variance (AMOVA) (Excoffier et al., 1992) using the software ARLEQUIN 3.5 (Excoffier et al., 2010). For this analysis, three different settings were carried out. The first analysis included three population groups, established on the basis of the geographic location of the watercourse headwaters. These groups are the East or Tandilia (Chapadmalal, Chocorí, and El Moro streams, and Quequén Grande River), the Central or Llanura Interserrana Bonaerense (Cortaderas and Claromecó streams), and the West or Ventania (Quequén Salado River and Sauce Grande, Saladillo, and Sauce Chico streams). The second analysis, included the same three populations groups, however here were considered the lower sections of the watercourses. These groups are East or Tandilia group (Chapadmalal, Chocorí, and El Moro streams), the Central or Llanura Interserrana Bonaerense (Quequén Grande and Quequén Salado Rivers, Cortaderas and Claromecó streams), and the West or Ventania group (Sauce Grande River, Saladillo, and Sauce Chico streams). The third analysis included all populations as a unique group. Statistical significance was assessed using 10,000 permutations. A Mantel test (Mantel, 1967) was performed to test for Isolation by Distance pattern (Wright, 1943; Slatkin, 1993) by testing for correlation between geographic and genetic distances using 1,000 permutations.
Results
sites for the different analyses. The most widely distributed haplotype was found in eight populations, and it was the only one for six of them. The remaining populations presented between two and four haplotypes (Table 2).
Total haplotype diversity (h) was 0.48 +/- 0.058 while total nucleotide diversity (π) was 0.0088 +/- 0.004. Locality values are shown in Table 2.
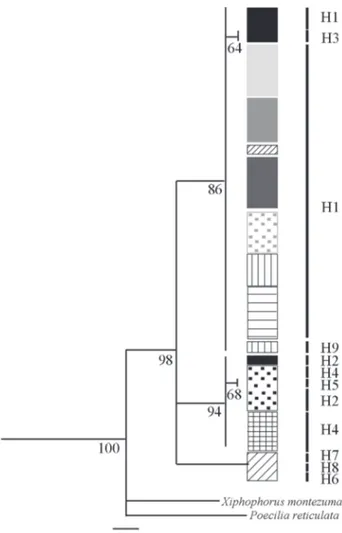
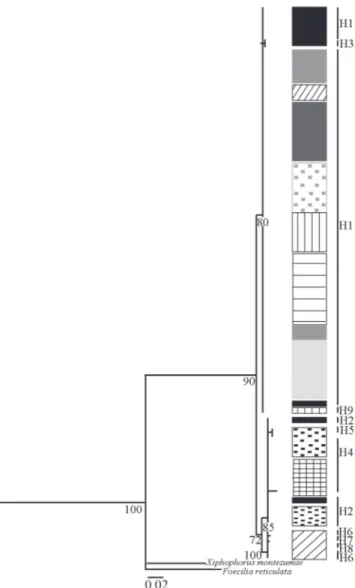
Genealogic relationships among haplotypes. Both the evolutionary method (MP and ML) and the one based on genetic distances (NJ) showed trees with similar topologies (Figs. 2-4). Three main clades (MP, ML) or clusters (NJ) were recovered with high bootstrap support values. The first clade/ cluster comprises three of the nine haplotypes found (H1, H3, H9) including the one with widest distribution (H1). The second clade/cluster includes haplotypes that occur in the East or Tandilia group (H2, H4, H5) and the third clade/cluster include haplotypes that occur in the Sauce Grande River (H6, H7, H8) which belongs to the West or Ventania group.
The haplotype network shows the same terminal groups (Fig. 5) recovered in the phylogenetic and distance trees, differentiated by several mutational steps, with high geographic concordance. The ancestral haplotype in the network is occupied by three hypothetical, closely related ancestral haplotypes. The occurrence of intermediate or hypothetical haplotypes may be explained by lack of sampling, or these may be haplotypes that have disappeared before the present.
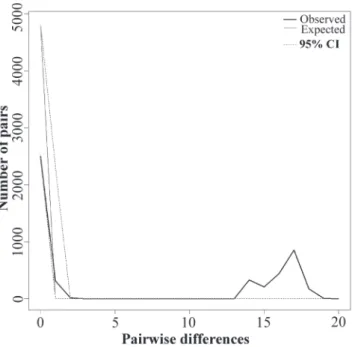
Historical demography. The mismatch distribution for the set of samples showed an erratic curve (Fig. 6). Although Harpending’s Raggedness index (r) was high though not significant (0.24 P = 0.97), the high and significant SSD value (0.28 P = 0.0001) demonstrates that the data do not fit a model of population expansion. The R2 index was high but not significant (0.11 P = 0.81). Regarding the neutrality tests, both Tajima’s D and Fu’s Fs were positive and non-significant (0.71 P = 0.81 and 5.23 P = 0.94 respectively). The values for each population are provided in Table 3.
Table 2. Genetic diversity of Jenynsia multidentata in the Southern Pampean area. N = number of individuals. S = num-ber of polymorphic sites. NH = numnum-ber of haplotypes. h±SD = haplotype diversity ± standard deviation. π ± SD = nucle-otide diversity ± standard deviation. - Not estimated.
Locality N S NH h±SD π±SD
Chapadmalal 11 17 3 0.58-0.14 0.007-0.0042 Chocorí 10 2 3 0.70-0.086 0.001-0.0009
El Moro 8 - 1 - -
Quequén Grande 11 - 1 - -
Cortaderas 13 - 1 - -
Claromecó 11 - 1 - -
Quequén Salado 9 - 1 - -
Sauce Grande 9 16 4 75-0.11 0.0096-0.0056
Saladillo 8 2 2 0.25-0.18 0.0003-0.0001
Sauce Chico 9 - 1 - -
Total 99 22 9 0.48-0.058 0.0088-0.0046
Fig. 2. Phylogenetic strict consensus tree obtained by Maximun Parsimony based on mitochondrial DNA control region of Jenynsia multidentata. Numbers under the nodes represents the Bootstrap values. The length branches are proportional to mutations per site. H1-H9: Haplotypes. Black vertical lines next to sample localities are proportional to the individual numbers in each locality. Shading patterns indi-cates localities. Black: Chapadmalal. Black doted: Chocorí. Cross: El Moro. Dark grey: Quequén Grande. Horizontal lines: Cortaderas. Light grey: Claromecó. Grey: Quequén Salado. Diagonal lines: Sauce Grande. Vertical lines: Saladillo. Grey doted: Sauce Chico.
Population structure. The genetic differentiation between population pairs, measured as pairwise Φ
ST’s, showed that
the highest significant values are those between the East basins (Tandilia group), with respect to the remaining populations. It is worth to note that in the Tandilia group the population from El Moro stream, showed the highest differentiationwith values between 0.37 and 1. The values for each population are presented in figure 7. The value of the fixation index Φ
STfor all populations was 0.56 (P<0.001). These
populations within groups (50.11%), while 43.14% of the variance was distributed within populations, and 6.75 % between groups. The fixation indices Φ
ST, ΦCT and ΦSC were
0.56 (P<0.001), 0.067 (P = 0.22) and 0.53 (P<0.001) respectively. The high and significant value of Φ
SC shown differentiation at
population level within groups. The variance among groups defined by the Φ
CT was not significant.
The analysis considering the lower sections of watercourses, shown that most of the variance was explained among groups (45.52 %), while the 37.82 % among populations between groups, and the 16.66 % within populations. The fixation indices Φ
ST, ΦCT
and Φ
SC were 0.83 (P<0.001), 0.45 (P = 0.14) and 0.69 (P<0.001)
respectively. By considering this grouping, the fixation indices support evidence of strong genetic structure among groups.
The AMOVA considering a unique group showed an 80.92 % of the variance among populations and a 19.08 % into populations. The Φ
ST was 0.80 (P< 0.0001).
The Mantel test yielded a coefficient of correlation r= 0.037 (P= 0.86) that evidences that the populations do not fit a model of Isolation by Distance (Fig. 8).
Discussion
Although the overall analysis of the results of this work supports the affirmation that the populations of Jenynsia
Fig. 3. Phylogenetic consensus tree obtained by Maximum Likelihood based on DNA control region of Jenynsia multidentata. Numbers under the nodes represents the Boot-strap values. The length branches are proportional to muta-tions per site. H1-H9: Haplotypes. Black vertical lines next to sample localities are proportional to the individual numbers in each locality. Shading patterns indicates localities. Black: Chapadmalal. Black doted: Chocorí. Cross: El Moro. Dark grey: Quequén Grande. Horizontal lines: Cortaderas. Light grey: Claromecó. Grey: Quequén Salado. Diagonal lines: Sauce Grande. Vertical lines: Saladillo. Grey doted: Sauce Chico.
Grande and Saladillo in the West), whereas the remaining populations are represented by a single haplotype and thus it is not possible to estimate genetic diversity values for them. Unquestionably, the settlement and persistence of the species in this area are part of a complex scenario that cannot be explained only by a single demographic event. Such demographic events were associated with major climatic and geological changes that has been affected the study area during the Late Pleistocene and Holocene.
The decrease of sea level during the last glacial maximum (22,000 calibrated years BP, Ponce et al., 2011) produced a great eastward expansion of the coastal line, prompting changes in the distribution of rivers and the integration of the drainage network. In this sense, the Sauce Grande River could have been part of the Colorado River basin during the Pleistocene (Ponce et al., 2011). These
Fig. 5. Median-Joining haplotype network of Jenynsia multidentata. Circle sizes are proportional to haplotype fre-quencies. The crossed marks are nucleotide substitutions inferred in that branch. Shading patterns indicates localities. Black: Chapadmalal. Black doted: Chocorí. Cross: El Moro. Dark grey: Quequén Grande. Horizontal lines: Cortaderas. Light grey: Claromecó. Grey: Quequén Salado. Diagonal lines: Sauce Grande. Vertical lines: Saladillo. Grey doted: Sauce Chico. White circles represent hypothetical haplotypes.
Fig. 6. Mismatch distribution of mitochondrial DNA control region for Jenynsia multidentata. Thick line: observed distri-bution. Fine line: expected distribution under a sudden popu-lation expansion model. The dashed line represents confi-dence interval at 95%.
Table 3. Historical demography of Jenynsia multidentata. D´T= Tajima’s D. Fs’Fu= Fu’s Fs. R2=R2 statistic. r= Harpending’s Raggedness index. SSD = Sum of square deviations. P = probability < 0,05. - Not estimated.
Locality D’T (P) Fs’Fu (P) R2 (P) r (P) SSD (P) Chapadmalal -0.18 (0.45) 1.20 (0.90) 0.16 (0.56) 0.19 (0.57) 0.09 (0.22) Chocorí 0.83 (0.81) 0.25 (0.52) 0.22 (0.67) 0.030 (0.27) 0.21 (0.25)
El Moro - - - - -
Quequén Grande - - - - -
Cortaderas - - -
Claromecó - - -
Quequén Salado - - - - -
Sauce Grande 1.20 (0.90) 3.37 (0.94) 0.33 (1.00) 0.20 (0.33) 0.17 (0.11) Saladillo -1.05 (0.17) -0.18 (0.43) 0.21 (0.87) 0.31 (0.40) 0.27 (0.08)
Sauce Chico - - - - -
Total 0.71 (0.80) 5.23 (0.94) 0.11 (0.81) 0.24 (0.97) 0.28 (0.0001)
multidentata are under demographic equilibrium and show strong population differentiation, these results should be interpreted with caution. It is evident that not all the populations show the same pattern.
authors found fossil evidences of Percichthys sp. for the middle Pleistocene in the southern Pampean area and note that the entrance path for its settlement was through these paleoconnections between different basins while the sea level was below the current costal line, probably during the Pleistocene. This suggests that Jenynsia multidentata became settled in the area at a similar time, achieving wide distribution in the region thanks to the at least partial integration of the drainage network. Indeed, fossil evidence in the area demonstrates the presence of Jenynsia sp. at the locality Centinela del Mar during the middle-late Pleistocene (Bogan et al., 2009); likewise, scales from Cyprinodontiformes have been reported for the Holocene from Napostá stream (Quattrocchio et al., 1998).
The stratigraphic analysis of Quaternary alluvial terraces associated with the main water courses that drain the mountainous area indicate that their activity has been highly discontinuous throughout their geologic history. Thus, although these rivers are the major agent for valley excavation, their fill sediments indicate that they would have remained dry during long periods of their evolution (Zavala et al., 2005). These adverse climatic and geologic conditions could have led to local extinctions, and the survival of some populations in those water courses that remained active during those climate fluctuations.
Given such a scenario, it is possible that the populations of Jenynsia multidentata that are currently structured could have inhabited environments that remained active throughout their evolution. These populations could have achieved population differentiation without or with only restricted gene flow, in a partially disintegrated drainage network resulting from the deactivation of some water beds.
These findings are consistent with idea that, the fishes were present in the area before last glacial period and resisted unfavorable climates (hypothesis 1, see introduction).
For the Pleistocene, the area has been described as having wide flood plains in an arid-semiarid environment (Zavala & Navarro, 1993; Quattrocchio et al., 1993, 1998; Aramayo et al., 2002). Around 9,000 calibrated years BP, with the beginning of the Holocene and improved climate conditions, these wide flood plains were occupied by interconnected lakes (Aramayo et al., 2002) and anastomosing river systems (Quattrocchio 1998). These interconnected systems could have acted as the dispersal route by means of which a few populations, colonizing most of the area. This situation is reflected in the lack of fit to an Isolation-by-Distance model, expected in populations that have recently colonized the area that they occupy (Slatkin, 1993). Thus, we find populations that possibly remained in the area under adverse climate conditions in environmental refuges, such as the oldest water courses.
Later on, and due to more favorable climate conditions, they may have undergone demographic expansion with subsequent colonization of the area, as a consequence of the formation of a modern hydrographic system. Evidence for this fact is the presence of a single haplotype widely distributed in the area. This situation could be supporting the second hypothesis about the species occurrence in the area. In fact, the age of some portions of the Sauce Grande River has been dated as Late Pleistocene-Holocene, while other water courses such as the Sauce Chico stream are 4,400 years old (Prieto, 1996; Quattrocchio et al., 2008).
To sum up, the presence of Jenynsia multidentata in the area is the result of independent but complementary demographic processes together with the geologic evolution of the area. In this sense we found support for hypotheses 1and 2 that could account for the presence of the species in the southern Pampean area
Fig. 7. Population relationships described by Φ
ST computed
between pairs of populations inferred from mitochondrial DNA control region of Jenynsia multidentata.
Acknowledgments
The authors thank Dr. Fernando Mapelli for assistance in field trip. Marcos Cenizo for geological information. Gabriel Cudazzo Trillo and Pablo Bruno, for the help with figures. Patricio Solimano for critical review of the manuscript. Consejo Nacional de Investigaciones Científicas y Técnicas (CONICET) and Comisión de Investigaciones Científicas de la provincia de Buenos Aires (CIC) for financial support.
Literature Cited
Aguirre, M. L. & E. A. Farinati. 1999. Paleobiogeografía de las faunas de moluscos marinos del Neógeno y Cuaternario del Atlántico sudoccidental. Revista de la Sociedad Geológica de España, 12: 93-112.
Aljanabi, S. M. & I. Martínez .1997. Universal and rapid salt-extraction of high quality genomic DNA for PCRbased techniques. Nucleic Acids Research, 25: 4692-4693.
Almirón, A., M. Azpelicueta, J. Casciotta & A. López Cazorla. 1997. Ichthyogeographic boundary between the Brazilian and Austral subregions in South America, Argentina. Biogeographica, 73: 23-30.
Aramayo, S. A., R. A. Schillizi & B. M. Gutierrez Téllez. 2002. Evolución paleoambiental del cuaternario en la costa Atlántica del sur de la provincia de Buenos Aires, Argentina. Revista de la Sociedad Geológica de España, 15: 95-104.
Arratia, G., M. Peñafort & S. Menu-Marque. 1983. Peces de la región sureste de los Andes y sus probables relaciones biogeográficas actuales. Deserta, 7: 48-107.
Bandelt, H-J., P. Forster & A. Röhl. 1999. Median-Joining networks for inferring intraspecific phylogenies. Molecular Biology and Evolution, 16: 37-48.
Bogan, S., M. L. de los Reyes & M. M. Cenizo .2009. Primer registro del género Jenynsia Günther, 1866 (Teleostei:Cyprinodontiformes) en el Pleistoceno Medio tardío de la provincia de Buenos Aires (Argentina). Papéis Avulsos de Zoologia, 49: 81-86.
Casciotta, J., A. Almirón, A. Cione & M. Azpelicueta. 1999. Brazilian freshwater fish assemblages from southern Pampean area, Argentina. Biogeographica, 75: 67-78.
Cione, A. & M. Barla. 1997. A new locality for the synbranchid eel
Synbranchus marmoratus (Teleostei: Percomorpha) in southern Buenos Aires Province, Argentina. Neotropica, 43: 113-115. Excoffier, L. & H. E. L. Lischer. 2010. Arlequin suite ver 3.5: a new
series of programs to perform population genetics analyses under Linux and Windows. Molecular Ecology Resources, 10: 564-567.
Excoffier, L., P. Smouse & J. Quattro. 1992. Analysis of molecular variance inferred from metric distances among DNA haplotypes: Application to human mitochondrial DNA restriction data. Genetics, 131: 479-491.
Felsenstein, J. 1985. Confidence limits on phylogenies: An approach using the bootstrap. Evolution, 39: 783-791.
Fidalgo, F., F. O. De Francesco & R. Pascual. 1975. Geología superficial de la llanura bonaerense. Pp. 103-138. In: Relatorio del VI Congreso Geológico de Argentina, Bahía Blanca, Argentina.
Filatov, D. A. 2002. ProSeq: A software for preparation and evolutionary analysis of DNA sequence data sets. Molecular Ecology Notes, 2: 621-624.
Fu, Y. X. 1997. Statistical test of neutrality of mutations against population growth, hitchhiking and background selection. Genetics, 147: 915-925.
Frenguelli, J. 1956. Rasgos generales de la hidrografía de la provincia de Buenos Aires. LEMIT, 62: 1-19.
Ghedotti, M. J. 1998. Phylogeny and classification of the Anablepidae (Teleostei, Cyprinodontiformes). Pp. 561-582. In: Malabarba, L. R., R. E. Reis, R. P. Vari, Z. M. S. Lucena & C. A. S. Lucena (Eds.). Phylogeny and Classification of Neotropical Fishes. Porto Alegre, Edipucrs.
Ghedotti, M. J. 2003. Family Anablepidae (Four-eyed fishes, one sided livebearers and the white eye), Pp. 582-585. In: Reis, R. E., S. O. Kullander & C. J. Ferraris, JR. (Eds.). Check List of the Freshwater Fishes of South and Central America, Porto Alegre, Edipucrs.
Gutiérrez-Rodríguez, C., M. R. Morris, N. S. Dubois & K. de Queiroz. 2007. Genetic variation and phylogeography of the swordtail fish Xiphophorus cortezi (Cyprinodontiformes, Poeciliidae). Molecular Phylogenetics and Evolution, 43: 111-123.
Harpending, R. C. 1994. Signature of ancient population growth in a low-resolution mitochondrial DNA mismatch distribution. Human Biology, 66: 591-600.
Johnson, J. B. 2001. Hierarchical organization of genetic variation in the Costa Rican livebearing fish Brachyrhaphisrhabdophora
(Poeciliidae). Biological Journal of the Linnean Society, 72: 519-527.
Lee, W-J., J. Conroy, W. H. Howell & T. D. Kocher. 1995. Structure and evolution of teleost mitochondrial control regions. Journal of Molecular Evolution, 41: 54-66.
Librado, P. & J. Rozas. 2009. DNAsp v 5. A software for comprehensive analysis of DNA polimorphism data. Bioinformatics, 25: 1451-1452.
Liotta, J. 2005. Distribución geográfica de los peces de aguas continentales de la República Argentina. ProBiota. FCNyM, UNLP. Eds. Serie Documentos Nº 3, La Plata, Argentina. Llambias, E. & C. Prozzi. 1975. Ventania. Pp. 79-101. In: Relatorio
del VI Congreso Geológico de Argentina, Bahía Blanca, Argentina.
Lucinda, P. H. F., M. J. Ghedotti & W. J.Graca. 2006. A New
Jenynsia Species (Teleostei, Cyprinodontiformes, Anablepidae) from Southern Brazil and its Phylogenetic Position. Copeia, 2006: 613-622.
Lundberg, J. G., L. G. Marshall, J. Guerrero, B. Horton, M. C. Malabarba & F. Wesselingh. 1998. The Stage for Neotropical Fish Diversification: A History of Tropical South American Rivers. Pp. 13-48. In: Malabarba, L. R., R. E. Reis, R. P. Vari, Z. M. S. Lucena & C. A. S. Lucena (Eds.). Phylogeny and Classification of Neotropical Fishes. Porto Alegre, Edipucrs. Mantel, N. 1967. The detection of disease clustering and a generalized
regression approaches. Cancer Research, 27: 209-220. Nabel, P. E., A. Cione & E. P. Tonni. 2000. Environmental changes
in the Pampean area of Argentina at the Matuyama-Brunhes (C1r-C1n) Chrons boundary. Palaeogeography, Palaeoclimatology, Palaeoecology, 162: 403-412.
Nei, M. 1987. Molecular Evolutionary Genetics. Columbia University Press, New York.
Posada, D. 2008. jModelTest: Phylogenetic Model Averaging. Molecular Biology and Evolution, 25: 1253-1256.
Posada, D. & T. R. Buckley. 2004. Model selection and model averaging in phylogenetics: advantages of Akaike Information Criterium and Bayesian approaches over likelihood ratio test. Systematic Biology, 53: 793-808.
Posada, D. & K. A. Crandall. 2001. Intraspecific gene genealogies: trees grafting into Networks. Trends in Ecology and Evolution, 16: 35-45.
Prieto, A. R. 1996. Late Quaternary vegetational and climatic changes in the Pampa grasslands of Argentina. Quaternary Research, 4: 73-88.
Quattrocchio, M. E., A. B. Borromei, C. M. Deschamps, S. C. Grill & C. A. Zavala. 2008. Landscape evolution and climate changes in the Late Pleistocene-Holocene, southern Pampa (Argentina): Evidence from palynology, mammals and sedimentology. Quaternary International, 181: 123-138.
Quattrocchio, M., C. Deschamps, C. Zavala, A. Borromei, S. Grill & G. R. Guerstein. 1993. Cuaternario del sur de la Provincia de Buenos Aires. Estratigrafía e inferencias paleoambientales. Pp. 22-34. In: Iriondo, M. (Ed.). Quaternario de America del Sur. Holoceno. CADINQUA.
Quattrocchio, M. E., S. C. Grill & C. A. Zavala. 1998. Chronostratigraphic and palynozone chronosequences charts of Nepostá Grande Creek, southwestern Buenos Aires Province, Argentina. Quaterernary of South America and Antartic Penninsula, 11: 111-133.
Ramos-Onsins, S. E. & J. Rozas. 2002. Statistical properties of new neutrality tests against population growth. Molecular Biology and Evolution, 19: 2092-2100.
Reis, R. E. 2003. Family Callichthyidae. Pp. 291-309. In: Reis, R. E., S. O. Kullander & C. J. Ferraris Jr. (Eds.). Check list of the freshwater fishes of South and Central America. Porto Alegre, Edipucrs.
Reis, R. E., S. O. Kullander & C. J. Ferraris Jr. (Orgs.). 2003.Check List of the Freshwater Fishes of South and Central America. Porto Alegre, Edipucrs.
Reynolds, J., B. S. Weir & C. C. Cockerham. 1983. Estimation for the coancestry coefficient: basis for a short-term genetic distance. Genetics, 105: 767-779.
Ribeiro, A. C. 2006. Tectonic history and the biogeography of the freshwater fishes from the coastal drainages of eastern Brazil: an example of faunal evolution associated with a divergent continental margin. Neotropical Ichthyology, 4: 225-246. Ringuelet, R. A. 1975. Zoogeografía y ecología de los peces de aguas
continentales de la Argentina y consideraciones sobre las áreas ictiológicas de América del Sur. Ecosur, 2: 1-122.
Rogers, A. R. & H. Harpending. 1992. Population growth makes waves in the distribution of pairwise genetic differences. Molecular Biology and Evolution, 9: 552-569.
Rolleri, E. 1975. Provincias geológicas bonaerenses. Pp. 29-53. In: Relatorio del VI Congreso Geológico de Argentina, Bahía Blanca, Argentina.
Sambrook, J., E. F. Fritsch & T. Maniatis. 1989. Molecular cloning: a laboratory manual. Second edition. Cold Spring Harbor Laboratory Press. Cold Spring Harbour, NY, USA.
Schaefer, S. A. 1998. Conflict and resolution: impact of new taxa on phylogenetic studies of the Neotropical cascudinhos (Siluroidei: Loricariidae). Pp. 375-400. In: Malabarba, L., R. E. Reis, R. P Vari, Z. M. S. Lucena & C. A. S. Lucena (Eds.). Phylogeny and Classification of Neotropical fishes. Porto Alegre, Edipucrs.
Slatkin, M. & R. R. Hudson. 1991. Pairwise comparisons of Mitochondrial DNA sequence in stable and exponentially growing populations. Genetics, 129: 555-562.
Slatkin, M. 1993. Isolation by distance in equilibrium and non-equilibrium populations. Evolution, 47: 264-279.
Slatkin, M. 1995. A measure of population subdivision based on microsatellite allele frequencies. Genetics, 139: 457-462. Stamatakis, A. 2006. RAxML-VI-HPC: Maximum Likelihood-based
phylogenetic analyses with thousands of taxa and mixed models. Bioinformatics, 22: 2688-2690.
Stamatakis, A., P. Hoover & J. Rougemont. 2008. A rapid Bootstrap algorithm for the RAxML web-servers. Systematic Biology, 75: 758-771.
Swofford, D. L. 2002. PAUP*: Phylogenetic analysis using parsimony (and other methods). Version 4. Sinauer Associates, Sunderland, Massachusetts.
Tajima, F. 1989. Statistical method for testing the neutral mutation hypothesis by DNA polymorphism. Genetics, 123: 585-595. Thompson, J. D., D. G. Higgins & T. J. Gibson. 1994. CLUSTAL W: improving the sensitivity of progressive multiple sequence alignment through sequence weighting, position-specific gap penalties and weight matrix choice. Nucleic Acids Research, 22: 4673-80.
Tonni, E. P. & A. L. Cionne. 1997. Did the Argentine Pampean ecosystem exist in the Pleistocene? Current Research in the Pleistocene, 14: 131-133.
Tonni, E. P., A. L. Cione & A. J. Figini. 1999. Predominance of arid climates indicated by mammals in the pampas of Argentina Turing the Late Pleistocene and Holocene. Palaeogeography, Palaeoclimatology, Palaeoecology, 147: 257-281.
Uliana, M. A. & K. T. Biddle. 1988. Mesozoic-Cenozoic palegeographic and geodynamic evolution of southern South America. Revista Brasileira de Geociencias, 18: 172-190. Vari, R. P. & L. R. Malabarba. 1998. Neotropical Ichthyology: An
Overview. Pp. 1-11. In: Malabarba, L. R., R. E. Reis, R. P. Vari, Z. M. S. Lucena & C. A. S. Lucena (Eds.). Phylogeny and classification of Neotropical fishes. Porto Alegre, Edipurcs. Wright, S. 1943. Isolation by Distance. Genetics, 2: 14-38. Yrigoyen, M. 1975. Geología del subsuelo y plataforma continental.
Pp. 139-168. In: Relatorio del VI Congreso Geológico de Argentina, Bahía Blanca, Argentina.
Zambrano, J. J. 1980. Comarca de la Cuenca cretácica del Colorado. Pp. 139-168. In: II Simposio Geológico de Argentina, Bahía Blanca, Argentina.
Zavala, C., L. García & M. Di Meglio. 2005. Redes de drenaje y paleoclimas en el Cuaternario del sur de la provincia de Buenos Aires. XVI Congreso Geológico Argentino, CD-ROM, Artículo Nº 156. 2pp. La Plata.
Zavala, C. & E. Navarro. 1993. Depósitos fluviales en la Formación Monte Hermoso (Plioceno inferior-medio). Provincia de Buenos Aires. Pp. 236-244. In: XII Congreso Geológico Argentino y II Congreso de Exploración de Hidrocarburos. Mendoza, Argentina.