Impact of the Qualitative and Quantitative Aspects of Human Activity
on the Ecosystem: Demonstration through the Use of Ecological
Footprint Approach
Makram GAALICHE
Department of Economics, Higher Institute of Management of Sousse, Tunisia [email protected]
Abstract
This article aims to show that the impact of human activities on the ecosystem, measured by the Ecological Footprint, depends on the qualitative and quantitative aspects of the population. Indeed, we confirmed our hypothesis by an empirical analysis on Tunisia, where it was revealed that the increase in its Ecological Footprint, is attributed mainly to massive consumption of goods, bad land management by building horizontal, and to a lesser extent, to the presence of polluting employments. The results suggest the adoption of targeted policies, according to the specific characteristics of population.
Keywords: ecological footprint, biocapacity, qualitative effect, quantitative effect, environment, Tunisia
JEL Classification: C13, Q26, Q51
1. Introduction
The interest granted to the impact of human activities on ecosystems and the planet, has led to the creation of the Ecological Footprint Indicator (EFI). Several definitions of this concept exist, all based on the needs required for an individual, converted in equivalent area in hectares (Kitzes et al, 2008). Indeed, this indicator provides an assessment of the
environmental pressures associated with human activities at all scales (Van, 2005). It is usually measured in surface: hectares per person or hectares consumed by a city or a country). This indicator quantifies, through a system conversion, an amount of resources of bioproductive area, needed to produce the resources consumed by the population and to absorb its wastes (WWF, 2006). This metaphorical surface is virtual, but it reflects a very concrete reality. Indeed, in a world where the population grows, the more the ecological footprint is important, the more we move away from the environmental sustainability.
Vol. 4♦Issue 2♦2012
ecological footprint in Tunisia depends both on the standard of living of the population considered, and on other qualitative elements.
In this case, we identify in a first step the concept of ecological footprint, while analyzing that of Tunisia. Then, on the basis of a battery of indicator, we try to identify the various determinants of ecological footprint of Tunisia. The analysis will be applied to the different Tunisian regions namely: the Greater-Tunis, North-East, North-West, West-Center, East-West-Center, South-East and South-West.
2. Ecological Footprint and Biocapacity: Definition and Analysis
At the Rio Conference (Earth Summit) in 1992, Professor William Rees suggests for the first time, in his article "Ecological footprints and Appropriated carrying capacity: what urban economics leaves out" the term of ecological footprint. Then, the term has been developed in a doctoral dissertation of Mathis Wackernagel, in collaboration with his teacher William Rees, who subsequently published in 1996 a book entitled "Our Ecological Footprint: Reducing Human Impact on the Earth" in which they refined the concept and calculation method. This book is translated into French in 1999 under the title “Our Ecological Footprint”. Several definitions referring to this concept have been proposed. Rees (1992) defines the ecological footprint as, the surface of productive land and aquatic ecosystems, required to produce the resources used and waste assimilation released, by a defined population. For Fudge and Rowe (1996), it is the necessary geographical surface to meet the needs of a city and absorb its waste.
In all cases, the ecological footprint is used to measure the pressure exerted by the human on the planet, and to make an ecological bilan by comparing the demand and supply of renewable natural resources. Generally, it is a comparison between the ecological footprint and the supply of natural resources, i.e., the biocapacity, which corresponds to the capacity of ecosystems to provide resources to the limit of their capacity of regeneration (WWE, 2006). Indeed, an ecological footprint of a population that exceeds the biocapacity of their surface indicates an ecological deficit, i.e., an unsustainable consumption.
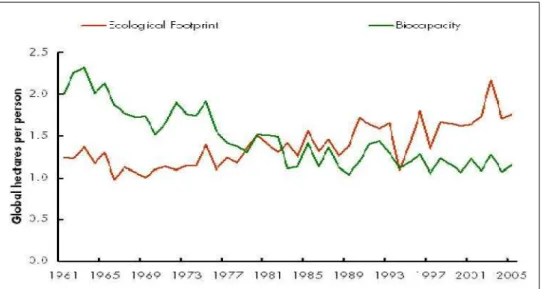
In Tunisia it was found that the ecological footprint per person is characterized by a growing trend throughout the period (1961-2005), and this against a downward trend concerning biocapacity of space available (see Figure 1). It is mainly from the 1980s, which its ecological footprint begins to exceed the biologically productive area, and whose gap does not cease to widen. In other words, the Tunisian person overexploits the available resources of its environment.
Admittedly, the ecological footprint is built by focusing only on biologically productive areas. Indeed, six soil types are considered, namely (Ewing et al, 2008): arable land,
to the capacity of their ava offerings.
Figure 1: Ecologic per capita (1961-2005
Source: Global Footprin
So, we can conclude that without giving them the t that the Tunisian population the sustainability. Thus, ana Tunisian people, on the conduc main sources of ecological
Table 1: Evolution Tunisia in global h
Total
Ecological Footprint 1.8
Biocapacity 1.1
Source: Global Footprin
3. The Ecologica
On the basis of a battery ecological footprint in Tuni effects. The analysis will Tunis, North-east, North-W Firstly, basing on the assum bioproductive to its geogra
vailable space, i.e., the use of these surfaces doe
ogical Footprint and biocapacity of Tunisia i 1961-2005)
tprint Network (2007)
hat Tunisia is in the process of depleting its he time necessary for their regeneration. Such
tion puts pressure on its environment, which m hus, analyzing the effect of behaviours and attitude
conduct of ecological footprint, is an important cal deficit.
ion of the Ecological Footprint and biocapaci al hectares per capita for the year 2005
al Arable
Land Pastures Forests
Fishing Ground
0.78 0.10 0.18 0.09
0.71 0.10 0.02 0.28
tprint Network (2007)
gical Footprint between Level and Qua
ry of indicators, we try to explain the causes Tunisia, that is to say, he is the result of a lev ill be applied on the various regions of Tunisia
h-West, Central-West, Central-East, South-East assumption of proportionality of the surfac graphic area, we constructed a proxy of EE in ea
does not exceed their
sia in global hectares
its natural resources, h an overuse proves h moves it away, from udes attributed to the tant task to detect the
acity components of
Carbon Built Land
0.57 0.05
* 0.05
Quality Effects
Vol. 4♦Issue 2♦2012
Indeed, we will weigh the bioproductive surface of Tunisia by the surface proportion of each Tunisian region of the overall surface, for having a proxy of the bioproductive surface of different regions. Then we divided the bioproductive surface of each region by the number of its population for obtaining a proxy of ecological footprint per capita of each region. Subsequently, we regress the footprint of each region of Tunisia by all of the following variables:
Variable of Level:
• Level of Consumption (LC): Apprehended by the share of monetary expenditures for consumption of goods of the total consumption by region and person. This indicator allows us to detect the level effect on ecological footprint . In fact, more the population of the region is a consuming population, and thus very exploiter of its agricultural surface, more its ecological footprint will be important.
Variable of quality:
• Quality of Population (QP): Apprehended by the academic scholarisation rate. Indeed, when the person is educated, and therefore generally conscious of the environmental problem, he will has a rational behaviour on his ecological footprint.
• Quality of employments (QE): Percentage of the population by region, which employed in sectors likely to pollute and degrade the environment (mining, Buildings and Public Works ...). Generally, more the jobs in the region are qualified of pollutants, the more their ecological footprint will be important. • Quality of Habitat (QH): Apprehended by the percentage of houses by region not
belonging to buildings. This indicator allows us to capture the impact of horizontal buildings that destroy the surface of land on the ecological footprint. All data are derived from different surveys of the National Institute of Statistics (INS) in Tunisia and from the Global Footprint Network (GFN). Thus, we estimate the following model:
= + + QE+ QH+ QP+
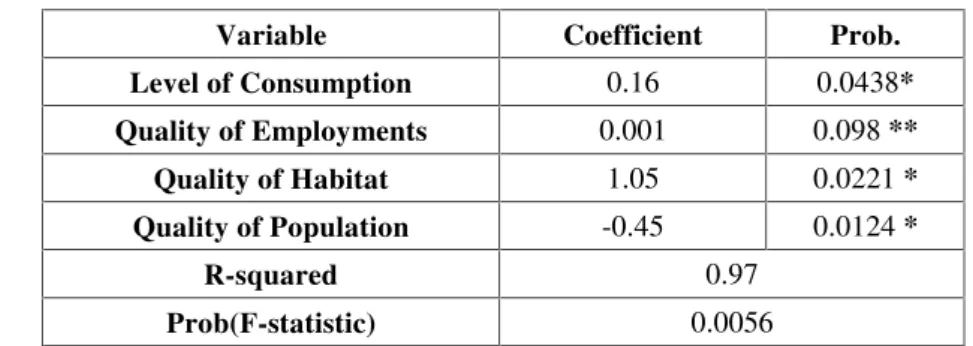
The main estimation results by Eviews software are displayed inTable 2.
Table 2: Main results of estimation
Variable Coefficient Prob.
Level of Consumption 0.16 0.0438*
Quality of Employments 0.001 0.098**
Quality of Habitat 1.05 0.0221*
Quality of Population -0.45 0.0124*
R-squared 0.97
Prob(F-statistic) 0.0056
Source: Own estimation.
*=Significant variable at α = 5%; ** =Significant variable at α = 10%
increase of 1.05% of the ecological footprint of population. In addition, the 1% increase in the level of consumption of the population, synonymous with an increase in the use of agricultural land, it leads to an increase in ecological footprint of 0.16%. For employments that cause pollution, it turned out that they lead to swelling of the ecological footprint, but with low proportions, so that any 1% increase in the proportion of the population employed in polluting activities, an increase of the footprint of 0.001% is observed. The estimate also reveals that the increase of 1% of the educated population leads to a reduction in the footprint of 0.45%. In other words, the more the number of educated people is important, the more the behaviour will be rational, and the ecological footprint will be reduced.
Following this analysis, we can affirm that the exploitation of environmental resources in Tunisian regions, is the combination of the level and quality effects of the Tunisian population. Indeed, such environmental degradation is attributed primarily to massive a consumption of goods, bad land management by building horizontal and to a lesser extent, to the presence of the polluting employments. But the awareness of the educated population of environmental issues causes a rational behaviour for a footprint reduction. In this case, the level of ecological footprint is conditioned by the aspects, both qualitative and quantitative of the corresponding population. For this reason, and in order to better control the ecological footprint of any population, regional policies should be recommended and targeted according to the specificities of each region. This will be the object of an analysis applied to the Tunisian case.
4. The Control of the Ecological Footprint: The Political Targeting
In order to rationalize the use of natural resources, Tunisia should envisage appropriate policies to every one of its region. In other words, it should detect for each region, the main sources responsible of the swelling of their ecological footprint, whereby the policies will be shaped. For this reason, we use the techniques of data analysis, more specifically, the Principal Component Analysis (PCA). This technique will allow us to regroup the areas characterized by a common behavior with the components of their ecological footprints. Indeed, the investigations carried out allowed us to obtain a graphical representation of the points cloud of the individuals (7 regions), and this following the selected axes (Figure 2).
Vol. 4♦Issue 2♦2012
Figure 2: The points cloud of the individuals along the principal axes
Source: Own estimation
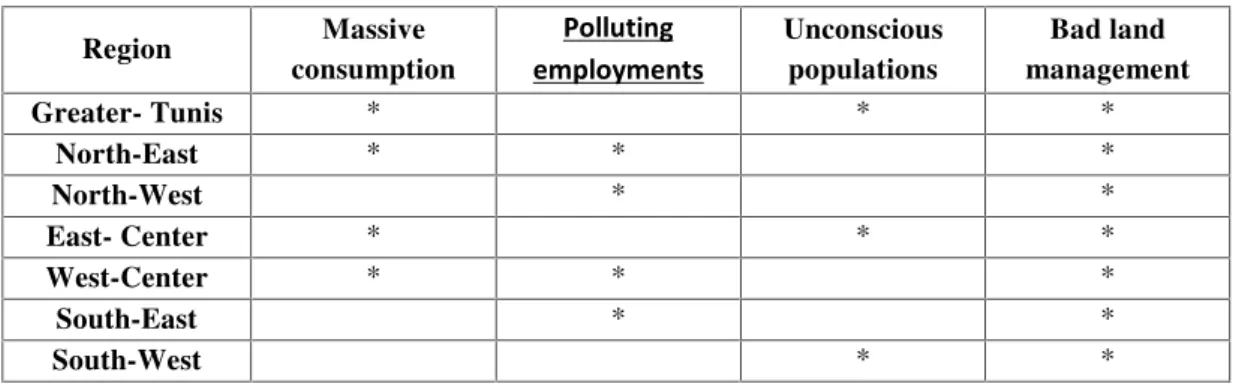
Table 3: Identification of the main application areas of policies by region.
Source: Own investigations from Figure 2.
5. Conclusion
By an application to the case of Tunisia, it turned out that the ecological footprint of a population is influenced by qualitative and quantitative determinants relating to the population considered. Indeed, the study of ecological footprint in Tunisia reveals that the latter suffers from an ecological deficit. Such overexploitation of its natural resources proved to be the result of a massive consumption of goods and, on the other hand, assigned to negative qualities namely: mismanagement of the territory by building horizontal and the presence of polluting employments. However, Tunisia should master such an abuse of its ecosystem, by developing policies taking into account the specificity of each region, in order to compression its footprint.
Region Massive
consumption
Polluting employments
Unconscious populations
Bad land management
Greater- Tunis * * *
North-East * * *
North-West * *
East- Center * * *
West-Center * * *
South-East * *
South-West * *
LC
QP 0 QE
QH
Axis 1
2 1
0 -1
-2
Axis 2
1
0
-1
-2 GT
NE
NW EC
WC
References:
Ewing, B., Reed, A., Rizk, S., Galli, A., Wackernagel, M. and J. Kitzes (2008): Calculation Methodology for the National Footprint Accounts, 2008 Edition, Global Footprint Network, USA.
Fudge, C. and J. Rowe (1996): Ecological modernisation as a framework for sustainable development: a case study in Sweden, SAIS Review, Vol. 16, No. 2 / Summer-Fall.
Global Footprint Network (2007): National Ecological Footprint and Biocapacity Account –
Tunisie, spreadsheet v2.57.
Institut National de la Statistique (2006):Recensement Général de la Population et d’Habitat de
2004: Région du Nord Est, Tunisia.
Institut National de la Statistique (2006):Recensement Général de la Population et d’Habitat de
2004: Région du Nord Ouest, Tunisia.
Institut National de la Statistique (2006):Recensement Général de la Population et d’Habitat de
2004: Région du Centre Est, Tunisia.
Institut National de la Statistique (2006):Recensement Général de la Population et d’Habitat de
2004: Région du Centre Ouest, Tunisia.
Institut National de la Statistique (2006):Recensement Général de la Population et d’Habitat de
2004: Région du Sud, Tunisia.
Institut National de la Statistique (2007):Enquête nationale sur le budget, la consommation et le niveau de vie des ménages -2005, Volume A, Tunisia.
Kitzes, J., Galli, A., Rizk, S.M., Reed, A. and M. Wackernagel (2008):Guidebook to the National Footprint Accounts, 2008 Edition, Global Footprint Network, US.
Rees, W.E. (1992): Ecological footprints and appropriated carrying capacity: what urban economics leaves out,Environment and Urbanization, Vol 4, No. 2, October.
Van, N.J. (2005):Méthodologie empreinte écologique: aperçu, Institut Angenius, July 2005.
Wackernagel, M (1994): Ecological Footprint and Appropriated Carrying Capacity: A Tool for Planning Toward Sustainability, Ph.D. Thesis, School of Community and Regional Planning. The University of British Columbia, Canada.
Wackernagel, M. and W.E. Rees (1996):Our Ecological Footprint: Reducing Human Impact on the Earth, Gabriola Island, BC: New Society Publishers, Canada.
Wackernagel, M. And W.E. Rees (1999): Notre empreinte écologique, Les Éditions Ecosociété,
Montréal, Canada.