www.atmos-chem-phys.net/11/9375/2011/ doi:10.5194/acp-11-9375-2011
© Author(s) 2011. CC Attribution 3.0 License.
Chemistry
and Physics
Source apportionment of the carbonaceous aerosol in Norway –
quantitative estimates based on
14
C, thermal-optical and organic
tracer analysis
K. E. Yttri1, D. Simpson2,3, K. Stenstr¨om4, H. Puxbaum5, and T. Svendby1 1Norwegian Institute for Air Research, Kjeller, Norway
2EMEP MSC-W, Norwegian Meteorological Institute, Oslo, Norway
3Dept. Earth & Space Sciences, Chalmers Univ. Technology, Gothenburg, Sweden 4Dept. Physics, Lund University, Lund, Sweden
5Inst. for Chemical Technologies and Analytics; Vienna University of Technology, Vienna, Austria
Received: 2 February 2011 – Published in Atmos. Chem. Phys. Discuss.: 3 March 2011 Revised: 1 September 2011 – Accepted: 5 September 2011 – Published: 9 September 2011
Abstract. In the present study, source apportionment of the ambient summer and winter time particulate carbonaceous matter (PCM) in aerosol particles (PM1and PM10) has been
conducted for the Norwegian urban and rural background en-vironment. Statistical treatment of data from thermal-optical,
14C and organic tracer analysis using Latin Hypercube
Sam-pling has allowed for quantitative estimates of seven different sources contributing to the ambient carbonaceous aerosol. These are: elemental carbon from combustion of biomass (ECbb) and fossil fuel (ECff), primary and secondary
or-ganic carbon arising from combustion of biomass (OCbb)
and fossil fuel (OCff), primary biological aerosol particles
(OCPBAP, which includes plant debris, OCpbc, and fungal
spores, OCpbs), and secondary organic aerosol from bio-genic precursors (OCBSOA).
Our results show that emissions from natural sources were particularly abundant in summer, and with a more pro-nounced influence at the rural compared to the urban back-ground site. 80 % of total carbon (TCp, corrected for the
positive artefact) in PM10and ca. 70 % of TCpin PM1could
be attributed to natural sources at the rural background site in summer. Natural sources account for about 50 % of TCp
in PM10 at the urban background site as well. The
natu-ral source contribution was always dominated by OCBSOA,
regardless of season, site and size fraction. During winter anthropogenic sources totally dominated the carbonaceous
Correspondence to:K. E. Yttri ([email protected])
aerosol (80–90 %). Combustion of biomass contributed slightly more than fossil-fuel sources in winter, whereas emissions from fossil-fuel sources were more abundant in summer.
Mass closure calculations show that PCM made significant contributions to the mass concentration of the ambient PM regardless of size fraction, season, and site. A larger fraction of PM1 (ca. 40–60 %) was accounted for by carbonaceous
matter compared to PM10(ca. 40–50 %), but only by a small
margin. In general, there were no pronounced differences in the relative contribution of carbonaceous matter to PM with respect to season or between the two sites.
1 Introduction
Particulate carbonaceous matter (PCM) is found to consti-tute 10–40 % (mean 30 %) of PM10 levels at rural and
Table 1.Notation used in this study.
OCF Measured organic carbon on front filter OCB Measured organic carbon on back filter
OCp Organic carbon after correction for positive artefact, OCp=OCF−OCB
TCp Total carbon after correction for positive artefact, TCp=OCp+EC
LG Levoglucosan
OC Organic carbon
OA Organic aeorosol (includes other elements, e.g. O, H, N) POA OA arising from primary emissions
ASOA OA arising from secondary oxidation of anthropogenic precursors
BSOA OA arising from secondary oxidation of biogenic precursors (mainly terpenes, isoprene ) PBAP Primary biological aerosol particles, includes fungii, plant debris, virus, etc.
Cel. Free cellulose, as measured PCM Particulate carbonaceous matter
subscript bb Associated with biomass burning
subscript ff Associated with fossil-fuels (includes POA and ASOA for OC) subscript pbs PBAP associated with sugars, e.g. fungii, etc.
subscript pbc PBAP associated with cellulose, e.g. plant debris subscript ASOA, BSOA Associated with ASOA, BSOA
F14C Fraction of modern carbon relative to a reference standard (Reimer et al., 2004)
(without subscript, F14C refers to whole TC sample, otherwise subscript indicates origin) 8EC Uncertainty factor for EC observations
8NA Uncertainty factor to account for negative sampling artefact of OC
8F14C Uncertainty factor for F14C observations
formation mechanisms (Baltensperger et al., 2005; Donahue et al., 2005, 2009; Kanakidou et al., 2005; Kroll and Seinfeld, 2008; P¨oschl, 2005; Hallquist et al., 2009).
Over the last few years a number of studies have become available which shed light on the important sources of PCM in Europe. Szidat et al. (2006) attributed the ambient aerosol carbon content to either fossil carbon (from combustion of coal, oil) or modern carbon (from recent vegetation, either by combustion, emissions, or formation using14C-analysis).
They found that fossil-fuel combustion accounted for only 30 % of OC throughout the year, even in the city center of Z¨urich (Switzerland). Biomass burning in wintertime and SOA in summertime seemed to account for the majority of the remaining OC. Follow-up studies in Switzerland using a variety of techniques have confirmed the basic source pat-terns (Szidat et al., 2007; Lanz et al., 2007, 2008). Recent results from northern Italy show similar features (Gilardoni et al., 2011).
The EU CARBOSOL project (CARBOnaceous AeroSOLs over Europe, Legrand and Puxbaum 2007) provided the first long-term assessment (2002–2004) of PCM in Europe. By using the results of 14C-, thermal-optical-, and organic tracer analysis as input, Gelencs´er et al. (2007) made use of a novel statistical method to calculate the likely contributions of different sources of the PCM at six sites in central/southern Europe. Wintertime residential-wood burning was found to be a significant contributor to
measured PCM levels at all the sites, whereas in summer-time, biogenic SOA (BSOA) was the dominant contributor. These data enabled for the first time an evaluation of the components (primary, secondary, anthropogenic, biogenic) of chemical transport model simulations (Simpson et al., 2007). Previously, only EC or OC has been available for model comparison, and as shown by Simpson et al. (2007), this has been wholly inadequate for understanding the role of e.g. local biomass burning versus long range transport, or of primary organic aerosol (POA) versus secondary (SOA).
conditions at least, the buildup of PM can be interpreted al-most entirely in terms of biogenic precursors and presumably SOA formation. However, this study described very clean air conditions, and it is unclear how far this result can be gen-eralized to typical Nordic conditions. Nevertheless, a sub-stantial 64 % contribution of SOA to OC was reported for Helsinki, Finland, during summertime by Saarikoski et al. (2008), of which the major fraction of SOA was likely to have a biogenic origin. Szidat et al. (2009) found that the contribution of non-fossil sources (likely BSOA) (53 %) and fossil sources (47 %) to TC almost equaled each other at a site in central Gothenburg in June 2006.
Yttri et al. (2007a) showed that levels of OC in PM10were
higher in summer compared to winter at rural background sites in Scandinavia, as compared to rural background sites in continental Europe. Based on results from the Norwegian site Birkenes this was attributed to coarse OC, which con-stituted approximately 50 % of OC in PM10 on a monthly
basis during summer. Further evidence that this coarse OC could be attributed to primary biological aerosol particles (OCPBAP) stems from seasonal and size distribution mea-surements of sugars and sugar-alcohols, which are tracers of OCPBAP (Yttri et al., 2007b).
Model studies have also suggested that BSOA formation can make a large contribution to PCM levels in Northern Eu-rope (Andersson-Sk¨old and Simpson, 2001; Chung and Sein-feld, 2002; Tsigaridis and Kanakidou, 2003; Simpson et al., 2007). The study of Simpson et al. (2007) noted the possibil-ity that BSOA formation may even be a significant contribu-tor to PCM levels in wintertime at Nordic sites, despite low emission rates of precursor species, as a result of the higher condensation rates applicable in cold Nordic conditions. This study also stressed that a major problem in all modeling of PCM is that too many steps in the calculation process are highly uncertain, and there are too few constraints. The uncertainties cover emissions from both anthropogenic and biogenic sources, atmospheric chemistry, and the fate of the various semi volatile products involved in SOA formation. Clearly, there is a strong need for measurements which are able to test the model’s abilities to predict all major compo-nents of PCM.
In the present study we present concurrent measurements of TC, EC, OC, monosaccharide anhydrides, sugars and sugar-alcohols, and cellulose, conducted at an urban back-ground site (Oslo) and a rural backback-ground site (Hurdal), as part of the Norwegian SORGA (Secondary ORGanic Aerosols in Urban Areas) project. These data are used to apportion the measured TC concentrations into primary, sec-ondary, fossil-fuel, and non-fossil- fuel related sources by the aid of14C-analysis. Further, the carbonaceous aerosol emit-ted from these sources has been examined with respect to season, size fraction and time of day.
2 Experimental methods
2.1 Sampling sites
Aerosol filter samples were collected at an urban back-ground site in Oslo, Norway, (Veterinary Institute, 59◦56′N, 10◦44′E, 77 m a.s.l.) and at a rural background site (Hurdal, 60◦22′N, 11◦04′E, 300 m a.s.l.) situated 70 km north east of Oslo, for a summer period (19 June–15 July 2006) and winter period (1–8 March 2007).
The Veterinary Institute measurements site is situated in the middle of the Oslo metropolitan area. Oslo is located in the innermost part of the Oslo fjord, and is largely sur-rounded by forested hills. The City of Oslo has a population of 0.6 million inhabitants, while the population of the greater Oslo-region is approximately 0.9 million. The Veterinary In-stitute measurements site is surrounded by low buildings of 2–3 storys. The nearest major road is situated approximately 120 m from the site (25 000 cars/day).
The EMEP (European Monitoring and Evaluation Pro-gramme, www.emep.int) site Hurdal is situated in the Bo-real forest with mixed conifer and deciduous trees, which to-gether with the Hurdal Lake (32 km2) account for the major-ity of the surrounding land use. The nearest local emission source is the local community of Hurdal (600 inhabitants), located 7 km north of the measurements site, which is known to have minor or even negligible influence on the air quality at the site. The nearest road is situated 200 m away from the site (<500 vehicles/day).
2.2 Aerosol sampling
2.2.1 PM10, PM1, EC, OC, TC, monosaccharide
anhydrides, sugars, sugar-alcohols
Aerosol (PM10and PM1) filter samples for subsequent
anal-ysis of mass concentration, EC, OC, TC, monosaccharide anhydrides, sugars and sugar-alcohols were collected on pre-fired (850◦C, 3 h) quartz fibre filters (Whatman QM-A, 47 mm), operated at ambient temperature. Tandem filter set-ups (McDow and Huntzicker, 1990) operating according to the QBQ-approach (quartz-fibre filter behind quartz fiber fil-ter) were applied to account for the positive sampling artefact of OC. All quartz fibre filters were obtained from the same batch number to minimize differences in the adsorptive ca-pacity, which otherwise would have biased the estimate of the positive artefact (Kirchstetter, 2001). After sampling, the front filters were conditioned at a temperature of 20±2◦C and at a relative humidity of 50±5 % for 48 h for gravimet-ric determination of the mass concentration. Thereafter the filters were placed in petrislides, packed in airtight plastic bags, and stored at−20◦C. The backup filters were stored immediately after sampling. Leckel LVS 3.1 samplers, oper-ating at a flowrate of 38 l min−1, were used to collect aerosol
Two 12 h samples were collected per 24 h, approximating day (9 a.m.–9 p.m.) and night (9 p.m.–9 a.m.), respectively.
2.2.2 14C, Cellulose
Aerosol filter samples (PM10 and PM1) were collected at
both sites for subsequent14C and cellulose analysis. The
aerosol were collected on pre-fired (850◦C, 3 h) quartz fibre filters (Whatman QM-A, 47 mm). At the rural background site, the time resolution for this sampling was 336 (14×24) h during the summer campaign and 168 (7×24) h during the winter campaign. The time resolution for the urban back-ground site was 168 h during the summer campaign and 84 h during the winter campaign, as sampling was separated into day and night, respectively. A Leckel LVS 3.1 samplers, op-erating at a flow rate of 38 l min−1were used to collect PM1,
whereas a NILU (Norwegian Institute for Air Research) filter holder with an IVL (Swedish Environmental Research Insti-tute) inlet, operating at a flowrate of 16.7 l min−1, was used to collect PM10.
The different sampling procedures (averaging times and filter face velocity) gave somewhat different estimates of OCp, by 12 % of average, presumably due to differences in homogeneity and unavoidable differences in sampling arte-facts between the systems. We have thus scaled the sampled cellulose by the OCp ratios in order to generate compatible values of all components.
2.3 Thermal-optical transmission analysis
The aerosol filter samples content of EC, OC, and TC was quantified using a thermal-optical transmittance (TOT) in-strument from Sunset laboratories Inc., operating according to a NIOSH derived temperature program. The ‘8785 Air Particulate Matter On Filter Media reference material from The National Institute of Standards and Technology (NIST) was used to test the performance of the temperature program. For further details about the temperature program and its per-formance see Yttri et al. (2007a).
2.4 Determination of organic tracers
2.4.1 Monosaccharide anhydrides
Levoglucosan, mannosan, and galactosan (monosaccharide anhydrides, MAs) were quantified according to the method described by Dye and Yttri (2005), described briefly here. One punch (1.5 cm2) from the quartz fibre filter was soaked in tetrahydrofuran (2 ml) and subjected to ultrasonic agita-tion (30 min). The extract was then filtered through a sy-ringe filter (0.45 µm) to remove PM and filter parts. The filter punch was extracted twice and the extracted volumes were pooled and evaporated to 1 ml by N2. Before
analy-sis the sample solvent elution strength was adapted to the mobile phase by adding Milli-Q water (0.8 ml). Concen-trations of the individual monosaccharide anhydrides were
determined using a High-Performance Liquid Chromatog-raphy (HPLC, Agilent model 1100) instrument combined with High-Resolution Mass-Spectrometry – time-of-flight (HRMS-TOF, Micromass model LCT) operated in the nega-tive electrospray mode. The compounds were identified by comparison of retention time and mass spectra with authen-tic standards. The compound separation was performed with two series-connected reversed-phase C18 columns (Atlantis dC18, Waters). The limit of quantification for the method at a signal to noise ratio of ten is approximately 20–40 ng in-jected of the individual MAs. An isotope labeled standard of mannosan, purchased from Cambridge Isotope Laborato-ries, was used as internal standard for quantification of the monosaccharide anhydrides.
2.4.2 Sugars and sugar-alcohols
Sugars (fructose, glucose, sucrose, trehalose), and sugar-alcohols (arabitol, erythritol, inositol, mannitol), were quan-tified according to the method described by Yttri et al. (2007b). Briefly, one punch (1.5 cm2) from the quartz fi-bre filter was soaked in Milli-Q water (1.5 ml) and subjected to ultra sonic agitation (30 min). Each filter was extracted twice. The extracted volumes were pooled, filtered through a syringe filter (0.45 µm) to remove particulates and filter de-bris, and evaporated to dryness under an N2atmosphere. The
dry extract was redissolved in Milli-Q water (100 µl) and iso-propanol (300 µl) prior to analysis. The analysis was per-formed by HPLC/HRMS-TOF analysis operated in the neg-ative electrospray mode. The compounds were identified by comparison of retention time obtained by separation on an amino column (Asahipak NH2-2D, 2.0 mm id×150 mm). The limit of quantification of the method at a signal to noise ratio of ten is approximately 30 ng injected of the individ-ual sugars and sugar-alcohols. An isotope-labeled standard of glucose, purchased from Cambridge Isotope Laboratories, was used as internal standard for quantification of the sugars and sugar-alcohols.
2.4.3 Cellulose
Table 2.Basis for source-apportionment.
EC= [EC] ×8EC (1)
OC= [OCp] +8NA×(OCF−OCB) (2)
TC=OC+EC (3)
TCbb= [LG] ×(TC/LG)bb (4) OCbb =TCbb×(OC/TC)bb (5)
ECbb=TCbb−OCbb (6)
ECff=EC−ECbb (7)
OCpbc = [Cel.] ×(OCpbs/Cel.) (8) OCpbs = [Mannitol] ×(OCpbs/Mannitol) (9)
OCPBAP=OCpbc+OCpbs (10)
F14C= [F14C] ×8F14C (11)
OCBSOA =([TC] ×F14C−TCbb×F14Cbb−OCpbs
×F14Cspores−OCpbc×F14Cdebris)/F14Cbio (12) OCff =OC−(OCbb+OCpbs+OCpbc+OCBSOA) (13) OCPOA =ECff×(OCff/ECff) (14)
OCASOA=OCff−OCPOA (15)
Notes: Square brackets denote measured quantities. Parentheses denote emission ra-tios, see Table 3. See also Table 1 for notation.
subsequently oxidized by Nicotinamide adenine dinucleotide phosphate (NADP) to gluconate-6-phosphate (G-6-P), with the formation of NADPH, stoichiometrically proportional to the amount of D-glucose originally present. NADPH was quantified by UV photometry at 340 nm, read against dis-tilled water. Free glucose was subtracted from the result. The limit of detection is 160 ng cm−2.
2.5 Radiocarbon analysis
Prior to the14C analysis, the carbon was extracted from fil-ters (about 75 µg of carbon per filter). This was achieved by first combusting the sample to CO2 in presence of
pre-cleaned CuO (powder and needles) and Cu (needles) in a vacuum system. Elemental carbon was then produced reduc-ing the CO2to elemental carbon using H2and a heated metal
catalyst (about 2 mg of Fe powder, Merck, pro analysis re-duced, diameter 10 µm, at 450◦C), and Mg(ClO4)2(Merck,
diameter 1–4 mm) as a drying agent. The time for complete reduction of each sample was less than 3 h. After complete graphitization the carbon and iron catalyst were pressed into Al sample holders and put on a 40 position sample wheel to-gether with graphitized standards (OxI, C6 and IAEA-C7) and blanks (anthracite).
The14C analysis was performed by accelerator mass spec-trometry at Lund University, using a compact, high capac-ity machine dedicated to radiocarbon dating, as well as to biomedical and environmental research (Skog, 2007; Skog et al., 2010).
3 Source-apportionment methodology
The measurements of EC, OC, TC,14C, levoglucosan, cellu-lose, sugars and sugar-alcohols in this study provide a set of tracers which provide information on the sources of the ob-served carbonaceous aerosol (c.f. Table 1). Levoglucosan is used as a tracer of TC from wood-burning (TCbb), whereas measurements of cellulose and selected sugar-alcohols (here: mannitol) can be used to determine the contribution of var-ious primary biological aerosol particles (OCPBAP). Mea-surements of14C help to determine the percentage of modern carbon versus carbon from fossil-fuel sources.
Here we perform a very similar analysis as that of Ge-lencs´er et al. (2007), in an effort to calculate the relative con-tributions of the main anthropogenic and natural sources of the carbonaceous aerosol. The methodology is updated with newer emissions ratios and information on the contribution of OC from fungal-spores provided by the inclusion of the sugar-alcohol mannitol. We also make an attempt to account for the negative as well as the positive artifact associated with sampling of OC. The approach used here is summarized in Eqs. 1–15, in Table 2, and the terms discussed in Sects. 3.1– 3.9.
Each step of this analysis has a level of uncertainty, but a major advantage of the present study compared to those presented in e.g. Gelencs´er et al. (2007) and Szidat et al. (2006, 2009) is that almost all parameters are derived from self-consistent studies from Oslo and surrounding areas. In particular, Yttri et al. (2009) reported very high correlations (R >∼0.9) between levoglucosan and OC in the small town of Elverum, 120 km east of Oslo, during wintertime sam-pling, and that the wood-burning contribution to OC/EC/TC was estimated to be close to 100 %. (This contribution likely includes both primary and secondary components, see Sect. 3.3). Further, related studies by Yttri et al. (2007b, 2005) and Dye and Yttri (2005) all provide a comprehen-sive background to the nature of the carbonaceous aerosol in Norway, and on the contribution of wood-burning and PBAP. These data have a number of advantages for our analysis:
– Location: Emission sources at Elverum (type of wood, appliance, etc.) are expected to be similar to those around the sampling sites in the current study.
– Consistency of sampling: In the present study the cor-rections for the positive sampling artifact of OC are con-sistent with the procedures of Yttri et al. (2009). Uncertainties still remain of course, and following Ge-lencs´er et al. (2007) we define both a central best-estimate value for each factor and a plausible range of uncertainty. In order to tackle the multitude of possible combinations of uncertain parameters, we have made use of an effective sta-tistical approach known as Latin-hypercube sampling (LHS) (Iman et al., 1981; Beachkofski and Grandhi, 2002; McKay et al., 1979). LHS approaches are somewhat similar to Monte Carlo calculations, and allow vast numbers of combinations of input variables to be computed. A Monte-Carlo simula-tion would involve testing all possible combinasimula-tions of in-put parameters. LHS provides a much more effective way of sampling the data, and for our purposes provides essentially the same results as a full Monte-Carlo analysis. We used the software available at http://people.scs.fsu.edu/∼burkardt/ f src/ihs/ihs.html for this purpose. Due to the paucity of in-formation on the input factors, parameters are (unless other-wise noted below) assigned equally between the low limit and the central value and between the central value and the high limit. The reasoning behind some of the design-decisions behind the LHS approach as used here is expanded in the Supplement, Appendix S1. All valid combinations of parameters (i.e. excluding those producing negative contri-butions) are condensed in frequency distributions of possible solutions. Table 2 describes the equations that are used for the source-apportionment analysis, and Table 3 summarizes the central-estimates and range of uncertainty for each factor. The rationale for each value is provided in Sects. 3.1–3.9.
Further, in the Supplementary material (Fig. S1), we briefly present the results of an alternative set of calculations, in which even wider uncertainty ranges have been utilized for one of the key factors, (OC/TC)bb. These alternative calcu-lations are presented partly to illustrate what happens with other sets of assumptions, and partly to demonstrate the ro-bustness of the source-apportionment methodology.
3.1 Estimation of EC, c.f. Eq. (1)
As discussed extensively by Schmid et al. (2001), different analytical methods give rather similar values for TC, but very different values for EC; i.e. more than a factor of 2 differ-ences for EC concentrations measured by various techniques. Ideally, the same analytical method should be used when es-tablishing the emission ratios including EC (e.g. (OC/EC)bb) as that used for analysis of the ambient aerosol content of EC. Since thermal-optical analysis, used in the present study, is the most accepted and widely used technique for EC mea-surements and also used for the emission ratio assumptions in the present study, we have adopted a narrower range of un-certainty,8EC, than that found by Schmid et al. (2001), with low, central and best estimates of 0.75, 1.0 and 1.25.
3.2 Estimation of OC, TC, c.f. Eqs. (2–3)
Collection of ambient aerosol filter samples for analysis of the particulate phase OC content is associated with both pos-itive and negative sampling artefacts. As discussed by Chow et al. (2010), the positive artifact is usually bigger than the negative one. We assume this to be true for the Nordic countries as well, thus, the true OC should lie between the measured front and back filter values, i.e. between OCF and OCB. Hence, we make use of the8NAterm in Eq. (2), and have assigned the low, central, and high value of OC to be OCp, OCp+0.2×(OCF−OCB), OCF.
Given EC and OC, TC is derived simply as EC + OC Eq. (3).
3.3 Estimation of TCbb, c.f. Eq. (4)
On a mass basis, the largest source of biomass burning emis-sion in Norway, and neighbouring countries, is wood burning in stoves and fireplaces used for residential heating. Wild-fires may occasionally impact PCM in Norway (Tsyro et al., 2007; Yttri et al., 2007a), but the contribution seems to be low in general. During the summertime measurement period in the current study, no nearby fire-activity was detected by MODIS (http://modis-fire.umd.edu).
Levoglucosan (LG) is emitted in high concentrations from wood burning and is regarded as a highly useful tracer of wood burning emissions (e.g. Schauer et al., 2001; Simoneit, 2002). A large number of studies concerning the emission ra-tio ((OC/LG)bbor (TC/LG)bb) is available, and their
suitabil-ity with respect to European conditions has been discussed by Gelencs´er et al. (2007); Puxbaum et al. (2007) and Simp-son et al. (2007).
Here we make use of the emission ratios estimated by Yt-tri et al. (2009) for Norwegian urban areas. They reported a best-fit (TC/LG)bb ratio of 20 for PM10 and 16 for PM2.5,
with most data falling within 14–23 and 10–18 respectively. These data were based upon a quartz-behind-teflon (QBT) sampling protocol. In the present study, levoglucosan was collected on a quartz-behind-quartz fiber filter setup (QBQ), which have been shown to retain some levoglucosan com-pared to Teflon filters (Dye and Yttri, 2005). Based upon Dye and Yttri (2005), we have applied a factor of 0.76 to the ratios to account for the difference between QBT and QBQ protocols, and other corresponding central-estimate values and corresponding ranges of (TC/LG)bb would then be 15 (11–17) for PM10 and 12 (7.6–14) for PM2.5. For the LHS
analysis, we allow for the possibility that the lowest ratio for PM2.5(7.6) is also appropriate for PM10, resulting in the
ranges shown in Table 3.
Table 3.Summary of uncertainty factors used in the LHS analysis. Low, central and high values are listed.
Parameters Low Central∗ High Equation Comment
8EC 0.75 1.0 1.25 1 Uncertainty in EC
8NA 0.0 0.2 1.0 2 Artefact uncertainty, Sect. 3.2 (TC/LG)bb, PM10 11 15 17 4 Ratio in emissions
(TC/LG)bb, PM2.5 7.6 12 14 Ratio in emissions (OC/TC)bb, PM10 0.73 0.78 0.82 5 Ratio in emissions (OC/TC)bb, PM2.5 0.66 0.71 0.76 Ratio in emissions (OC/EC)POA 0.2 0.6 1.3 14 Ratio in emissions OCpbc/Cel. 0.8 1.6 3.2 See Sect. 3.5 OCpbs/Mannitol 5.2 – 10.8 9 See section 3.6
8F14C 0.95 1.0 1.05 11 Uncertainty in F14C, Sect. 3.7
F14Cbb 1.055 – 1.25 12 See Sect. 3.7 F14Cspores 1.055 – 1.25 12 See Sect. 3.7 F14Cdebris 1.055 12 See Sect. 3.7
∗Where no central value is given, the value used is simply the mean of the low and high values.
when compared to data derived from ratios from laboratory emission studies, as the data derived from ambient measure-ments include some condensed and secondary OC. Indeed, Grieshop et al. (2009b,a) demonstrated in smog chamber ex-periments that wood-burning SOA actually may reach up to similar levels as POA. Heringa et al. (2011) found similar re-sults in a smog-chamber even with winter light conditions, and Lanz et al. (2010) found some evidence for secondary OCbb in field data. Thus, we regard the TCbb values de-rived here from levoglucosan as an “operational” definition. The ratios used in the present study were derived from win-tertime ambient measurements (Yttri et al., 2009) and may also include condensed vapors and secondary products.
3.4 Estimation of OCbb, ECbb, ECff, c.f. Eqs. (5–7)
Analysis of the Yttri et al. (2009) data suggests best values for (OC/TC)bb of 0.78 for PM10and 0.71 for PM2.5. In
gen-eral the range of variation of this ratio was small, with the un-certainty range given in Table 3 encompassing most points. We also assume that the ratios found for PM2.5in this earlier
study can be applied for PM1 here, since most direct
com-bustion emissions are in the sub-micron mode. Given TCbb and OCbb, ECbb is the difference, Eqs. (4–5), and ECff is derived simply as the difference between EC and ECbb.
For the sensitivity analysis presented in Supplementary information, we have adopted a wider range for these (OC/TC)bb values, to reflect findings from other studies. For example, Gilardoni et al. (2011) used a very wide range of (OC/EC)bb, from 1–20, equivalent to (OC/TC)bb between 0.5 – 0.95. Grieshop et al. (2009b) also found a wide range, 1.1–13, in (OC/EC)bb ratios in fresh emissions, and demon-strated that photochemical production of SOA quickly en-hanced the OC/EC ratio which would make it hard to distin-guish biomass-burning POA from SOA in ambient samples.
Both of these studies make use of non-European tree data, however. Heringa et al. (2011) found very low OM/EC val-ues (<0.5) in some conditions in smog-chamber studies, but again the wood-types used (beech logs and pellets) are less important than birch or softwoods in Norway. Given the dif-ferences in wood-types and study methodology, we believe the extreme values in these studies are probably less relevant to SORGA than the ambient-data based Yttri et al. (2009) re-sults. However, for the sensitivity study we allow low, central and high values of (OC/TC)bb of 0.66, 0.82, 0.95.
3.5 Estimation of OCpbc from plant debris, c.f. Eq. (8)
Similar to Gelencs´er et al. (2007) and S´anchez-Ochoa et al. (2007) the contribution of plant debris to the carbonaceous aerosol is estimated from the measured amount of free cellu-lose. Free cellulose forms on average about 72 % of total cel-lulose. Further, for the mass balance the amount of plant de-bris has to be expressed in carbon equivalent, which is about 57 % of the total mass. Plant debris is assumed to be about two times the concentration of total cellulose (Puxbaum and Tenze-Kunit, 2003). Thus, measured cellulose concentra-tions were multiplied by a factor of 1.6 (= 0.57×2/0.72) as a best-estimate of the contribution of OCpbc on a carbon equivalent basis. As in Gelencs´er et al. (2007), a factor of two is used in the uncertainty estimates.
3.6 Estimation of OCpbs from fungal spores, c.f. Eq. (9)
OCpbs is calculated from mannitol. Bauer et al. (2008a) found that mannitol accounted for 1.2–2.5 pg spore−1 and
that the spores OC content was 13 pg OC spore−1 (Bauer
A mean mannitol-to-arabitol ratio of 1.5±0.5 can be de-duced from the study of Bauer et al. (2008a). The 24 h mean mannitol-to-arabitol ratios observed for PM10 in summer
(Oslo: 1.4±0.3; Hurdal: 1.3±0.5) in the present study (Ta-ble 5) were within the range reported by Bauer et al. (2008a), thus justifying our use of their findings. During winter the ratio was slightly lower (Oslo: 1.1±0.3; Hurdal: 1.3±0.5) and the variation greater, for unknown reasons. Further, the mannitol-to-arabitol ratio had a diurnal variation in summer, with a higher ratio during night compared to the day. This could indicate influence from various genra of fungi.
3.7 Estimation of F14C, F14Cbb, F14CsporesEq. (11)
F14C is the so-called modern fraction of14C, indicating of the amount of contemporary carbon in the aerosol. Fossil-fuels have F14C values of zero, and recently grown vegeta-tion has F14C values close to 1. A F14C value of 1.0 approx-imately refers to conditions before the atomic bomb tests of the 1950s (Currie et al., 2002). The average14C signature of atmospheric CO2 for the two years (2006, 2007) during
which the sampling campaigns of the present study was con-ducted gives F14C = 1.055 (Szidat et al., 2009). The mea-sured value of F14C in an aerosol sample, (F14C), is one of the most accurately measured quantities in these analyses, but still has a small uncertainty due to both measurement rors and heterogeneity on the filters. We allow for a small er-ror, of±5 %, and use an uncertainty factor8F14C(0.95–1.05)
and symmetrical beta(2,2) distribution (NIST/SEMATECH, 2010) to assign probabilities around the central value. The
14C signature of biomass burning emissions (F14C
bb) is gen-erally uncertain, ranging from 1.055 for burning of agricul-tural residues to a maximum of 1.25 from burning of trees (Lewis et al., 2004; Szidat et al., 2006). For plant debris, we have assumed a recent biological origin, F14Cdebris=1.055. Asco- and Basidiomycota (ABM) are heterotrophic or-ganisms, i.e. they require carbon for growth and energy but cannot fix carbon themselves. ABM can acquire or-ganic molecules from dead oror-ganic material, (e.g. dead plant leaves, logs, etc.), so-called decomposers, or as symbionts. Formation of mycorrhiza, which is a symbiotic association between quite a few ABM and the root systems of plants, makes the fungus benefit from photosynthetic products pro-duced by the tree, which has a recent origin; i.e. F14C similar to plant debris (1.055). Decomposers may live on old as well as recent substrate, thus in order to account for this we allow for a wider range of F14Cspores (1.055–1.25) than for plant debris.
3.8 Estimation of OCBSOA c.f. Eq. (12)
OCBSOA is calculated from the radiocarbon balance equa-tion (Eq. 12), assuming modern origin (F14Cbio=1.055) for this aerosol component. As BSOA is thought to be generated mainly from isoprene and monoterpenes (e.g. Hallquist et al.,
2009), and these originate from recent foliage, the radiocar-bon signature should be well defined.
3.9 Estimation of OCff, OCPOA and OCASOA
c.f. Eqs. (13–15)
OCff, the carbon associated with fossil-fuels, is calculated as the difference between OC and the sum of OCBSOA, OCpbs, OCpbc and OCbb, and consists of both primary emissions (OCPOA) and secondary compounds (OCASOA). In this work, we present the further breakdown of OCff into these POA and ASOA components, albeit with the strong caveat that this is probably the most uncertain split in the source-apportionment calculations. This caveat would apply for any calculations at the end of a chain of uncertain steps, but for these components the problems are exacerbated by their nature. As discussed in Robinson et al. (2007) and Don-ahue et al. (2006), the relationships between tailpipe sions of POA and OA components arising from these emis-sions are complex, involving evaporation and condensation of emitted gases and particles, chemical processing and parti-tioning. Observed OC/EC ratios which have previously been used for source-apportionment (e.g. Cabada et al., 2004; Cas-tro et al., 1999; Gelencs´er et al., 2007) cannot usually distin-guish true POA from ASOA.
Nevertheless, it can be useful to distinguish POA contribu-tions from ASOA, since both components can serve to eval-uate chemical transport models (e.g. Simpson et al., 2007), and as they are subject to different control measures. As shown in eqn 14, OCPOA is estimated using assumed pri-mary OC/EC ratios. Such ratios have indeed been used ex-tensively in the past, but values vary widely. Kupiainen and Klimont (2004, 2007) estimated non-biomass (OC/EC)POA to be 0.71 for old EU15 countries, but 1.2 for new member states. Gelencs´er et al. (2007) used 0.48 (range 0.48–1.2), largely on the basis of Austrian tunnel studies. More recent studies using aerosol mass spectrometer AMS instruments found OA/BC ratios of 12–44 % in fresh emissions from in-use diesel engines in a chamber (Chirico et al., 2010). Tunnel measurements with AMS instruments demonstrated impor-tant effects of partitioning on OA/BC ratios, with OA/BC ra-tios of ca. 0.4 at low organic loadings (∼10 µgm−3) to about 1.5 for OA of 100–200 µgm−3(Chirico et al., 2011). With an
4 Results
4.1 PM10and PM1mass concentrations
Mean concentrations of PM10and PM1are presented in
Ta-ble 4. These values are similar to annual mean concentra-tion ranges of PM10and PM2.5/PM1previously reported for
Norwegian urban and rural environments (Yttri, 2007). The rather short duration of the two sampling periods conducted in the present study could influence their representativeness; e.g. summer time concentrations are found to be higher than or equal to the concentrations observed during winter, which is opposite of that commonly seen (Yttri, 2007). PM1
ac-counted for a larger fraction of PM10at the rural background
site compared to the urban background site. Also, the PM1
-to-PM10ratio was higher in winter compared to summer.
4.2 EC and OC concentrations
The carbonaceous aerosol (here: EC, OCp, TCp) concentra-tions (see Table 4) observed at the urban background site is in the lower range of that previously reported for Norwegian ur-ban areas (Yttri et al., 2005, 2009), whereas it is in the upper range of what has been observed for the rural environment (Yttri et al., 2007a). The levels of OCp and TCp should be considered as conservative estimates, as the QBQ sampling approach account for the positive but not the negative sam-pling artefact of OC (see Sect. 2.2).The mean positive artifact of OC ranged from 18±8.6 % for the urban background site in winter to 50±14 % at the rural background site in winter. The difference between the urban- and the rural back-ground site with respect to the OCp level is relatively small in summer (25–30 % higher at the urban background site), whereas the difference was substantially larger (a factor 2.4– 2.8 higher at the urban background site) in winter. EC had a similar pattern, with urban background levels being 50 % higher compared to the rural background site in summer and a factor of approximately 3 higher in winter.
Levels of OCp in PM10were higher in summer than during
winter at the urban background site, whereas it is opposite for PM1. For EC, levels were higher in winter for both size
fractions. At the rural background site, levels of OCp were substantially higher in summer compared to winter. This sea-sonal variation was more pronounced for PM10than for PM1.
For EC, a similar pattern as for OCp was observed for PM10,
whereas for PM1the levels remained unchanged.
Only minor differences in the EC/TCp ratio were observed between the two sites, regardless of season and size fraction. The EC/TCp ratio was found to be substantially higher in winter (27–31 %) compared to summer (16–21 %) at both sites and for both size fraction.
4.3 Organic tracers concentrations
Ambient mean concentrations of the wood burning tracer lev-oglucosan are reported in Table 4. The mean concentration observed at the urban background site in winter (130 ngm−3)
was lower than that previously reported by Yttri et al. (2005) for Norwegian urban areas during winter time sampling (i.e. 166–407 ngm−3). At the rural background site, the win-ter time mean levoglucosan concentration (40 ngm−3) was 2–3 times higher than that reported by Yttri et al. (2007b) for the rural background site Birkenes in southern Norway. The levoglucosan concentration was 3–5 times higher in winter compared to summer.
Levels of sugars and further sugar alcohols (see Table S1 of the Supplement) were within the range previously reported for Scandinavian and continental rural (Carvalho et al., 2003; Ion et al., 2005; Yttri et al., 2007b) and urban background (Yttri et al., 2007b) environments in Europe. Higher con-centrations in summer compared to winter were observed for all species. In summer, the highest concentrations were seen at the rural background site (except for ribose), whereas it was the opposite way around in winter. With the excep-tion of ribose and fructose, close to 90 % of the sugars and sugar-alcohols observed in summer could be attributed to the coarse fraction of PM10. A similar calculation could not be
performed for the samples collected during the winter cam-paign.
The content of cellulose in the ambient aerosol has been reported in a very few studies only (Kunit and Puxbaum, 1996; Puxbaum and Tenze-Kunit, 2003; S´anchez-Ochoa et al., 2007). The cellulose concentrations observed in the present study, ranging from 5–130 ngm−3, are comparable
to those observed for the European rural background envi-ronment by S´anchez-Ochoa et al. (2007), as is the seasonal variation with increased concentrations in summer.
4.4 Radiocarbon, F14C
The F14C values are reported in Table 4. We find that F14C was higher at the rural background site compared to the ur-ban background site, regardless of season and size fraction. In addition, F14C was typically higher in summer compared to winter at both sites. The F14C values show no diurnal vari-ation, except for PM1at the urban background site in winter;
i.e. F14C was 0.70 during the night and 0.59 during the day. F14C appears to be in the upper range of, or higher than, values reported for European and US urban and rural areas by Glasius et al. (2011); Heal et al. (2011); Hodzic et al. (2010).
4.5 Source apportionment analysis
The best estimate concentration, the 10th and the 90th per-centile of the carbonaceous fractions in PM10 and PM1, as
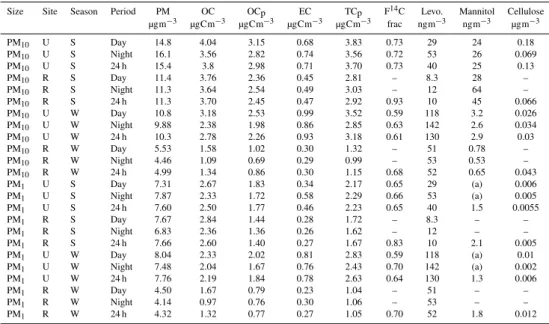
Table 4.Measured concentrations of aerosol components.
Size Site Season Period PM OC OCp EC TCp F14C Levo. Mannitol Cellulose
µgm−3 µgCm−3 µgCm−3 µgCm−3 µgCm−3 frac ngm−3 ngm−3 µgm−3
PM10 U S Day 14.8 4.04 3.15 0.68 3.83 0.73 29 24 0.18
PM10 U S Night 16.1 3.56 2.82 0.74 3.56 0.72 53 26 0.069
PM10 U S 24 h 15.4 3.8 2.98 0.71 3.70 0.73 40 25 0.13
PM10 R S Day 11.4 3.76 2.36 0.45 2.81 – 8.3 28 –
PM10 R S Night 11.3 3.64 2.54 0.49 3.03 – 12 64 –
PM10 R S 24 h 11.3 3.70 2.45 0.47 2.92 0.93 10 45 0.066
PM10 U W Day 10.8 3.18 2.53 0.99 3.52 0.59 118 3.2 0.026
PM10 U W Night 9.88 2.38 1.98 0.86 2.85 0.63 142 2.6 0.034
PM10 U W 24 h 10.3 2.78 2.26 0.93 3.18 0.61 130 2.9 0.03
PM10 R W Day 5.53 1.58 1.02 0.30 1.32 – 51 0.78 –
PM10 R W Night 4.46 1.09 0.69 0.29 0.99 – 53 0.53 –
PM10 R W 24 h 4.99 1.34 0.86 0.30 1.15 0.68 52 0.65 0.043
PM1 U S Day 7.31 2.67 1.83 0.34 2.17 0.65 29 (a) 0.006
PM1 U S Night 7.87 2.33 1.72 0.58 2.29 0.66 53 (a) 0.005
PM1 U S 24 h 7.60 2.50 1.77 0.46 2.23 0.65 40 1.5 0.0055
PM1 R S Day 7.67 2.84 1.44 0.28 1.72 – 8.3 – –
PM1 R S Night 6.83 2.36 1.36 0.26 1.62 – 12 – –
PM1 R S 24 h 7.66 2.60 1.40 0.27 1.67 0.83 10 2.1 0.005
PM1 U W Day 8.04 2.33 2.02 0.81 2.83 0.59 118 (a) 0.01
PM1 U W Night 7.48 2.04 1.67 0.76 2.43 0.70 142 (a) 0.002
PM1 U W 24 h 7.76 2.19 1.84 0.78 2.63 0.64 130 1.3 0.006
PM1 R W Day 4.50 1.67 0.79 0.23 1.04 – 51 – –
PM1 R W Night 4.14 0.97 0.76 0.30 1.06 – 53 – –
PM1 R W 24 h 4.32 1.32 0.77 0.27 1.05 0.70 52 1.8 0.012
Notes: Sites are (U)rban: Oslo, (R)ural: Hurdal; Seasons are (S)ummer = 19 June–15 July 2006, (W)inter = 1 March–8 March, 2007; (a) day and night mannitol not measured, but assumed equal to 24 h value for LHS analysis. (Values are very small, so have little impact on the analysis).
Table 5.Mannitol-to-arabitol ratios for PM10.
24 h Day Night
Oslo
Summer 1.4±0.3 1.3±0.2 1.5±0.4 Winter 1.3±0.5 1.3± 0.5 1.3±0.5
Hurdal
Summer 1.5±0.3 1.2±0.2 1.7±0.3 Winter 1.1±0.3 1.1±0.2 1.1±0.5
whereas the relative contributions of these concentrations to TCp are shown in Tables 6–9. These results are discussed in detail below.
Results for the alternative calculation (with wider uncer-tainty ranges) are presented in Fig. S1 of the Supplement for comparison.
5 Discussion
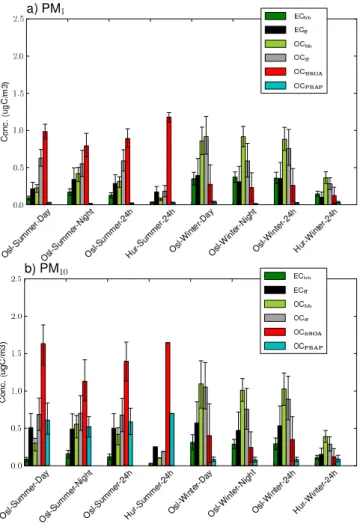
The results of the source-apportionment analysis, presented in Fig. 1 and Tables 6–9 (also Tables S2–S5) show broad scale features similar to those found in previous studies: large contributions of wood-burning in winter time and large contributions of BSOA in summertime. We discuss the ma-jor components in Sects. 5.1–5.6 and in Sect. 5.7 we present an estimate of the contribution of the organic aerosol compo-nents to the total PM1and PM10mass concentrations.
5.1 Carbonaceous aerosol from fossil-fuel sources and
biomass burning
As discussed in Sect. 3.9, the source-apportionment method-ology does generate a split between the primary POA com-ponents and secondary ASOA comcom-ponents but this split is highly uncertain. For this reason, Fig. 1 only presents the more robust category OCff, but the breakdown is given in the Tables.
OC originating from fossil-fuel sources (OCff) was more abundant than OC from wood burning (OCbb) during sum-mer, whereas it was the other way around in winter (See Ta-bles S2–S5). Further, there was an urban background incre-ment with respect to both OCff and OCbb compared to the rural background site: i.e. the mean concentration of OCff and OCbb was 2.4–4.2 times higher at the urban background site than at the rural background site, both seasons and size fractions included. The tentative POA/ASOA breakdown presented in the Tables suggests that both components are significant, but with ASOA often contributing about twice as much as POA. Smallest ASOA contributions are seen at the rural site for both PM10 and PM1 in summertime. In
gen-eral it seems that winter conditions increase the ASOA esti-mate. This may be related to increased emissions of ASOA precursors, or to increased condensation mechanisms (espe-cially for the urban site), but given the uncertainties it seems unwise to speculate further on these differences.
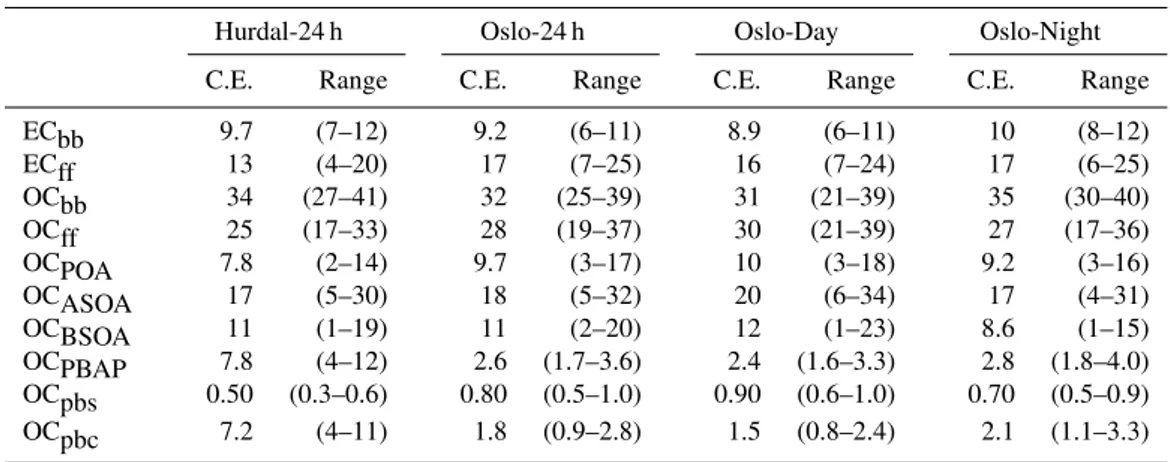
Table 6. Calculated percentage contributions to total carbon from LHS analysis, PM10, summer sampling (19 June–15 July 2006). C.E. is central estimate (50th percentile), range is 10th–90th percentiles of LHS results.
Hurdal-24 h Oslo-24 h Oslo-Day Oslo-Night
C.E. Range C.E. Range C.E. Range C.E. Range
ECbb 1.0 (0.6–1.3) 3.2 (2.1–4.2) 2.3 (1.4–2.9) 4.5 (2–5) ECff 8.6 (6–10) 14 (7–18) 13 (7–18) 14 (7–19) OCbb 3.5 (2.3–4.2) 11 (7–13) 7.9 (5–9) 16 (10–18) OCff 6.5 (3–9) 18 (12–24) 18 (12–23) 20 (13–26) OCPOA 4.0 (2–6) 7.7 (3–12) 7.6 (3–12) 7.9 (3–13) OCASOA 2.6 (0–5) 11 (2–19) 10 (2–18) 12 (2–21) OCBSOA 56 (49–63) 38 (30–44) 43 (35–49) 32 (24–39) OCPBAP 24 (18–30) 16 (11–20) 16 (11–21) 15 (10–18) OCpbs 18 (13–22) 7.4 (5–9) 5.9 (4–7) 9.2 (6–11) OCpbc 5.8 (3–9) 8.4 (4–13) 10 (5–16) 5.5 (2–8)
Table 7.Calculated percentage contributions to total carbon from LHS analysis, PM10, winter sampling (1–8 March 2007). C.E. is central estimate (50th percentile), range is 10th–90th percentiles of LHS results.
Hurdal-24 h Oslo-24 h Oslo-Day Oslo-Night
C.E. Range C.E. Range C.E. Range C.E. Range
ECbb 9.7 (7–12) 9.2 (6–11) 8.9 (6–11) 10 (8–12)
ECff 13 (4–20) 17 (7–25) 16 (7–24) 17 (6–25)
OCbb 34 (27–41) 32 (25–39) 31 (21–39) 35 (30–40) OCff 25 (17–33) 28 (19–37) 30 (21–39) 27 (17–36) OCPOA 7.8 (2–14) 9.7 (3–17) 10 (3–18) 9.2 (3–16) OCASOA 17 (5–30) 18 (5–32) 20 (6–34) 17 (4–31) OCBSOA 11 (1–19) 11 (2–20) 12 (1–23) 8.6 (1–15) OCPBAP 7.8 (4–12) 2.6 (1.7–3.6) 2.4 (1.6–3.3) 2.8 (1.8–4.0) OCpbs 0.50 (0.3–0.6) 0.80 (0.5–1.0) 0.90 (0.6–1.0) 0.70 (0.5–0.9) OCpbc 7.2 (4–11) 1.8 (0.9–2.8) 1.5 (0.8–2.4) 2.1 (1.1–3.3)
included, but that wood burning was the larger source. It might be that the rather high ambient temperature observed during the winter campaign (i.e. 2.2◦C compared to the long term mean of−1.5◦C at the urban background site) had an influence on the levoglucosan concentration, which was rel-atively low compared to previously reported studies (Yttri et al., 2005). In summer, the relative contribution of OCff to TCp was higher than that of OCbb to TCp at both the urban (OCff to TCp=18−29 %; OCbb to TCp=8−18 %) and the rural background site (OCff to TCp=7−11 %; OCbb to
TCp∼4 %).
Combustion of fossil fuel was the major source of EC re-gardless of site, season, size fraction and time of the day, accounting for 9–17 % of TCp. Further, there was an urban background increment for the ECff and ECbb concentration compared to the rural background site, ranging from 1.7–3.5. As expected, the concentrations of ECbb grew larger in win-ter due to increased emissions from residential wood burning, accounting for about 35–60 % of EC compared to 10–30 % in
summer. A similar seasonal variation was reported by Szidat et al. (2006) for an urban background site in Z¨urich, using a combination of14C and organic tracer analysis, however the
ECbb contribution to EC was slightly less in Zurich than is Oslo, i.e. 6±2 % in summer and 25±5 % in winter.
Table 8. Calculated percentage contributions to total carbon from LHS analysis, PM1, summer sampling (19 June–15 July 2006). C.E. is central estimate (50th percentile), range is 10th–90th percentiles of LHS results.
Hurdal-24 h Oslo-24 h Oslo-Day Oslo-Night
C.E. Range C.E. Range C.E. Range C.E. Range
ECbb 1.9 (1.3–2.3) 5.8 (4–7) 4.3 (3–5) 7.5 (5–9) ECff 10 (6–14) 13 (6–18) 9.9 (4–13) 15 (7–21) OCbb 4.5 (3–5) 14 (10–16) 10 (7–12) 18 (13–21) OCff 11 (6–15) 26 (20–33) 29 (23–34) 24 (16–32) OCPOA 5.4 (2–8) 8.3 (3–15) 6.6 (2–12) 8.8 (3–15) OCASOA 5.6 (0–11) 18 (7–29) 22 (13–31) 15 (3–27) OCBSOA 71 (66–74) 40 (34–45) 45 (40–49) 35 (28–41) OCPBAP 1.7 (1.2–2.1) 0.90 (0.6–1.1) 1.2 (0.8-1.5) 0.60 (0.4–0.8) OCpbs 1.1 (0.8–1.4) 0.50 (0.3–0.6) 0.60 (0.4-0.8) 0.40 (0.2–0.4) OCpbc 0.60 (0.3–0.9) 0.40 (0.2–0.6) 0.60 (0.3-0.9) 0.30 (0.1–0.4)
Table 9.Calculated percentage contributions to total carbon from LHS analysis, PM1, winter sampling (1st-8th March 2007). C.E. is central estimate (50th percentile), range is 10th–90th percentiles of LHS results.
Hurdal-24 h Oslo-24 h Oslo-Day Oslo-Night
C.E. Range C.E. Range C.E. Range C.E. Range
ECbb 14 (10–17) 14 (10–16) 12 (9–15) 15 (12–18) ECff 9.6 (2–16) 13 (3–21) 14 (4–22) 13 (3–21) OCbb 35 (27–42) 34 (27–39) 30 (23–36) 38 (32–43) OCff 27 (19–34) 29 (20–38) 33 (24–42) 24 (15–34) OCPOA 6.2 (1–12) 8.2 (2–16) 9.0 (2–17) 7.3 (1–14) OCASOA 21 (8–32) 21 (6–35) 24 (8–38) 17 (4–31) OCBSOA 12 (1–22) 9.9 (1–18) 9.7 (1–19) 9.5 (1–17) OCPBAP 3.2 (2.2–4.3) 0.90 (0.6–1.1) 1.3 (0.8–1.7) 0.6 (0.4–0.6) OCpbs 1.3 (0.9–1.6) 0.40 (0.3–0.5) 0.50 (0.3–0.6) 0.40 (0.3–0.5) OCpbc 1.9 (1.0–3.0) 0.50 (0.2–0.7) 0.80 (0.4–1.2) 0.10 (0.0–0.2)
5.2 Biogenic secondary organic aerosol, OCBSOA
OCBSOA was a major contributor to the carbonaceous aerosol in summer, accounting for 56 % of TCp in the PM10 fraction at the rural background site and 36 % at
the urban background site. For PM1, OCBSOA was even
more pronounced, constituting 68 % of TCp at the rural background site and 38 % at the urban background site. Summer time OCBSOA concentrations ranging from 1.1– 1.7 µgCm−3were observed for PM
10, whereas the range was
0.8–1.2 µgCm−3for PM
1. A profound diurnal and seasonal
variation was observed, with summertime OCBSOA concen-trations being 1.2–1.4 times higher during daytime sampling compared to nighttime sampling, and concentrations being 1.2–1.3 times higher at the rural background site compared to the urban background site. In winter, no more than 12 % of TCp could be attributed to OCBSOA, and the concentra-tions were substantially lower (3–15 times) than those ob-served during summer. The diurnal variation was also
evi-dent in winter, while OCBSOA concentrations were found to be somewhat higher at the urban background site than at the rural background site in winter. The latter effect is presum-ably due to the increased condensational fraction of BSOA compounds that can arise in areas of high total OA concen-trations (e.g. Donahue et al., 2009).
Fig. 1. Best estimate concentrations (µg C m−3) of different car-bonaceous particle fractions for the SORGA samples. Uncertainty bars represent 10 and 90 percentiles from LHS calculations.
such as Mexico city (Jimenez et al., 2009). Another possi-bility is related to loss processes. Many OA species are ex-pected to be lost to deposition (Bessagnet et al., 2010; Hal-lquist et al., 2009), and near-surface loss rates will be greater at night, below any nocturnal boundary layer.
As discussed in Sect. 3.3, some of the modern carbon as-signed to BSOA might instead represent SOA from biomass burning, since both sources of modern carbon are hard to dis-tinguish. The use of (TC/LG)bb from ambient data helps to minimise this problem, but as with TCbb we need to regard BSOA as an operational definition.
5.3 Primary biological aerosol particles OCPBAP
Fungal spores and plant debris are likely the major sources of OCPBAP. In the present study, OC associated with fun-gal spores (OCpbs) and plant debris (OCpbc) was calcu-lated based on the aerosol filter samples content of mannitol and cellulose, respectively. The results show that OCPBAP (here: OCPBAP=OCpbs+OCpbc) comprised on average
16 % of TCp in PM10at the urban background site and 24 %
of TCp in PM10 at the rural background site in summer.
OCpbs and OCpbc contributed approximately equally to TCp at the urban background site, whereas the fungal spore contribution was about three times higher than that of plant debris at the rural background site. In winter, the OCPBAP contribution to TCp was substantially lower than in summer. A higher relative contribution of OCPBAP to TCp at the rural site (7.8 %) compared to the urban site (2.6 %) was consistent with the pattern observed in summer. One major difference observed during winter compared to summer was that plant debris totally dominated OCPBAP at the rural background site. For PM1, the relative contribution of OCPBAP to TCp
was only 1–3 % across all seasons and sites. From the results presented in Table 4 we find that OCPBAP constituted about 60 % of TCp,PM10−1(1.3 µgCm
−3) at the rural background
site in summer, which we consider to be a very high share. OCPBAP comprised a considerable contribution (ca. 40 %) to TCp,PM10−1 (1.5 µgCm
−3) at the urban background site
as well. The abundance of OCPBAP in the Scandinavian rural background environment, its pronounced seasonal vari-ation, as well as its presence in the coarse fraction of PM10
have previously been addressed and reported by Yttri et al. (2007a,b) and Bauer et al. (2008b). However, this is the first time a quantitative measurement-based estimate of the OCPBAP fraction has been made for this region. Our results confirm that OCPBAP is an important source of the carbona-ceous aerosol both in the rural and the urban background en-vironment.
As OCPBAP typically reside in the coarse fraction of PM10, local sources can have a relatively large impact on
concentrations. The apparent similarity of PBAP seen for Oslo and Hurdal is misleading: there are great differences in the relative composition of OCPBAP with respect to OCpbs and OCpbc at the two sites (see above), implying that differ-ent source types contribute to OCPBAP at the two sites. This is further supported by the diurnal and seasonal variation of the individual sugars and sugar–alcohols (Table S1). For ex-ample, arabitol, mannitol and trehalose in PM10all peak
dur-ing the night at the rural background site in summer, which likely reflects nocturnal discharge of fungal spores (Graham et al., 2003; Ion et al., 2005), while this is not observed at the urban background site. We also find that the individual concentrations of all sugars and sugar-alcohols are higher at the urban background site than for the rural background site in winter.
5.4 Natural versus anthropogenic sources of the
carbonaceous aerosol
but most incidences are due to human activity (Achard et al., 2008; Winiwarter et al., 1999). However, as noted in Sect. 3.3 no nearby fire-activity was detected by MODIS for this summertime measurement period. OCBSOA and OCPBAP are defined as natural sources, although anthro-pogenic emissions facilitate the transformation of biogenic VOCs to OCBSOA (Tsigaridis and Kanakidou, 2003; Carl-ton et al., 2010; Donahue et al., 2009) and increased con-centrations of OCPBAP has been found in association with sewage plants and are associated with other anthropogenic activities as well, e.g. house demolition and agricultural ac-tivities (Matthias-Maser, 1998, and references therein).
As expected, natural sources were found to be particularly abundant in summer, and with a more pronounced influence at the rural compared to the urban background site. At the rural background site, 80 % of TCp in PM10 and 70 % of
TCp in PM1 could be attributed to natural sources. The
slightly lower percentage seen for PM1 is due to OCPBAP
primarily residing in the coarse fraction of PM10. Natural
sources accounted for about 50 % of TCp in PM10at the
ur-ban background site as well. As for the rural background site, the relative contribution of natural sources to TCp in PM1
(ca. 40 %) at the urban background site was slightly less than for PM10, but still quite substantial taken into account that it
is an urban site. The natural source contribution was always dominated by OCBSOA, regardless of season, site and size fraction. During winter the picture was reversed, as anthro-pogenic sources totally dominated the carbonaceous aerosol (ca. 80–90 %), whereas no more than ca. 10–20 % could be explained by natural sources. Combustion of biomass contributed slightly more than combustion of fossil fuel in winter, whereas emissions from fossil fuel combustion were more abundant in summer.
5.5 Alternative calculation
As discussed in Sect. 3.4, assumptions concerning the appro-priate (OC/TC)bb factor vary widely between different stud-ies. We have preferred to use factors derived from Norwe-gian studies, as they are most likely to represent the biomass-burning combustion emissions for the SORGA sites, but Gi-lardoni et al. (2011) for example use a much wider range. For this reason we have run a version of our LHS system with (OC/TC)bb factors of 0.66, 0.82 and 0.95, instead of the fac-tors given in Table 3. Figure S1 of the Supplement illustrates the results obtained when we use these new factors.
Comparing these results with Fig. 1, the use of the wider uncertainty range is not seen to affect the main results in any important way. The biggest differences are for the ECbb con-tributions, which are somewhat smaller with the alternative calculation. This is a direct result of allowing (OC/TC)bb values as high as 0.95 (i.e. EC can be only 5 % of TC) in-stead of our default values of 0.82 for PM10and 0.76 for
fine-particles. This component is a small fraction of TC, however, and other components are not very sensitive to this
uncer-tainty. This calculation, along with a wide-range of other (unpublished) tests conducted within other projects utilizing the same basic LHS methodology (Gelencs´er et al., 2007; Szidat et al., 2009; Yttri et al., 2011), confirms that the LHS methodology is quite robust with regard to the main conclu-sions. This conclusion should not be so surprising however, since the methodology is constrained to a large extent by the experimental data.
5.6 Consistency of results
The challenges associated with splitting OCPBAP, OCbb and OCBSOA have already been mentioned (See Sect. 3.3). As we have calculated the two major contributors to PBAP, i.e. OC associated with plant debris and fungal spores, the dominating uncertainty factors for OCBSOA have been ac-counted for. On the other hand, the vast number of sources contributing to this highly heterogeneous group still makes the split between OCBSOA and OCPBAP somewhat uncer-tain. For example, Ceburnis et al. (2011) recently demon-strated a major impact of fine mode PBAP derived from plankton from the marine environment at Mace Head on the West coast of Ireland, which is not accounted for by the PBAP tracers used in the present study. Tire debris is also a source of coarse mode contemporary carbon not accounted for in our source apportionment. Although, natural rubber only constitutes 0.5–3.5 % of the tire’s tread (Edesk¨ar, 2004) a certain contribution of contemporary carbon should be ex-pected.
Emissions from cooking could make a significant contri-bution to contemporary carbon at the urban background site, while we find this less likely at the rural background site. Analysis of cholesterol from the filters could have provided valuable information on this matter, but such measurements have not been undertaken.
Nevertheless, the seasonality, the diurnal variation, and the regional character observed for OCBSOA strongly support that BSOA has been quite successfully separated from other sources of contemporary carbon.
5.7 Carbonaceous mass contributions to PM
The preceding chapters have so far discussed estimates of the different fractions of OC and EC, and their contributions to TC. As shown in Table 4, measurements also included to-tal PM10 and PM1 concentrations. We cannot make a full
mass closure of these PM data as the major ions (SO24−, etc.), and components that could quantify sea-salt or dust contribu-tions, were not measured. However, the information arising from the source-apportionment can be used to estimate the mass contribution which the various TC components make to total PM concentrations.
Further, using one fixed conversion factor will inevitably in-troduce an unknown level of uncertainty, as the source contri-bution varies between sites and seasons. By segregating OC into sub-fractions, and by using conversion factors for each of these, more accurate estimates of the aerosol OM fraction may be obtained. However, experimentally derived conver-sion factors are still scarce and would be needed for a wider range of environments to reduce the uncertainty further.
Reviewing theoretical and historic experimental conver-sion factors, Turpin and Lim (2001) concluded that a range of 1.9–2.3 would cover the aged aerosol, whereas 2.2–2.6 would be representative for the aerosol originating from biomass burning. A factor of 1.2–1.5 was suggested for water insoluble carbonaceous material. Their estimate for the aged aerosol has been supported by the experimentally derived conversion factor for the rural background site K-puszta in Hungary, ranging from 1.9–2.0 (Kiss et al., 2002), whereas a conversion factor of 1.1 was derived for EC. Re-cently, OC:OM ratios derived from aerosol mass spectrome-ter (AMS) measurements have become available, which have confirmed conversion factors around 2 for the aged aerosol and the biomass burning aerosol (e.g. Lanz et al., 2008), although lower values have also been found in many cases (Aiken et al., 2008). AMS measurements have also reported OC:OM ratios of 1.2 for the hydrogenated organic aerosol (HOA) fraction likely to originate from traffic (Lanz et al., 2008). In the present study we have used a conversion factor of 2.0 for OC from wood burning (OCbb) and for SOA. Al-though tentative, as discussed in Sect. 3.9, the split of OCff between ASOA and POA is also used, with an OM:OC fac-tor 2 for the ASOA fraction, and a facfac-tor 1.2 for the primary fraction of OCff. A conversion factor of 1.75 was used for OCpbs and OCpbs, and 1.1 for ECbb and ECff.
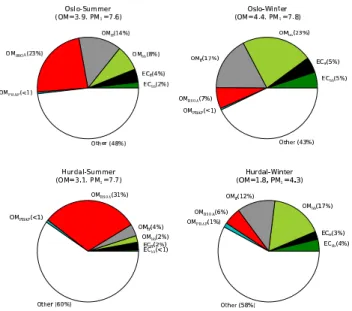
Figures 2 and 3 illustrate the results of this mass closure estimates. These show that that particulate carbonaceous matter, i.e. OM + EC, made significant contributions to the mass concentration of the ambient PM regardless of size frac-tion, season, and site category. In general, there were no pro-nounced differences in the relative contribution of carbona-ceous matter to PM with respect to season or between the two sites, although the “other” category is larger for the rural PM1 results. A somewhat larger fraction of PM1 (ca. 40–
60 %) was accounted for by carbonaceous matter compared to PM10 (ca. 40–50 %). The likely explanation for this
sim-ilarity is simply that Oslo is a relatively small city (ca. 0.6 million inhabitants). Both sites are strongly influenced by long-range transport, providing a common background, and local activities such as wood-burning for heating take place inside Oslo as well as in the countryside affecting Hurdal.
The substantial contribution of carbonaceous aerosol from natural sources to the PM loading in summer should be em-phasized. We found that about about 25 % of the urban back-ground PM1and PM10could be attributed to natural sources,
whereas for the rural background site the contribution was
Fig. 2.Estimated contribution of carbonaceous matter components to PM1. Estimates use central values from LHS analysis. OM, PM1 numbers in parenthesis give total aerosol concentrations and OM in µgm−3. See Sect. 5.7 for assumed OM:OC ratios.
Fig. 3.Estimated contribution of carbonaceous matter components to PM10. Estimates use central values from LHS analysis. OM, PM1numbers in parenthesis give total aerosol concentrations and OM in µgm−3. See Sect. 5.7 for assumed OM:OC ratios.
ca. 30–40 %. In, winter no more than 9 % of the PM load-ing could be attributed to natural sources. Due to the rather low PM experienced during this wintertime sampling at the urban background site (mean PM10 mass concentration of
It is interesting to note that the lack of strong seasonal-ity found here constrasts with results found in central Eu-rope (Lanz et al., 2010), who found much higher OM load-ings in summer compared to winter. Both regions are af-fected by similar sources, namely wood-burning in winter and BSOA in summer, so this difference likely reflects rela-tively higher emissions of BSOA precursors in warmer cen-tral Europe than in Norway.
6 Conclusions
Source apportionment of the ambient summer- and winter time carbonaceous aerosol (PM10 and PM1) has been
con-ducted for one urban and one rural background environ-ment site in Norway. Statistical treatenviron-ment of data from ther-mal optical,14C and organic tracer analysis using Latin Hy-percube Sampling has allowed for quantitative estimates of seven different sources contributing to the ambient carbona-ceous aerosol. These are: elemental carbon from combustion of biomass (ECbb) and fossil fuel (ECff), primary and sec-ondary organic carbon arising from combustion of biomass (OCbb) and fossil fuel (OCff), primary biological aerosol particles (OCPBAP) from plant debris (OCpbc) and fungal spores (OCpbs), and secondary organic aerosol from bio-genic precursors (OCBSOA). Hence, this approach makes it possible to separate between natural and anthropogenic sources, which is highly important in order to sort out abate-ment strategies for reducing man-made emissions.
The results show that particulate carbonaceous matter (PCM) ade significant contributions to the mass concentra-tion of the ambient PM regardless of season (summer/winter) and size fraction (PM10/PM1).
Natural sources (here: BSOA and PBAP) contributed sub-stantially to the rural (70–80 %) and the urban background (40–50 %) of total carbon (TCp) loading during summer for both size fractions. The natural contribution was dominated by BSOA both for the rural (56–71 % of TCp) and the ur-ban background environment (38–40 % of TCp), but also primary biological aerosol particles (PBAP) were found to make a noticeable contribution, (e.g. PBAP accounted for 24 % of TCp in PM10at the rural background site).
Anthropogenic sources (ECff, ECbb, OCff, OCbb), which includes both primary and secondary components, con-tributed the most (>80 %) to TCp during winter, regardless of size fraction and environment. Fossil-fuel derived sources were the major anthropogenic contribution to TCp in sum-mer, whereas there was a shift to wood burning in winter.
The results reported in the present study are highly com-plementary to those of Gelencs´er et al. (2007) and Szidat et al. (2009), applying the same software/methodology, but updated for Norwegian conditions. Together they generate a picture of BSOA being the major contributor to the ru-ral background carbonaceous aerosol during summer, not only for continental Europe, but also for its Northern parts.
In winter, BSOA levels are low, and as in parts of central Europe wood-burning makes the largest contribution. The suggested abundance of BSOA in Scandinavian winter time aerosol needs further investigation, in particular with respect to the potential confounding factors associated with com-pounds from wood burning, and to what extent long range transport and/or increased condensation of BSOA can con-tribute to the observed sources of modern carbon.
Finally, we would emphasize that use of source specific organic tracers,14C and elemental analysis, combined with source apportionment and/or mass-balance approaches pro-vide a much firmer basis for model evaluation than is possible using EC and/or OC measurements alone. The extra informa-tion enables evaluainforma-tion of each component of the model sys-tem (emissions, separation of wood-burning from fossil-fuel sources, SOA formation, etc.). Such data and model evalua-tion are urgently needed before we can claim to understand the carbonaceous aerosol in the atmosphere. These aerosol phase measurements should be supported by simultaneous measurements of the likely biogenic and anthropogenic gas-phase precursors of the secondary carbonaceous aerosol, in-cluding their formation and degradation products.
Supplementary material related to this article is available online at:
http://www.atmos-chem-phys.net/11/9375/2011/
acp-11-9375-2011-supplement.pdf.
Acknowledgements. This work was supported by the Norwegian SORGA Project. The work of D. S. was further supported by the EU 6th Framework Programme EUCAARI project (con-tract 34684), and the Swedish Clean Air Research Program (www.scarp.se), as well as by Cooperative Programme for Mon-itoring and Evaluation of the Long-Range Transmission of Air Pollutants in Europe (EMEP) under UNECE. Christian Dye and Arve Bjerke (NILU), and Heidi Bauer and Karin Kassin (TUV), are thanked for laboratory analysis.
Edited by: A. S. H. Pr´evˆot
References
Achard, F., Eva, H. D., Mollicone, D., and Beuchle, R.: The effect of climate anomalies and human ignition factor on wildfires in Russian boreal forests, Phil. Trans. R. Soc. Lond. B, 363, 2331– 2339, 2008.