J. Serb. Chem. Soc. 74 (8–9) 939–951 (2009) UDC 546.732’742’562’472:547.217.2+
JSCS–3889 547.556.3:541.123.2
Original scientific paper
Metal ion controlled synthesis of 16- and 18-membered
binuclear octaazamacrocyclic complexes with Co(II),
Ni(II), Cu(II) and Zn(II): a comparative spectroscopic
approach to DNA binding to Cu(II) complexes
FARHA FIRDAUS1*, KANEEZ FATMA1, ASAD U. KHAN2 and MOHAMMAD SHAKIR1≠
1
Division of Inorganic Chemistry, Department of Chemistry, Aligarh Muslim University, Aligarh-202002, and 2Interdisciplinary Biotechnology Unit,
Aligarh Muslim University, Aligarh-202002, India (Received 12 January, revised 7 May 2009)
Abstract: A series of 16- and 18-membered binuclear octaazamacrocyclic com-plexes, [M2L1(NO3)4] and [M2L2(NO3)4] (M = Co(II), Ni(II), Cu(II), Zn(II), L1 =
= 3,8,11,16-tetramethyl-1,2,4,7,9,10,12,15-octaaza-3,7,11,15-cyclohexadeca-tetraene and L2 = 3,9,12,18-tetramethyl-1,2,4,8,10,11,13,17-octaaza-3,8,12,17--cyclooctadecatetraene) were synthesized by metal template condensation of N,N’-diacetylhydrazine with 1,2-diaminoethane and 1,3-diaminopropane in methanol. The formation of macrocyclic ligand frameworks, the bonding of the macrocyclic moieties in the complexes and the overall geometry of the com-plexes were deduced based on the results obtained from elemental analyses as well as molar conductivity, FTIR, 1H-, 13C-NMR, EPR, ESI-mass, UV–Vis
spectral studies and magnetic measurements. An octahedral geometry is pro-posed for all the complexes, while a distortion in the octahedral geometry was registered for the Cu(II) complexes. Comparative fluorescence and UV–Vis studies on the Cu(II) complexes proved a significant binding to calf thymus DNA.
Keywords: octaazamacrocycles; Cu(II), Co(II), Ni(II) and Zn(II) binuclear complexes; template condensation; DNA binding studies.
INTRODUCTION
In the last few years, a great deal of research has been aimed at designing macrocyclic compounds and studying their physico–chemical properties.1,2 These investigations emphasized the great relevance of these systems in basic and applied chemistry. Several synthetic strategies are nowadays available for the
* Corresponding author. E-mail: [email protected] ≠
preparation of well-organized molecular systems or molecular devices, which exhibit peculiar physico–chemical properties or have well defined properties.1–4 Among the various synthetic strategies proposed, template condensation is one of the most highlighted. Metal template condensation provides selective routes to-wards products that are not obtainable in the absence of the metal ion.5 The high
thermodynamic stability and extreme kinetic inertness of many transition metal complexes with polyazamacrocyclic ligands are significant, as they enhance im-portant industrial applications.5–7 In particular, the chemistry of tetraazamacro-cycles has received special attention due to their applications in a variety of cata-lysis, biochemical and industrial processes.8 Hexa- and octa-azamacrocycles are
known to give several mononuclear complexes, in spite of the large size of the cavity formed by the macrocyclic backbones, as well as to stabilize various an-ions in their protonated forms.9–11 The synthesis of binuclear complexes has
be-come a point of increasing interest due to their mimicry in terms of physical and chemical properties with the binuclear metal centers in enzymes.12 A number of
binuclear complexes were reported earlier due to their potential relevance in bio-inorganic,13 magneto,14 redox15 and coordination chemistry,16,17 as well as in
homogeneous catalysis.18 In these systems, there is often an additional internal or external bridging group which completes the structure of the binuclear species and has the advantage of being relatively rigid, thus giving structurally well de-fined moieties.19 Binuclear copper-containing proteins play an important role in
biology, including dioxygen transport or activation, electron transfer, reduction of nitrogen oxides and hydrolytic consequences.20 Hence, the design and
synthe-sis of model compounds that mimic the physical and chemical properties of the active sites present in metalloenzymes are essential and the study of such com-pounds is becoming increasingly important in understanding the biological func-tions of bimetallic cores of enzymes.21 In order to extend this work, herein, the
syn-thesis and characterization is reported of novel binuclear octaazamacrocyclic com-plexes resulting from the template condensation of N,N’-diacetylhydrazine with 1,2-diaminoethane and 1,3-diaminopropane, [M2L1(NO3)4] and [M2L2(NO3)4],
where M = Co(II), Ni(II), Cu(II), Zn(II), L1 = 3,8,11,16-tetramethyl-
-1,2,4,7,9,10,12,15-octaaza-3,7,11,15-cyclohexadecatetraene and L2 =
= 3,9,12,18-tetramethyl-1,2,4,8,10,11,13,17-octaaza-3,8,12,17-cyclooctade-catetraene. Finally, the binding of the Cu(II) complexes with DNA were screened.
EXPERIMENTAL Materials and methods
purification. The calf thymus DNA was dissolved to 0.50 % w/w (12.5 mM DNA/phosphate) in 0.10 M sodium phosphate buffer (pH 7.40) at 310 K for 24 h with occasional stirring to ensure the formation of a homogeneous solution. The purity of the DNA solution was checked from the absorbance ratio A260/A280. Since the absorption ratio lay in the range 1.8 < A260/A280 < < 1.9, no further deproteinization of the DNA was required. Stock solutions of the complexes [Cu2L1(NO3)4] and [Cu2L2(NO3)4], synthesized as described below (abbreviated with 1c and
2c) (c = 5 mg/ml) were also prepared.
Synthesis of tetranitrato(3,8,11,16-tetramethyl-1,2,4,7,9,10,12,15-octaaza-3,7,11,15-cyc-lohexadecatetraene)bimetal(II) type of complexes
A methanolic solution (≈ 25 ml) of 1,2-diaminoethane (0.54 ml, 8.0 mmol) and N,N ’-diacetylhydrazine (0.93 g, 8.0 mmol) in methanol (≈ 25 ml) were simultaneously added dropwise to stirred methanolic solution (≈ 25 ml) of metal salt (8.0 mmol). The resultant mixture was stirred for several hours leading to isolation of the solid product, which was then filtered off, washed several times with methanol and dried under vacuum to give the complex [M2L1(NO3)4] (M = Co(II) (1a), Ni(II) (1b), Cu(II) (1c) and Zn(II) (1d)).
Synthesis of tetranitrato(3,9,12,18-tetramethyl-1,2,4,8,10,11,13,17-octaaza-3,8,12,17-cy-clooctadecatetraene)bimetal(II)type of complexes
The procedure was similar to the one mentioned above, except 1,3-diaminopropane (0.67 ml, 8.0 mmol ) was used instead of 1,2-diaminoethane, whereby the complexes [M2L2(NO3)4]
(M = Co(II) (2a), Ni(II) (2b), Cu(II) (2c) and Zn(II) (2d)) were obtained. Binding analysis of complexes 1c and 2c
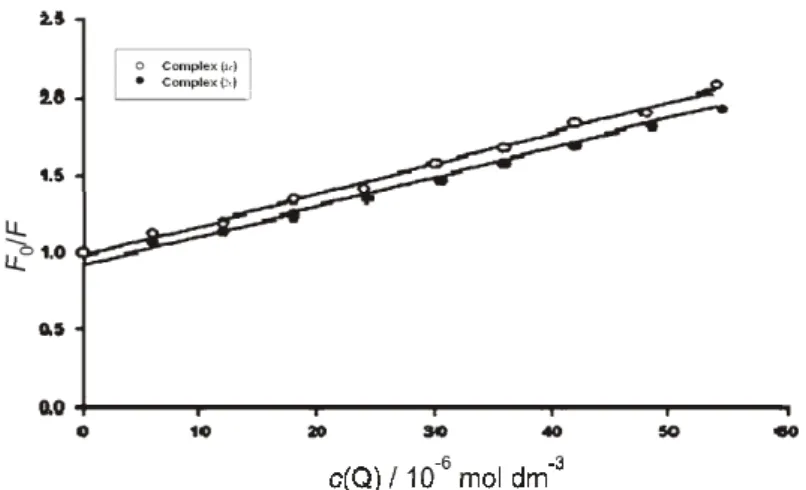
To elaborate the fluorescence quenching mechanism, the Stern-Volmer equation was used for data analysis:22
F0/F = 1+ KSV[Q] (1)
where F0 and F are the steady-state fluorescence intensities in the absence and presence of
quencher, respectively. KSV is the Stern–Volmer quenching constant and [Q] is the
concen-tration of quencher (DNA). The values of Ksv for complexes 1c and 2c were found to be of
the order of 104. The linearity of the F
0/Fvs. [Q] (Stern–Volmer) plots for the DNA–1c and
DNA–2c complexes (Fig. 1) indicates that the quenching may be static or dynamic, since the
characteristic Stern–Volmer plot of combined quenching (both static and dynamic) has an upward curvature. When ligand molecules bind independently to a set of equivalent sites on a macromolecule, the equilibrium between free and bound molecules is given by the equation:23
log [(F0 – F)/F] = log K + nlog [Q] (2) where K and n are the binding constant and the number of binding sites, respectively. Thus, a plot of log (F0 – F)/Fvs. log [Q] can be used to determine K as well as n.
Physical measurements
Elemental analyses were obtained from C. D. R. I. Lucknow, India. The IR spectra (4000–200 cm-1) of the complexes were recorded as CsI/KBr discs on a Perkin-Elmer-621
spectrophotometer. The ESI-mass spectra were obtained by electrospray ionization on a Mic-romass Quattro II triple quadrupole mass spectrometer from C.D.R.I. Lucknow. The 1H- and 13C-NMR spectra were recorded in DMSO-d
6 using a Jeol FT NMR AL-300 MHz
spectro-meter with Me4Si from G. N. D. U. Amritsar India as the internal standard. The electronic spectra of the complexes in DMSO were recorded on Pye-Unicam 8800 spectrophotometer. The magnetic susceptibility measurements were performed using a Faraday balance at 25 °C. The data were corrected for diamagnetic susceptibilities using Pascal’s constants. The EPR spectra of the Cu(II) complexes were recorded as powder samples at room temperature on an E-4 spectrometer using DPPH as the g-marker. The molar conductivity data for 10-3 M
solution in DMSO were recorded on a Systronic type 302 conductivity bridge thermostated at 25.00±0.05 °C. The contents of metals were determined volumetrically.24 Fluorescence
mea-surements were performed on a spectrofluorimeter Model RF-5301PC (Shimadzu, Japan) equipped with a 150W Xenon lamp using a slit width of 5 nm. A 1.00 cm quartz cell was used for the measurements. For the determination of binding parameters, 30 μM of complex so-lution was taken in a quartz cell and increasing amounts of CT DNA soso-lution were titrated. Fluorescence spectra were recorded at 310 K in the range of 740–880 nm with excitation at 280 ( em was 770 nm). The UV measurements of calf thymus DNA were recorded on a
Shi-madzu double beam spectrophotometer model UV 1700 using a 1 cm path length cuvette. Absorbance values of DNA in the absence and presence of complex were measured in the range of 220–300 nm. DNA concentration was fixed at 0.10 mM, while the compound was added in increasing concentrations.
RESULTS AND DISCUSSION
The metal ion controlled reaction of the 1,2-diaminoethane and 1,3-diamino-propane with N,N’-diacetylhydrazine in 1:1:1 molar ratio resulted in the forma-tion of new series of 16- and 18-membered binuclear Schiff-base macrocyclic complexes of the types [M2L1(NO3)4] and [M2L2(NO3)4], where M = Co(II),
mole-cular formulae (Table I). The molar conductivities (Table I) of all the complexes in DMSO corresponded to a non-electrolytic25 nature of these complexes.
Scheme 1.M = Co(II), Ni(II), Cu(II) and Zn(II), X = NO3–, n = 2 for the complex [M2L1(NO3)4] and n = 3 for the complex [M2L2(NO3)4].
Elemental analyses
Anal. Calcd. for [Co2L1(NO3)4] (C12H24Co2N12O12): C, 22.22; H, 3.58; N,
25.82; Co, 18.00. Found: C, 22.30; H, 3.74; N, 26.00, Co, 18.23. Anal. Calcd. for [Co2L2(NO3)4] (C14H28Co2N12O12): C, 24.66; H, 4.09; C, 24.77; Co, 17.38.
Found: C, 24.93; H, 4.18; N, 24.92; Co, 17.47. Anal. Calcd. for [Ni2L1(NO3)4]
(C12H24N12Ni2O12): C, 22.0; H, 3.62; N, 26.00; Ni, 18.14. Found: C, 22.31; H,
C, 24.73; H, 4.15; N, 24.52; Ni, 17.22. Found: C, 24.95; H, 4.18; N, 24.94; Ni, 17.42. Anal. Calcd. for [Cu2L1(NO3)4] (C12H24Cu2N12O12): C, 21.82; H, 3.37;
N, 25.32; Cu, 19.00. Found: C, 21.98; H, 3.69; N, 25.64; Cu, 19.38. Anal. Calcd. for [Cu2L2(NO3)4] (C14H28Cu2N12O12): C, 24.52; H, 4.10; N, 24.32; Cu, 18.28. Found: C, 24.60; H, 4.12; N, 24.58; Cu, 18.59. Anal. Calcd. for [Zn2L1(NO3)4]
(C12H24N12O12Zn2): C, 21.73; H, 3.54; N, 25.21; Zn, 19.62. Found: C, 21.86; H,
3.66; N, 25.49; Zn, 19.83. Anal. Calcd. for [Zn2L2(NO3)4] (C14H28N12O12Zn2):
C, 24.30; H, 4.01; N, 24.39; Zn, 19.00. Found: C, 24.46; H, 4.10; N, 24.45; Zn, 19.02.
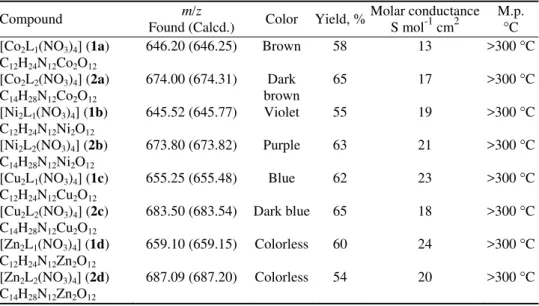
TABLE I.Elemental analyses, m/z values, color, yield, molar conductance and melting point values of the prepared complexes
Compound m/z
Found (Calcd.) Color Yield, %
Molar conductance S mol-1 cm2
M.p. °C [Co2L1(NO3)4] (1a)
C12H24N12Co2O12
646.20 (646.25) Brown 58 13 >300 °C
[Co2L2(NO3)4] (2a)
C14H28N12Co2O12
674.00 (674.31) Dark brown
65 17 >300 °C
[Ni2L1(NO3)4] (1b)
C12H24N12Ni2O12
645.52 (645.77) Violet 55 19 >300 °C
[Ni2L2(NO3)4] (2b)
C14H28N12Ni2O12
673.80 (673.82) Purple 63 21 >300 °C
[Cu2L1(NO3)4] (1c)
C12H24N12Cu2O12
655.25 (655.48) Blue 62 23 >300 °C
[Cu2L2(NO3)4] (2c)
C14H28N12Cu2O12
683.50 (683.54) Dark blue 65 18 >300 °C
[Zn2L1(NO3)4] (1d)
C12H24N12Zn2O12
659.10 (659.15) Colorless 60 24 >300 °C
[Zn2L2(NO3)4] (2d)
C14H28N12Zn2O12
687.09 (687.20) Colorless 54 20 >300 °C
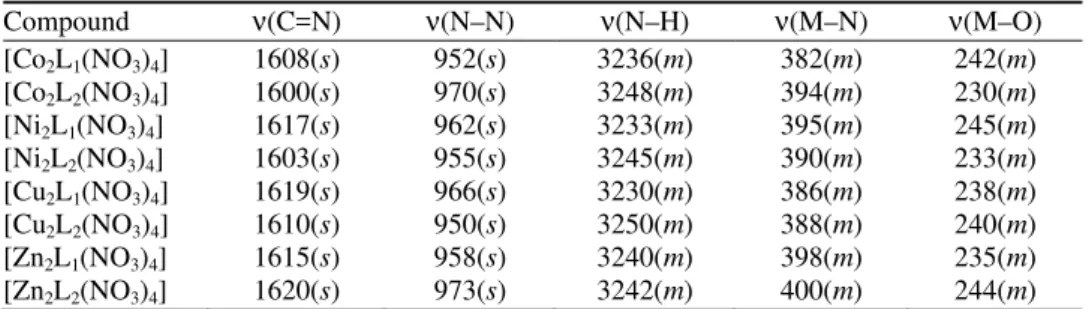
FTIR spectra
The IR spectra of the binuclear complexes of the type [M2L1(NO3)4] and
[M2L2(NO3)4] exhibited characteristic bands of the expected functional groups
and relevant data are given in Table II. The formation of the macrocyclic com-plexes was confirmed by the appearance of a ν(C=N) band26 in the region 1600–
–1620 cm–1 and the absence of the ν(NH2) bands at ≈ 3400 cm–1, indicating that
a Schiff base condensation between the carbonyl group of diacetylhydrazine and the amino group of the alkylamine had occurred. This fact is further supported by the presence of a medium intensity ν(M–N) band, observed in the 382–400 cm–1
region.26 In addition to the above, a medium intensity band appeared in the re-gion 3230–3250 cm–1, which may be assigned to the ν(N–H) stretching vibration
stretching vibration. Moreover, the strong band at around 950–973 cm–1 may be
ascribed to the ν(N–N) stretching mode of the condensed diacetylhydrazine moie-ty.28 The coordination of the nitrato group with the metal was ascertained by the
bands in the 230–245 cm–1 region, which may reasonably be assigned to the
ν(M–O) of the (O–NO2) group. The spectra of the metal complexes gave
additio-nal bands at around 1235–1260, 1028–1060 and 855–870 cm–1, which are con-sistent with the monodentate coordination of nitrate anions.29
TABLE II. IR spectral data (cm-1) of the complexes
Compound ν(C=N) ν(N–N) ν(N–H) ν(M–N) ν(M–O)
[Co2L1(NO3)4] 1608(s) 952(s) 3236(m) 382(m) 242(m)
[Co2L2(NO3)4] 1600(s) 970(s) 3248(m) 394(m) 230(m)
[Ni2L1(NO3)4] 1617(s) 962(s) 3233(m) 395(m) 245(m)
[Ni2L2(NO3)4] 1603(s) 955(s) 3245(m) 390(m) 233(m)
[Cu2L1(NO3)4] 1619(s) 966(s) 3230(m) 386(m) 238(m)
[Cu2L2(NO3)4] 1610(s) 950(s) 3250(m) 388(m) 240(m)
[Zn2L1(NO3)4] 1615(s) 958(s) 3240(m) 398(m) 235(m)
[Zn2L2(NO3)4] 1620(s) 973(s) 3242(m) 400(m) 244(m) 1
H-NMR spectra
The 1H-NMR spectra of the 1d and 2d complexes exhibited resonance peaks
at δ 6.20 and 6.23 ppm for secondary amino protons (4H, –C–NH–N–) and δ 2.09 and 2.15 ppm for imine methyl30 protons (12H, CH
3C=N–) of the
conden-sed diacetylhydrazine moiety. A singlet at δ3.16 and 3.25 ppm for 1d and 2d, respectively, may reasonably be assigned to methylene protons (8H, –N–CH2–C–)
of the condensed amino moiety. While another singlet observed at δ 1.98 ppm may reasonably be assigned to the middle methylene protons (4H, –C–CH2–C–)
of the propane moiety in 2d.31 13
C-NMR spectra
The 13C-NMR spectra for Zn(II) complexes revealed the presence of the imine moiety (>C=N–) at 158 and 160 ppm in both complexes.32 The chemical
shifts of the (>N–CH2–) carbons appear at 45 and 43 ppm for 1,2-diaminoethane
and 1,3-diaminopropane, respectively.30 Moreover, the resonance peaks observed at
22 and 23 ppm correspond to the four methyl carbon adjacent to imine group.30 Another signal observed at 33 ppm was assigned to the middle carbon atom (–CH2–) of the 1,3-diaminopropane moiety.32
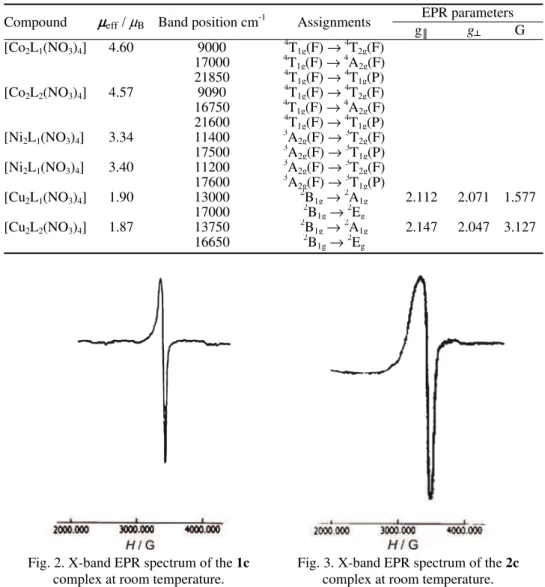
EPR spectra
ex-change interactions between the Cu(II) ions in the unit cell. The calculated g║ va-lues of 2.112 and 2.147 and the g┴ values of 2.071 and 2.047 for 1c and 2c, res-pectively, support the fact that 2B
1g is the ground state, having an unpaired
elec-tron in the dx2–y2 orbital of the Cu(II) ion. Both the complexes show g║ < 2.3, in-dicating that the present complexes exhibit appreciable covalent nature.33 The
observed g║ < 2.0023 for the complexes show that the unpaired electron is locali-zed in the dx2–y2orbital of the Cu(II) ion, which is characteristic of the axial
sym-metry. Tetragonally elongated geometry34 is thus confirmed for the aforesaid com-plexes.
Table III. Magnetic moment values, electronic spectral data with their assignments and EPR spectral parameters of the complexes
Compound µeff/ µB Band position cm-1 Assignments
EPR parameters
g║ g┴ G
[Co2L1(NO3)4] 4.60 9000
4
T1g(F) → 4
T2g(F)
17000 4T1g(F) →
4
A2g(F)
21850 4T1g(F) →
4
T1g(P)
[Co2L2(NO3)4] 4.57 9090
4
T1g(F)→ 4
T2g(F)
16750 4T1g(F)→
4
A2g(F)
21600 4T1g(F) →
4
T1g(P)
[Ni2L1(NO3)4] 3.34 11400
3
A2g(F)→ 3
T2g(F)
17500 3A2g(F)→
3
T1g(P)
[Ni2L1(NO3)4] 3.40 11200
3
A2g(F)→ 3
T2g(F)
17600 3A2g(F)→
3
T1g(P)
[Cu2L1(NO3)4] 1.90 13000
2
B1g→ 2
A1g 2.112 2.071 1.577
17000 2B1g→
2
Eg
[Cu2L2(NO3)4] 1.87 13750
2
B1g→ 2
A1g 2.147 2.047 3.127
16650 2B1g→
2
Eg
Fig. 2. X-band EPR spectrum of the 1c
complex at room temperature.
Fig. 3.X-band EPR spectrum of the 2c
The G values are related by the expression G = (g║ – 2) / (g┴ – 2), and lie in the range 1.577 and 3.127 for the complexes 1c and 2c, indicating a significant exchange interaction35 among the Cu(II) ions in these complexes, as the G values
were less than 4.
Electronic spectra and magnetic susceptibility data
The electronic spectra of the binuclear Co(II) complexes (Table III) showed three bands in the range 9,000, 17,000 and 21,850 cm–1 for 1a and 9,090, 16,750
and 21,600 cm–1 for 2a complexes, attributed to 4T
1g(F) → 4T2g(F), 4T1g(F) →
→4A
2g(F) and 4T1g(F) →4T1g(P)transitions, respectively, consistent with an
octa-hedral geometry36 around the Co(II) ion. The magnetic moment values of 4.60 B for the 1a and 4.57 B for the 2a complex (Table III) correspond to high spin
Co(II) in an octahedral environment. The relatively higher values of the observed magnetic moments than that of the spin only moment (3.89 B) may be attributed in terms of the orbital contribution36 generally observed for Co(II) compounds.
The Ni(II) ion complexes exhibit two absorption bands in the region 11,400 and 17,500 cm–1 for the 1b, and 11,200 and 17,600 cm–1 for the 2b complex,
corresponding to 3A2g(F) →3T2g(F) and3A2g(F) → 3T1g(P) transitions,
respecti-vely, suggesting an octahedral geometry.37 Further confirmation regarding the
oc-tahedral environment around the Ni(II) ion was deduced from the magnetic mo-ment values of 3.34 B and 3.40 B for the 1b and 2b complexes, respectively
(Table III).
The electronic spectra of the hexacoordinated Cu(II) complexes showed three spin allowed transitions in the visible and near IR regions. These bands were as-signed as 2B
1g→2A1g (dx2–y2 – dz2), 2B1g→2B2g (dx2–y2 – dxy) and 2B1g→2Eg
(dx2–y2 – dxz, dyz) transitions in the increasing order of their energies. The energy level sequence will depend on the amount of tetragonal distortion due to the li-gand field and the Jahn–Teller effect.38,39 The electronic spectra of the
com-plexes reported here show two characteristic bands in the range 13000 and 17000 cm–1 for the 1c and 13750 and 16650 cm–1 for the 2c complex. These may reasonably be assigned to 2B
1g→2A1g and 2B1g→2Eg transitions, respectively.
A band corresponding to the 2B
1g→ 2B2g transition was not observed as a
se-parate band, which may be due to tetragonal distortion.39 The observed magnetic
moments of 1.90 B for the 1c and 1.87 B for the 2c complex further supplement
the electronic spectral findings (Table III).
Fluorescence measurements
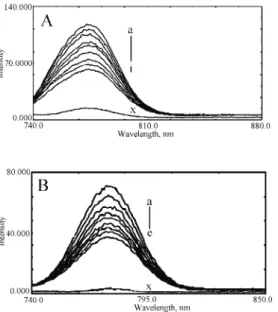
Interactions of DNA with complexes 1c and 2c.Fluorescence spectroscopy
com-pounds at varying DNA concentrations. Representative fluorescence emission spec-tra of the compounds upon excitation at 290 nm are shown in Figs. 4A and 4B. The addition of DNA caused a gradual decrease in the fluorescence emission in-tensity of both compounds, with a conspicuous change in the emission spectra. The spectra illustrate that higher excesses of DNA led to more effective quench-ing of the fluorescence of the fluorophore molecule. The quenchquench-ing of fluores-cence clearly indicates that the binding of the DNA to complexes 1c and 2c chan-ged the microenvironment of the fluorophore residue. The shift in emission peak of the synthesized molecules further depicts an effective interaction at higher DNA concentration, which was more prominent in the case of 1c. The reduction in the intrinsic fluorescence upon interaction with DNA could be due to masking or burial of the fluorophore between the stacked bases within the helix and/or surface binding at the reactive nucleophilic sites on the heterocyclic nitrogenous bases of DNA.
Fig. 4. Fluorescence emission spectra of the complexes in the absence and presence of increasing amounts of DNA. Excitation 290 nm. Fixed concentration of complex (i.e., 4 µM) was titrated in each titration. A concentration of 4 µM DNA (x) was used for DNA alone. Spectra (A) and (B) represent complex 1c and 2c, respect-tively.
The binding parameters for complex 1c and 2cwere found to be K = (8.21± ±0.21)×104 mol–1 dm3, n = 1.1 and K = (0.74±0.11)×104 mol–1 dm3, n = 0.92,
respectively. Pronounced bathochromism was observed with complex 1c, which was negligible with complex 2c. The results suggest that the compounds have va-rying degrees of affinity toward the DNA molecule. This differential binding of 1c and 2c is attributed in terms of different molecular structures around the Cu(II) ion.
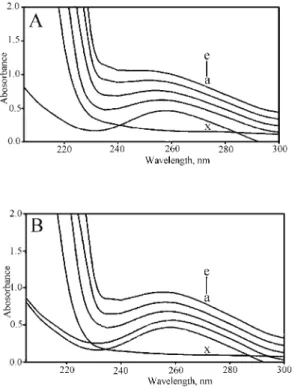
Absorption spectroscopy. UV–Vis absorption studies were performed to
show-ed an increase with increasing complex 1c/2c concentrations (Fig. 5A). Since complexes 1c and 2c do not show any peak in this region (Fig. 5B), the increase in the DNA absorbance is indicative of interaction between DNA and the com-plexes. Both complexes (1c and 2c) exhibited hyperchromism but of varying de-grees. Hyperchromism means the breakage of the secondary structure of DNA. Hence, it is primarily speculated that the complexes interact with the secondary structure of calf thymus DNA, resulting in its breakage and perturbation. After interaction with the base pairs of DNA, the π→π* orbital of the bound ligand can couple with the π orbital of the base pairs, due to the decrease in π→π* transition energy, which results in a bathochromic shift.40 The prominent shift in the spec-tra of 1c suggests more interference of the orbital by the complex 1c molecule. The above changes are indicative of conformational alteration of DNA but of va-ried extent.
Fig. 5. Absorbance spectra of DNA and DNA–1c (A)/2c (B) system. The DNA concentration was 0.10 mM (a); complex concentration for DNA–1c
and 2c complex systems was a) 10, b) 20, c) 30 and d) 40 µM.
CONCLUSIONS
A novel series of 16- and 18-membered Schiff-base binuclear N8
-macrocyc-lic complexes were synthesized and characterized by spectral and elemental ana-lyses. The IR spectra of the complexes showed the absence of bands correspond-ing to the ν(C=O) and ν(NH2) group of diacetylhydrazine and alkylamine
to the ν(C=N) stretching vibration. This suggests the formation of the macrocyc-lic framework, which was further substantiated by the 1H- and 13C-NMR spectra. Confirmation regarding the stoichiometry, nature and overall geometry around the metal ion was further deduced from the electronic, ESI-mass, EPR spectra, mag-netic moment values and conductivity measurements. Fluorescence and absorp-tion measurements demonstrated a considerable interacabsorp-tion between the Cu(II) complexes 1c and 2c and CT DNA.
Acknowledgements.The Chairman, Department of Chemistry, Aligarh Muslim Univer-sity, Aligarh, India, is acknowledged for providing the necessary research facilities. The au-thors are thankful to Prof. R. J. Singh, Department of Physics, AMU, Aligarh, for the dis-cussion of the EPR spectra.
16-
Co(II), Ni(II), Cu(II) Zn(II) Ј :
Њ DNA Cu(II)
FARHA FIRDAUS1, KANEEZ FATMA1, ASAD U. KHAN2 MOHAMMAD SHAKIR1
1
Division of Inorganic Chemistry, Department of Chemistry, Aligarh Muslim University, Aligarh-202002 и 2
Interdisciplinary Biotechnology Unit, Aligarh Muslim University, Aligarh -202002, India
16- 18- ,
[M2L1(NO3)4] [M2L2(NO3)4] (M = Co(II), Ni(II), Cu(II), Zn(II), L1 = 3,8,11,16- -
-1,2,4,7,9,10,12,15- -3,7,11,15- L2 = 3,9,12,18-
--1,2,4,8,10,11,13,17- -3,8,12,17- )
-N,N’- 1,2- 1,3-
-. ђ ,
,
, FT-IR, 1H, 13C-NMR, EPR, ESI- , UV–Vis
. ,
Cu(II) .
UV–Vis Cu(II) DNA .
( 12. , 7. 2009)
REFERENCES
1. S. Anbu, M. Kandaswamy, P. S. Moorthy, M. Balasubramanian, M. N. Ponnuswamy, Polyhedron28 (2009) 49
2. H. Zhou, Z. H. Peng, Z. Q. Pana, Y. Song, Q. M. Huang, X. L. Hu, Polyhedron26 (2007) 3233
3. P. Zanello, S. Tamburini, P. A. Vigato, G. A. Mazzocchin, Coord. Chem. Rev. 77 (1987) 165 4. J. M. Lehn, Pure. Appl. Chem. 50 (1978) 871
5. F. Firdaus, K. Fatma, M. Azam, S. N. Khan, A. U. Khan, M. Shakir, Transition Met. Chem. 33 (2008) 467
6. L. Mishra, K. Bindu, S. Bhattacharya, Spectrochim. Acta A61 (2005) 807
8. A. K. Mohamed, K. S. Islam, S. S. Hasan, M. Shakir, Transition Met. Chem. 24 (1999) 198
9. L. Branco, J. Costa, R. Delgado, M. G. B. Drew, V. Felix, B. J. Goodfellow, J. Chem. Soc. Dalton Trans. (2002) 3539
10. J. L. Karn, D. H. Busch, Inorg. Chem. 8 (1969) 1149
11. C. Cruz, S. Carvalho, R. Delgado, M. G. B. Drew, V. Felix, B. J. Goodfellow, J. Chem. Soc. Dalton Trans. (2003) 3172
12. H. Adams, D. E. Fenton, S. R. Haque, S. L. Heath, M. Ohba, H. Okawa, S. E. Spey, J. Chem. Soc. Dalton Trans. (2000) 1849
13. S. L. Jain, P. Bhattacharyya, H. L. Milton, A. M. Z. Salwin, J. A. Crayston, J. D. Woollins, J. Chem. Soc. Dalton Trans. (2004) 862
14. M. H. Klingele, B. Moubaraki, J. D. Cashion, K. S. Murray, S. Brooker, Chem. Commun. (2005) 987
15. S. Brooker, Coord. Chem. Rev. 222 (2001) 33
16. E. Jabri, M. B. Carr, R. P. Hausinger, P. A. Karplus, Science268 (1995) 998 17. B. Linton, A. D. Hamilton, Chem. Rev. 97 (1997) 1669
18. S. O. Kang, M. Kim, J. Am. Chem. Soc. 125 (2003) 4684
19. C. Lodeiro, R. Bastida, E. Bertola, A. Macias, A. Rodriquez, Polyhedron22 (2003) 1701 20. M.A. De Rosch, W. C. Trogler, Inorg. Chem. 29 (1990) 2409
21. D. E. Fenton, H. Okawa, Perspectives in Bioinorganic Chemistry, JAI Press, London, 1993, p. 8
22. A. M. Pyle, J. P. Rehmann, R. Meshoyrer, C. V. Kumar, N. J. Turro, J. K. Barton, J. Am. Chem. Soc. 111 (1989) 3051
23. X. Z. Feng, Z. Lin, L. J. Yang, C. L. Bai, Talanta47 (1998) 1223 24. C. N. Reilly, R. W. Schmid, F. A. Sadak, J. Chem. Educ. 36 (1959) 619 25. W. J. Geary, Coord. Chem. Rev. 7 (1971) 81
26. D. P. Singh, R. Kumar, V. Malik, P. Tyagi, J. Enzyme Inhib. Med. Chem. 22 (2007) 177 27. S. I. Mostafa, T. H. Rakha, M. M. El-Agez, Indian J. Chem. 39A (2000) 1301
28. X. Wang, X. Han, W. Lu, X. Liu, D. Sun, Synth. React. Inorg. Met.-Org. Chem. 22
(1992) 1169
29. K. Fujisawoa, T. Kobayashi, K. Fujita, N. Kitajima, Y. Moro-oka, Y. Miyashita, Y. Yamada, K. Okamoto, Bull. Chem. Soc. Jpn. 73 (2000) 1797
30. M. Shakir, N. Begum, S. Parveen, P. Chingsubam, S. Tabassum, Synth. React. Inorg. Met.-Org. Chem. 34 (2004) l135
31. M. Shakir, Y. Azim, H. T. N. Chishti, N. Begum, P. Chingsubam, M. Y. Siddiqi, J. Braz. Chem. Soc. 17 (2006) 272
32. A. Bansal, S. Kumar, R. V. Singh, Synth. React. Inorg. Met.-Org. Chem. 31 (2001) 1085 33. B. Jezowska, J. Lisowski, A. Vogt, P. Chemielewski, Polyhedron7 (1988) 337
34. S. Chandra, L. K. Gupta, Spectrochim. Acta, Part A60 (2004) 2767 35. I. M. Procter, B. N. Hathaway, P. Nicholls, J. Chem. Soc. A (1968) 1678
36. A. B. P. Lever, Inorganic Electronic Spectroscopy, 2nd ed., Elsevier, Amsterdam, 1984 37. F. A. Cotton, G. Wilkinson, Advanced Inorganic Chemistry, 5th Ed., Wiley, New York,
1988
38. K. G. Kocwin, W. Wojciechowski, Transition Met. Chem. 21 (1996) 312 39. S. N. Choi, E. R. Menzel, J. R. Wasson, J. Inorg. Nucl. Chem. 39 (1977) 477