Article
Solution and Solid State Thermal Stability of Morpholinedithiocarbamates
Patrícia A. Antunesa, Susete T. Breviglieria, Gilberto O. Chiericea and Éder T. G. Cavalheirob *
a
Instituto de Química de São Carlos, Universidade de São Paulo, CP 780, 13560-970, São Carlos - SP, Brazil
b
Departamento de Química, Universidade Federal de São Carlos, CP 676, 13565-905, São Carlos - SP, Brazil
Estudos termogravimétricos e calorimétricos diferenciais de morfolinoditiocarbamatos de NH4+,
Mn2+, Co2+, Ni2+ e Cu2+ foram realizados em atmosferas de ar e nitrogênio, para avaliar a influência
da presença do oxigênio como heteroátomo no anel da amina na decomposição térmica. Produtos de decomposicão térmica foram caracterizados através de difratogramas de raios X, sendo predominantemente formados por sulfetos metálicos, sob atmosfera dinâmica de nitrogênio e óxidos metálicos, sob ar. Usando espectrofotometria, também foram determinados o pKa = 3,56 para o ácido morfolinoditiocarbâmico em força iônica 0,50 mol dm-3 (NaClO
4) à 25,0 °C e parâmetros
cinéticos de decomposição em diferentes valores de pH (klim = 0,14 ± 0,04 s-1 e t
½ lim = 5,3 ± 1,2 s).
Thermogravimetric and differential scanning calorimetric investigation of the thermal behavior of NH4+, Mn2+, Co2+, Ni2+ e Cu2+ morpholinedithiocarbamates were performed under nitrogen and air
atmospheres in order to investigate the effect, in the thermal decomposition, of the presence of an oxygen as the heteroatom in the amine ring. Decomposition products were identified by their X-ray diffraction patterns. Metal sulfites and oxides were the major residues under nitrogen and air atmospheres, respectively. Spectrophotometric measurements were used to estimate the pKa =3.56 for the morpholinedithiocarbamic acid at 0.50 mol dm-3 ionic strength (NaClO
4) at 25.0 °C and kinetic
parameters of decomposition at different pH values (klim = 0.14 ± 0.04 s-1 e t
½ lim = 5.3 ± 1.2 s). Keywords: morpholinedithiocarbamates, thermogravimetry, differential scanning calorimetry,
decomposition rate constant
Introduction
Recently, the interest in the stability of dithiocarbamates (DTC) has been renewed by the utilization of such compounds as coadjuvants in the treatment of AIDS1,2. They
have also been suggested for tuberculosis3 and cancer4
treatment in the past. In these applications the compound must have enough chemical stability for an effective action in the biological medium. The DTC are obtained by the reaction between a primary or secondary amine with carbon dissulfide in a basic aqueous solution. The applications of this class of compounds in medicine, agriculture, industry, analytical and organic chemistry, as well as their physicochemical properties are summarized in several review articles5-14. From these works and references cited
therein it is known that DTC derived from cyclic amines are more stable than the aliphatic derivatives. Additionally the thermal behavior is another important feature in industry and agriculture applications.
The stability of DTC in solution is pH dependent and was investigated by different authors15-21. Chakrabarti and
co-workers18-21 proposed a decomposition intermediate in
which the water plays an important role.
Since the decomposition of the DTC’s is very fast in acidic media a spectrophotometric method based on diode-array measurements has recently been proposed22, for a
more accurate determination of the pKa of dithiocabamic acids. A correlation between the infrared spectroscopy data of the coordination nature of cyclic DTC complexes and its effect in thermal decomposition of such compounds has also been presented23,24.
In this work, the pKa value of the morpholinedithio-carbamic acid (HMor) was determined (I = 0,50 mol dm-3),
by absorption spectrophotometry in the ultra-violet region, and used to estimate the rate of decompostion of morpholinedithiocarbamate (Mor) in different pH values. The thermal behavior of solid state complexes of the type [MMor2]·xH2O (M = Mn(II), Co(II), Ni(II) and Cu(II), x = 0 or 1.75) was studied in order to investigate the effect of the presence of an oxygen heteroatom in the amine ring and on
parameters such as atomic radius of the metal center and character of coordination (mono or bidentate) on the thermal behavior.
Experimental
DTC synthesis and characterization
The Mor ammonium salt was obtained by the reaction between the carbon disulfide and morpholine, in the presence of ammonium hydroxide22,25, in an ethanol/water 1:1 (v/v)
reaction media. The white solid thus obtained was washed with cold ethanol and then crystallized by dissolving in water, followed by addition of ethanol. The solution was frozen and the white needle crystals formed were dried in a vacuum oven at 50°C for 8 h and characterized by vibrational spectroscopy and elemental analysis. The metal complexes were obtained by direct reaction of the DTC ammonium salt and CuCl2.2H2O, NiCl2.6H2O, CoCl2.6H2O or MnCl2.2H2O. The resulting precipitates were filtered off, washed with water and then with ethanol. Finally they were dried and characterized as above.
Buffer solutions
The McIlvaine buffer solutions with ionic strength adjusted to 0.50 mol dm-3 (NaClO
4) were prepared
according to the procedure described by Elving et al26.
The pH values of these buffers were measured with a glass electrode calibrated with solutions of ionic strength 0.50 mol dm-3 (NaClO
4), hydrogen ion concentration 1.00 x
10-2 and 1.00 x 10⁻⁴ mol dm-3 (HClO
4), corresponding to
pH 2.00 and 4.00, respectively27.
Equipment
Characterization of the complexes was performed by IR vibrational spectroscopy (KBr pellets) with a Bomem MB-102 spectrophotometer; flame atomic absorption spectroscopy was carried out in an Hitachi Z-8100 spectrophotometer and C,N,H contents were determined by elemental analysis using a Fisons EA 1108 CNHS-O instrument.
Thermogravimetric (TG) curves were recorded in a DuPont 9900 thermoanalyser coupled with a TGA 951 Thermogravimetric Module under a gas flow of 1.67 cm3
s-1 (N
2 or air), in a platinum crucible, at 0.167 °C s-1 heating
rate and using samples of about 7 mg of compound at atmospheric pressure. The differential scanning calorimetric (DSC) curves were recorded in a DuPont 9900 thermoanalyser coupled with a DSC 910 Calorimetric Module under a gas flow of 1.67 cm3 s-1 (N
2 or air), in
covered aluminum pans, at 0.167 °C s-1 heating rate and
using samples of about 5 mg of compound at atmospheric pressure. The cell was previously calibrated for temperature and energy using indium metal (99.9+%) as standard.
Intermediates of thermal decomposition process were obtained in an oven at the same temperature and atmosphere that they appeared in the TG curves. After 15 min they were cooled down and kept in a dissecator under vacuum. The X-ray patterns of the crystalline residues were recorded in a VEB-Karl Zeiss Jena URD6 diffractometer. The results were compared with standard data from the International Centre for Diffraction Data, for characterization.
A diode-array Hewlett-Packard HP 8451A spectro-photometer and quartz cells, 1.00 cm path length, were used in the spectrophotometric measurements. The pH values were measured with a Corning IA 250 coupled to a Metrohm EA 121 combined glass electrode and X-ray diffraction patterns of intermediate and final products of thermal decomposition, with an HZG4-Karl Zeiss Jena diffractometer.
Procedure for pKa determination
The spectrophotometric method used for pKa determination was described earlier22. All the spectrophotometric measurements
were carried at 25.0 ± 0.1 °C, using buffered solutions as blanks. Stock NH4Mor solutions (1.0x10⁻² mol dm-3) were used
in the preparation of working solutions, with concentration ranging from 1.70 x 10⁻⁵ to 8.40 x 10⁻⁵ mol dm-3 at pH 2.66
and 5.22 NH4Mor solution 1.0 x 10⁻⁴ mol dm-3 NH 4Mor
solution was used in the determination of the maximum absorption wavelength, of the acidic and basic forms, in pH ranging from 2.87 to 5.15. In order to minimize the decomposition of the compounds, the solutions were prepared directly in the cells. Thus an appropriate volume of the stock solution of NH4Mor was transferred with an automatic pipette and introduced in the buffer solution reaching a final volume of 3.00 cm3.
Results and Discussion
complex is in agreement with previous observations for Co-DTC complexes24 and is confirmed by a mass loss
starting at the begning of the TG curves and by an endothermic process in DSC (Figures 2 and 3).
All the complexes showed a split IR absorption band around 1000 cm-1, indicating that the ligand presents
a monodentate behavior according to Sharma6 and
Nakamoto28.
The characteristic C–N stretching vibrational mode is observed at 1493-1415 cm-1 and is less intense than that
Table 1. Percentages of carbon, hydrogen and nitrogen found and (calculated) and the main infrared bands (cm-1) for the morpholinedithio-carbamates
studied in this work.
Compound Metal C H N ν(C-S) ν(C-O-C) ν(C-N) ν(M-S)
NH4Mor - 33.3(32.4) 6.7(6.6) 15.5(15.2) 0983,1018 1102 1415
-MnMor2 14.0(14.5) 30.8(31.6) 4.1(4.2) 7.2(7.4) 1018,1024 1110 1471 372
CoMor2.1.75H2O 12.8(14.7) 28.9(28.9) 4.0(4.7) 6.7(6.8) 1000,1015 1110 1484 359
NiMor2 15.3(15.3) 31.0(31.3) 4.1(4.2) 7.3(7.3) 1000,1018 1110 1493 385
CuMor2 16.7(16.4) 30.4(30.9) 4.1(4.2) 7.2(7.4) 1000,1018 1109 1483 340
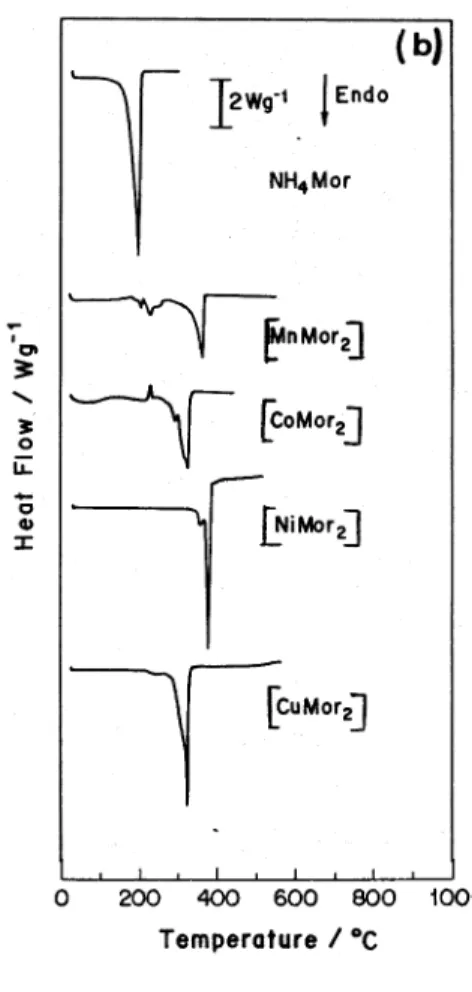
Figure 2.TG (solid)/DTG(dashed) (a) and DSC (b) curves under nitrogen flow of 100 cm3 min-1, other conditions as in the text.
O N
S S
C N
S S
C N
S S C
a b c
Figure 1. Structures of cyclic dithiocarbamates derived from (a) Morpholine, (b) Piperidine and (c) Pyrrolidine.
observed for alkyl DTC derivatives due to the low double bond character caused by the rigid ring system29. The
pKa determination
The use of diode array data for pKa determination is convenient since the decomposition of DTC occurs very fast in acidic media18-21. The decomposition rate depends
on the amine substituents. The procedure considers that the total absorbance at a given wavelength is due to the sum of the absorbances of the protonated (HMor) and free (Mor-) forms of the DTC:
AA = εA,HMor[Hmor] + εA,Mor-[Mor-] (1)
AB = εB,HMor[HMor] + εB,Mor-[Mor-] (2)
where, AA and AB are the absorbances in the wavelengths A and B, respectively, εA,HMor and εA,Mor- are the molar
absorptivities of the protonated and free forms in the wavelength A, and [HMor] and [Mor-] are the concentrations
of the protonated and free forms, respectively. The absorptivity coefficients can be obtained from the slopes of
A vs [Mor -] plots, at the maximum wavelengths in acidic
and basic media. On solving equations (1) e (2), it is possible to determine the [Mor-]/[HMor] ratio. Then, measuring the absorbances at different pH values the pKa can be determined by the Henderson-Hasselbach equation:
[ ]
[
HMor]
Mor log pH
pK= − − (3)
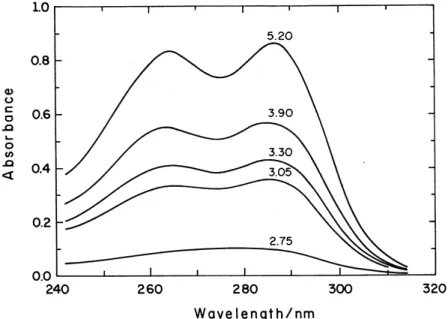
The maximum wavelength of the protonated HMor form was observed at 286 nm. The free form presented two maxima at 264 and 288 nm. For best resolution, 264 nm (basic, ε = 2.14 x 103 cm-1 mol dm-3) and 286 nm (acidic, ε = 2.06 x 103 cm-1
mol dm-3) were used in the pKa determination. The results are
summarized in Table 2 and pKa = 3.56 ± 0.57 was obtained. Values of pKa around 5.20 were previously reported, using polarographic31 and spectrophotometric32 methods,
An important point in favor of the present results are the changes in spectral shape when the pH is changed from 2.75 to 5.20 (Figure 4). According to Vandebeek et al20,
the acidic form of a DTC presents only one peak in UV, while the basic form presents two peaks. Figure 4 shows that from pH 3.30 two peaks are clearly observed evidencing the presence of a significant amount of the basic form. If the pKa was 5.20, the ratio [Mor-]/[HMor] = 0.02
at pH 3.52 and only one peak should be observed at UV spectra at such conditions.
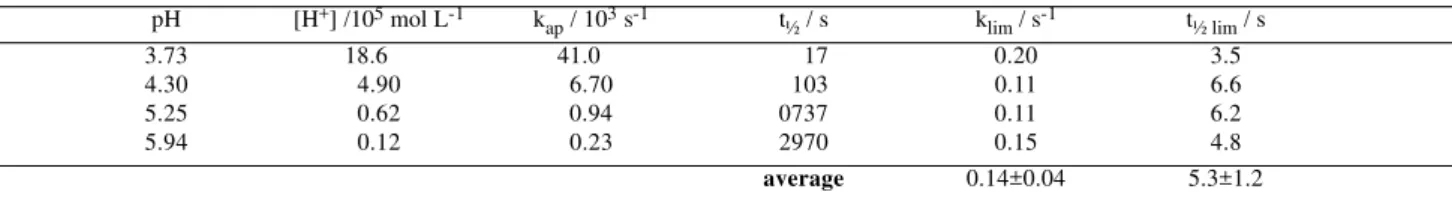
Decomposition kinetics
The decomposition of NH4Mor was followed by the absorbance decay of the peak at 286 nm at different pH values. The lnA/A0 vs. time plots showed a linear dependence suggesting a pseudo-first order kinetics with slope equal to kap.
The decomposition of dithiocarbamates was investigated by Chakrabarty and co-workers18-21.
According to these authors the rate of decomposition in basic media is dependent of the pH ([H+]<<Ka) but in
sufficiently acidic solutions ([H+]>>Ka) it becomes
constant (kap≈ klim), according to:
[ ]
[ ]
+
= + +
Ka H
H k
kap lim (4)
in which kap is the apparent rate constant from ln A/A0 vs. time plots, klim is the limiting rate constant at low pH and Ka is the acidic dissociation constant.
The results obtained for Mor-, in Table 3, and show
that the presence of the oxygen in the morpholine ring makes it less stable than the analogous piperidinedithio-carbamate (t½lim = 10 s) and the 5 membered ring pyrrolidine derivative (t½lim = 1620 s)22.
Thermal decomposition of solid state complexes
The thermal processes, residues formed, mass losses and temperature ranges observed in each step of the TG/ DTG and DSC curves are given in Table 4. When crystalline intermediates were obtained they have been characterized on the basis of their X-ray diffraction patterns, compared with literature data33 (see Table 5). The TG/DTG and DSC
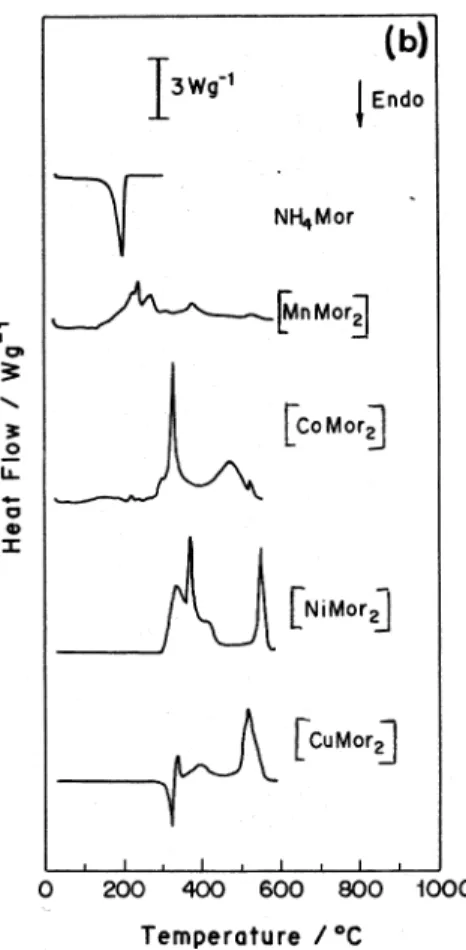
curves are presented in Figure 2 under N2 and in Figure 3 under air.
a) Thermal decomposition under nitrogen
The ammonium salt showed complete volatilization between 105-205 °C, without residue on the crucible. IR spectra of the original and condensed salts confirmed the sublimation phenomena.
Presence of hydration water in [CoMor2] is confirmed in TG/DTG and DSC experiments. The TG curves of the metal complexes showed decomposition in a single step, except for [MnMor2]. The first products of thermal Table 2. pKa determination results for HMor (I = 0.50 mol dm-3, 25 °C).
pH absorbance [Mor-]/[HMor] pKa
264 nm 286 nm
2.62 0.126 0.134 0.267 3.20
3.25 0.317 0.339 0.341 2.78
3.73 0.463 0.492 0.980 3.74
4.76 0.615 0.643 1.750 4.52
average 3.56 ± 0.57
Table 3. NH4Mor decomposition kinetic data at different pH values in ionic strength 0.50 mol dm-3 (NaClO4).
pH [H+] /105 mol L-1 k
ap / 103 s-1 t½ / s klim / s-1 t½ lim / s
3.73 18.600 41.000 0017 0.20 3.5
4.30 4.90 6.70 0103 0.11 6.6
5.25 0.62 0.94 0737 0.11 6.2
5.94 0.12 0.23 2970 0.15 4.8
average 0.14±0.04 5.3±1.2
Table 4. Thermal degradation data of the compounds in nitrogen and air atmospheres, in thermogravimetry, showing the thermal process, the interval of temperature (∆T), mass losses (∆m) obtained (obt) and calculated (clc), or residue (res) and by differential sacanning calorimetry, indicating the temperature of the peak (T), the nature of the endothermic (endo) or exothermic (exo) process.
Thermal Process ∆T / °C ∆m / % DSC Data
(TG) obt clc T / °C
N2 Atmosphere
NH4Mor(s) → NH4Mor(g) 105-205 100a 100 198 (endo)
[MnMor2] → Mn(SCN)2 + CRd 44-270 50.0b _ 210, 233 (endo)
Mn(SCN)2→ MnS2 + MnS + CRd 270-525 24.1b _ 365 (endo)
MnS2 + MnS + CRd
excess→ MnS + CRd 636-739 17.5b _ _
MnS + CRd→ Mn 739-900 14.1b 14.5 _
[CoMor2]·1.75H2O → CoMor2 + 1.75 H2O(g) 40-243 7.1a 7.6 72 (endo),229 (exo)
[CoMor2] → CoS + CRd 243-360 33.5b _ 294, 326 (endo)
CoS + CRd→ CoS + Co 360-700 23.8b _ _
[NiMor2] → NiS + CRd 285-400 21.3b _ 357, 380(endo)
NiS + CRd→ Ni 400-750 15.8b 15.3 _
[CuMor2] → Cu1.8Sc 266-500 20.6b 21.3 321 (endo)
Cu1.8S → Cu1.92Sc 500-750 21.8b 21.0 _
Cu1.92S → Cu7S4c 750-870 20.2b 21.0 _
Air Atmosphere
NH4Mor(s) → NH4Mor(g) 105-200 100a 100 198 (endo)
[MnMor2] → MnSO4 + MnxOy 180-352 33.8b _ 225, 240, 275 (exo),
300, 333 (endo)
MnSO4 + MnxOy→ Mn3O4 750-830 20.2b 20.1 _
[CoMor2]·1.75H2O → CoMor2 + 1.75 H2O(g) 40-243 7.2a 7.6b 70 (endo)
[CoMor2] → CoOc + Co2O3c 243-450 39.0b _ 330 (exo)
CoO + Co2O3→ Co3O4c 600-747 21.6b 21.0 _
[NiMor2] → NiSc 285-335 24.8b 23.7 338 (exo)
NiS → NiOc 645-750 21.2b 19.5 _
[CuMor2] → CuS + CuO 270-600 23.8b _ 323 (endo),
338 (exo)
CuS + CuO → CuOc 600-700 20.9b 20.5 _
arelative to mass loss; brelative to residue; ccharacterized by X-ray diffraction pattern – see Table 5; dCR = carbonaceous residue.
decomposition are the corresponding sulfides and/or carbon. At higher temperatures the presence of carbon produced metallic Mn, Co and Ni and Cu2S for the respective DTC. The DSC peaks were in agreement with TG results.
Heating [MnMor2] in a glycerin bath at 270°C in a 20 cm long glass tube led to the condensation of a white substance, whose IR spectrum suggested the presence of Mor- bands and whose decomposition is probably related
with the loss of dithiocarbamate.
Although some DTG and DSC curves presented shoulders suggesting that the decomposition occurs in more
than one step, stoichiometric calculations do not lead to the conclusion that decomposition proceeds via a thyocianate intermediate. This is in agreement with previous findings for piperidinedithiocarbamate23,24, also
a 6-membered amine ring derivative.
b) Thermal decomposition under air
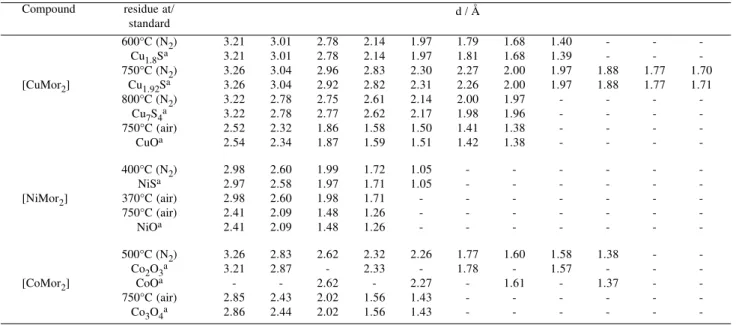
Table 5. X-ray data for the residues at different temperatures compared with literature standards33.
Compound residue at/
standard
600°C (N2) 3.21 3.01 2.78 2.14 1.97 1.79 1.68 1.40 - -
-Cu1.8Sa 3.21 3.01 2.78 2.14 1.97 1.81 1.68 1.39 - -
-750°C (N2) 3.26 3.04 2.96 2.83 2.30 2.27 2.00 1.97 1.88 1.77 1.70
[CuMor2] Cu1.92Sa 3.26 3.04 2.92 2.82 2.31 2.26 2.00 1.97 1.88 1.77 1.71
800°C (N2) 3.22 2.78 2.75 2.61 2.14 2.00 1.97 - - -
-Cu7S4a 3.22 2.78 2.77 2.62 2.17 1.98 1.96 - - -
-750°C (air) 2.52 2.32 1.86 1.58 1.50 1.41 1.38 - - -
-CuOa 2.54 2.34 1.87 1.59 1.51 1.42 1.38 - - -
-400°C (N2) 2.98 2.60 1.99 1.72 1.05 - - -
-NiSa 2.97 2.58 1.97 1.71 1.05 - - - - -
-[NiMor2] 370°C (air) 2.98 2.60 1.98 1.71 - - -
-750°C (air) 2.41 2.09 1.48 1.26 - - -
-NiOa 2.41 2.09 1.48 1.26 - - - - - -
-500°C (N2) 3.26 2.83 2.62 2.32 2.26 1.77 1.60 1.58 1.38 -
-Co2O3a 3.21 2.87 - 2.33 - 1.78 - 1.57 - -
-[CoMor2] CoOa - - 2.62 - 2.27 - 1.61 - 1.37 -
-750°C (air) 2.85 2.43 2.02 1.56 1.43 - - -
-Co3O4a 2.86 2.44 2.02 1.56 1.43 - - - - -
-a- data from reference 33.
Table 6. Starting decomposition temperatures obtained form TG data for Mor complexes compared with Pyr and Pip analalogues.
metal starting decomposition temperature / °C
Mor Pipa Pyra
N2 atmosphere
Co(II) 243b 232b 267b
Ni(II) 285 272b 284
Cu(II) 266 215b 258b
Air atmosphere
Co(II) 243b 211b 256b
Ni(II) 285 297b 296
Cu(II) 270 205b 240b
a - data from reference 24; b - after dehydration.
These compounds are converted to the respective oxides at higher temperatures (see Table 4).
The manganese complexes showed a mass gain before decomposition. This is probably related to the addition of an oxygen atom to the complex, according to elemental analysis data, which may be related to the presence of sulfate as decomposition product in this case.
TG/DTG and DSC results confirmed the presence of water in [CoMor2]. The endothermic process at 310 °C in DSC of [CuMor2] suggests an initial reduction of the metal at the beginning of the decomposition process. Other DSC peaks were in agreement with TG/DTG data.
In Table 6 starting decomposition temperatures are summarized for some [MMor] complexes (M = Co(II), Ni(II) and Cu(II)) in comparison with Pyr and Pip analogue complexes. These data suggest that the presence of the oxygen atom in the amine ring makes the Mor derivatives thermally more stable than Pip analogues. This should be related with the oxygen tendency to concentrate the electronic density thereby weakening the N-C bond in
relation to Pip. The less tense 5-membered Pyr ring results in complexes more stable than the corresponding Mor and Pip complexes.
Conclusions
The presence of the oxygen as heteroatom in the amine ring makes HMor a stronger acid than the equivalent piperidinedithiocarbamic acid (HPip). The limiting half life (t1/2 lim) suggests that Mor- is slightly less stable than
piperidinedithiocarbamate (Pip) and much less stable than pyrrolidinedithiocarbamate (Pyr)23.
In all complexes the ligand presented coordination in a monodentate way and [MnMor2] was the only one that seemed to decompose via a thyocianate intermediate. The starting decomposition temperatures followed the order: Pyr>Mor>Pip for similar metallic complexes24 under both
atmospheres.
In relation to the metal, the thermal stability order was: [MnMor2] < [CoMor2] < [NiMor2] > [CuMor2], showing that the smaller the metallic radius, the more stable the complex, which is in agreement with previous observations23,24,34.
References
1. Rabbi, M. F.; Finnegan, A.; Al-Hartli, L.; Stong, S.; Roebuck K. A. Journal of Acquired Immune Deficiency Syndromes and Human Retrovirology
1998,19, 321.
2. Topping, R. M.; Jones, M. M. Med. Hipothesys 1989,
27,55.
3. Weuffen, A.; Kewitsch, A. Arch. Exp. Veterinaermed.
1967, 21,1049.
4. Powell, A. K. Brit. J. Cancer 1954,8, 529.
5. Hill, J. O.; Chirawongaram, S. J. Thermal Anal. 1994,
41, 511.
6. Sharma, A. K. Thermochim. Acta 1986, 104, 339.
7. Magee, R. J.; Hill, J. O. Rev. Anal. Chem. 1985, 8,5.
8. Bond, A. M.; Martin, R. L. Coord. Chem. Rev. 1984,
54,23.
9. Sengupta, S. K.; Kumar, S. Termochim. Acta 1984,
72, 349.
10. Hill, J. O.; Magee, R. J. Rev. Inorg. Chem. 1981,3, 141.
11. Coucovanis, D. Progr. Inorg. Chem. 1979, 26, 301.
12. Coucovanis, D. Progr. Inorg. Chem. 1970,11,233.
13. Hulanicki, A. Talanta 1967,14, 1371.
14. Thorn, G. D.; Ludwig, R. A. The Dithiocarbamates and Related Compounds, Elsevier; Amsterdam, 1962. 15. Castro, E. A.; Cortes, R.; Santos, J. G.; Vega, J. C.
J. Org. Chem. 1982,47,3774.
16. De-Filippo, D.; Deplano, P.; Devillanova, F.; Trogu, E. F.; Verani G. J. Org. Chem. 1973, 38,560.
17. Usatenko, Y. I.; Barkalov, U. S.; Tulypa, F. M. J. Anal. Chem.-USSR. 1970, 25,1458.
18. Aspila, K. I.; Chakrabarti, C. L.; Sastri, V. S. Anal. Chem. 1973, 45, 363.
19. Joris, S. J.; Aspila, K. I.; Chakrabarti, C. L. J. Phys. Chem. 1970,74, 860.
20. Vandebeek, R. R.; Joris, S. J.; Aspila, K. I.; Chakrabarti, C. L. Can. J. Chem. 1970, 48,2204.
21. Aspila, K. I.; Sastri, V. S.; Chakrabarti, C. L. Talanta
1969, 16, 1099.
22. Cavalheiro, E. T. G.; Chierice, G. O. J. Braz. Chem. Soc. 1997, 8, 53.
23. Cavalheiro, E. T. G.; Ionashiro, M.; Marino, G.; Breviglieri, S. T.; Chierice, G. O. J. Braz. Chem. Soc.
1999, 10,65.
24. Cavalheiro, E. T. G.; Ionashiro, M.; Marino, G.; Breviglieri, S. T.; Chierice, G. O. Transit. Metal Chem.
2000, 25, 69.
25. Malissa, H.; Schöffman, S. Mikrochim. Acta 1955,
I, 187.
26. Elving, P. J.; Morkowitz, J. M.; Rosenthal, I. Anal. Chem. 1956, 28,1179.
27. Cavalheiro, E. T. G.; Plepis, A. M. G.; Chierice, G. O.; Neves, E. F. A. Polyhedron 1987, 9,1717.
28. Nakamoto, K. Infrared and Raman Spectra of Inorganic and Coordination Compounds; 3rd. Ed.;
John Wiley; New York, 1977.
29. Preti, C.; Tosi, G.; Zanini, P. J. Mol. Struct. 1979,
53, 35.
30. Silverstein, R. M.; Bassler, G. C.; Morril, T. C. Spectrometric Identification of Organic Compounds; 5th. Ed.; John Wiley; New York, 1991.
31. Zahradinik, R.; Zuman, P. Collect. Czech. Chem. Commun. 1959,24, 1132.
32. de Filippo, D.; Preti, C. Gazz. Chim. Ital. 1965,
95, 707.
33. International Centre for Diffraction Data. Power Diffraction File (CD-ROM). Newton Square, ICDD, 1994.
34. Breviglieri, S. T.; Cavalheiro, E. T. G.; Chierice, G. O. Termochim. Acta 2000, 25, 69
Received: March 24, 2000 Published on the web: April 20, 2001