www.reumatologia.com.br
REVISTA BRASILEIRA DE
REUMATOLOGIA
Original article
Inequality in the distribution of rheumatologists in Brazil:
correlation with local of medical residency, Gross Domestic
Product and Human Development Index
Cleandro Pires de Albuquerque*
Service of Rheumatology, Medicine Faculty, Universidade de Brasília, Brasília, DF, Brazil
a r t i c l e i n f o
Article history:
Received on 15 April 2013 Accepted on 23 August 2013
Keywords: Rheumatology Physician’s distribution Health policy
Epidemiology
a b s t r a c t
Objective: To assess the distribution of rheumatologists in Brazil and their correlation with Medical Residency specialization offer, Gross Domestic Product (Gdp) And Municipal Hu-man Development Index (HDI-M) of units of the federation (UFs).
Methods: Query to various oficial databases, data summarization by techniques for de-scriptive statistics and cross-referenced information. For correlation analysis, we used the Spearman correlation coeficient (r).
Results: There were 1229 rheumatologists regularly registered in the country. The North-ern region had only 3.6% of the total (n = 44), while the Southeast had 42.2% (n = 519). The State capitals, added to the ive largest municipalities in each UF, concentrated 75.8% of these specialists (n = 931). In total, 49.9% of rheumatologists offered treatment at SUS. A general ratio of 157,809 inhabitants per rheumatologist in Brazil was determined, but with wide variation among UFs with respect to this ratio. In the years 2000-2012, there were 593 Rheumatology Residency graduated physicians in Brazil. We observed a positive correla-tion among number of rheumatologists compared with GDP (r = 0.94), HDI-M of the State capitals (r = 0.77) and number of Rheumatology Residency graduated physicians (r = 0.79) in UFs.
Conclusions: We noted a strong concentration of rheumatologists in State capitals and larger municipalities, with noticeable inequalities also between UFs and country regions. The distribution of these professionals accompanied GDP, HDI-M of the State capital and number of Rheumatology Residency graduated physicians, suggesting that factors related to income opportunities and human development and the place of speciality training may inluence the geographical ixation of rheumatologists.
© 2014 Sociedade Brasileira de Reumatologia. Published by Elsevier Editora Ltda. All rights reserved.
* Corresponding author.
E-mail: [email protected] (C.P. Albuquerque).
Inequalidade na distribuição de reumatologistas no Brasil: correlação com local de residência médica, Produto Interno Bruto e Índice de Desenvolvimento Humano
Palavras-chave: Reumatologia
Distribuição de médicos Política de saúde Epidemiologia
r e s u m o
Objetivo: Avaliar a distribuição dos reumatologistas no Brasil e sua correlação com oferta de residência médica (RM) especializada, Produto Interno Bruto (PIB) e Índice de Desenvolvim-ento Humano Municipal (IDH-M) das unidades da federação (UFs).
Métodos: Consulta a várias bases de dados oiciais, sumarização de dados por técnicas es-tatísticas descritivas e cruzamento de informações. Para análise de correlação, utilizou-se o coeiciente de Spearman (r).
Resultados: Foram encontrados 1.229 reumatologistas registrados regularmente no país. A região Norte reunia apenas 3,6% desse contingente (n = 44), enquanto o Sudeste, 42,2% (n = 519). As capitais somadas aos cinco maiores municípios de cada UF concentraram 75,8% desses especialistas (n = 931). No total, 49,9% dos reumatologistas prestavam aten-dimento pelo Sistema Único de Saúde (SUS). Achou-se razão geral de 157.809 habitantes para cada reumatologista no Brasil, porém com grande variação entre as UF quanto a essa proporção. Entre 2000 e 2012, houve 593 concluintes de RM em reumatologia no Brasil. Achou-se correlação positiva do número de reumatologistas ante o PIB (r = 0,94), o IDH-M da capital (r = 0,77) e o número de concluintes de RM em reumatologia (r = 0,79) das UF. Conclusões: Observou-se forte concentração de reumatologistas nas capitais e maiores mu-nicípios brasileiros, com inequalidades perceptíveis também entre as UF e as regiões do país. A distribuição desses proissionais acompanhou o PIB, o IDH-M da capital e o número de concluintes de RM em reumatologia das UF, sugerindo que fatores relacionados a opor-tunidades de renda e desenvolvimento humano e ao local de formação especializada po-dem inluir na ixação geográica dos reumatologistas.
© 2014 Sociedade Brasileira de Reumatologia. Publicado por Elsevier Editora Ltda. Todos os direitos reservados.
Introduction
A recently published study by the Federal Council of Medi-cine (Conselho Federal de Medicina, CFM) and the Regional Council of Medicine of São Paulo (Conselho Regional de Me-dicina do Estado de São Paulo, CREMESP) demonstrates poor distribution of physicians in the country, not considering any absolute deiciency in the number of these professionals. This inequality is observed both in relation to doctors in gener-al as to specigener-alists, who concentrate their activity on State capitals and larger municipalities, resulting in a shortage of physicians in the periphery and in the hinterland.1 The
Bra-zilian government has sought strategies to achieve greater internalization of physicians, some of them questionable, as the liberal authorization for opening medical schools, which multiply without strict criteria of geographical necessity, and the proposal of compulsory civil service, which does not at-tack the bases of the problem and imposes on this particular profession a social obligation not uniformly distributed to the other ones.2
Historically, it has been easier to attract physicians (tem-porarily) for the poorest and remote areas than to ix the professionals in these regions, with consequent turnover of professionals working in the hinterland and in the periphery, particularly in the case of primary care. The determinants of the geographical ixation process of the physician are com-plex and include factors such as the region where the
pro-fessional was born, his/her alma mater, formative content and experiences during graduation, job/chief satisfaction, ad-equacy of resources for the professional performance, quality and safety in the workplace, opportunities for development/ updating of her/his career, personal respect and professional prestige, opportunities for cultural development, nature of employment relationship, besides the perception of a remu-neration consonant with the investment in training and the responsibilities of profession, among others.3-5 Studies
sug-gest that the existence of Medical Residency (MR) programs in a particular locality may have attractive effect, functioning as a “medical ixator”; furthermore, the regions holding the higher gross domestic product (GDP) – and therefore with a greater generation of wealth – also bear the greatest numbers of these professionals.6-8 Although the priority in the search
for better distribution in the provision of medical services should be the primary care, we must not lose sight that the access to specialists continue to be essential in more complex cases, and this need cannot be fully supplied by telemedicine capabilities.
In the particular case of rheumatology, there is a current perception, among physicians and users (patients), of a rela-tive scarcity of these specialists, possibly even in State capi-tals, resulting in dificulties in accessing their services. In the UK, the Royal College of Physicians postulated as ideal a ratio of 1 full-time-available rheumatologist (40 hours per week) for each 86,000 inhabitants.9 Although an universally
physician/popula-tion ratio is lacking, and although the needs certainly may differ between regions and countries, this number gives us a starting point for comparisons.
This study adopts the premise that the same determinants of the geographical ixation process of physicians in general apply to rheumatologists. If this is the case, and if the fac-tors related to the institution where the MR was obtained and to opportunities for income generation and human develop-ment are determinant for the choice of the ixation local by the physician, then the distribution of rheumatologists in the country should accompany the levels of indicators that measure (even partially) such constructs. The objective of this study is to evaluate the distribution of rheumatologists in Brazil, as well as its correlation with the number of Rheuma-tology Residency graduated physicians, GDP and municipal human development index (HDI-M) from federal units (UFs).
Materials e methods
We conducted a direct research (online) in databases of Con-selho Federal de Medicina (CFM), Instituto Brasileiro de Geo-graia e Estatística (IBGE), Cadastro Nacional de Estabeleci-mentos de Saúde (CNES) of the Ministry of Health, Comissão Nacional de Residência Médica (CNRM) of the Ministry of Education and the United Nations Program for Development (UNDP).10-15 These databases provide public access via World
Wide Web (Internet). All searches were conducted between March 1st and March 20th, 2013. The variables analyzed with
their respective original bases were: from CFM, number of rheumatologists with active registration, by UF and munici-palities; IBGE’s residents’ population and GDP by UF and mu-nicipalities; from CNES, number of rheumatologists providing attendance to SUS by UF; from CNRM, number of certiicates of Rheumatology Residency issued by UF; from UNDP, the HDI-M by UF. The research methodology did not include pe-diatric rheumatologists, whose CFM registration takes place nowadays under the designation of area of activity, and not of specialty.
GDP is deined as the total of goods and services produced, with the purpose of inal consumption, equivalent to the sum of values added by the various economic activities plus taxes (free of subsidies) on products.16 GDP represents the sum of
the wealth generated by the different economically active sectors in a particular region/time period. HDI aims to be a general, synthetic, measure of human development, calcu-lated from three pillars: (i) health, as measured by life expec-tancy; (ii) access to knowledge, measured by average years of adult education and expected years of schooling for children at early school age; and (iii) income.17
The query to CNES by number of rheumatologists attend-ing at SUS used the option of search by individuals; this tech-nique computes the professional only once, even in the case of multiple links. We used the number of certiicates issued for Rheumatology Residency as an estimator of the number of trainees in the specialty, by MR modality, in the UF. All cer-tiicates of Rheumatology Residency completion registered at CNRM from 2000 to 2012 were included. The choice of this inclusion period was based on two criteria: (a) the registra-tion data of the CNRM prior to 2000 have greater likelihood of
inconsistencies; and (b) the searches aimed to comprise the latest consolidated information. Information from CFM, CNES and CNRM was up-to-date with reference to the time of ac-cess.10-12 The GDP used refers to the year 2010, and population
data are estimates for the year 2012.13,14 HDI-M was calculated
by UNDP, based on information from the 2000 Brazilian cen-sus; the UF’s HDI-M corresponds to the average of its munici-palities.15
The Federal District was considered as an equivalent of a single municipality. Considering the small number of rheu-matologists in the country compared to the number of inhab-itants, with the aim to avoid notations of the type 1/x or an excessive number of decimals, in this paper the commonly reported rates in form of physician/habitants are reported in its inverse form (inhabitants/physician). UFs are referred to by their usual abbreviations (ex: DF, GO, PB, RJ, SP, etc.). Data were summarized by descriptive statistics techniques. In the correlation analysis, we used the correlation coeficient of Spearman (r), with a two-tailed signiicance level of 0.01. The analyses were performed using SPSS software for Windows.
Results
Table 1 summarizes the results by UF. At the time of the sur-vey, there were 1,229 rheumatologists with active registries in databases from CFM throughout our country. The North-ern region had only 3.6% of the contingent (n = 44); Midwest, 12.1% (n = 149); Northeast, 17.5% (n = 215); South, 24.6% (n = 302); and Southeast, 42.2% (n = 519). The 27 State capitals con-centrated 64% of registered rheumatologists (n = 787), 93% of the rheumatologists in the Northern Region lived in its capi-tals; in the Midwest, 85%; in the Northeast, 80%; in the South, 52%; and in the Southeast, 56%. Taking the ive largest munici-palities in each state, a concentration of 75.8% of all registered rheumatologists (n = 931) was reached. There was only one rheumatologist with active registry in Acre, while the State of São Paulo showed 241 active registries.
In our country, 49.9% (n = 614) of the rheumatologists of-fered their services to SUS, with heterogeneity noted between the regions: in the Northern Region, this proportion was 70.5% (n = 31); Midwest, 37.6% (n = 56); Northeast, 58.1% (n = 125); South, 19.2% (n = 58); and Southeast, 68.2% (n = 354). A gen-eral rate of 157,809 inhabitants/rheumatologist was observed. By region, the rate was 370,867 inhabitants/rheumatologist in the Northern Region; 250,731 in Northeast; 157,160 in South-east; 120,819 in Midwest; and 91,827 in South. But UFs differed considerably in this respect, with a median of 192,624 inhab-itants/rheumatologist (interquartile range = 175,981) and ex-tremes of 41,383 in DF and 758,786 in AC. If we consider only the specialists who offer their services to SUS, the median was 413,692 inhabitants/rheumatologist (interquartile range = 338,273), with extremes of 156,071 in RJ and 1,053,583 in PI.
Rheu-matology Residency graduated physicians in the UF (r = 0.79), respectively, was found. A moderate correlation between number of rheumatologists and HDI-M of the UF (r = 0.56) was observed.
Discussion
We found imbalances in the distribution of rheumatologists in this country, who were concentrated in State capitals and larger municipalities, following a similar pattern to that re-ported by CFM/CREMESP for physicians in general.1
Inequali-ties were also observed between regions: the seven UFs of South and Southeast regions gathered about two-thirds of rheumatologists, with the remainder distributed among the remaining twenty UFs. North, Northeast and Midwest regions had the highest concentrations of rheumatologists in the State capitals, which housed 80% or more of these profession-als. In South and Southeast regions, although this phenom-enon of concentration also had been observed, it is less in-tense, with slightly more than half of rheumatologists in the
capitals. The Northern region exhibited the lowest presence of rheumatologists, both in absolute (number of profession-als, n = 44) and relative (370,867 inhabitants/rheumatologist) terms.
Some UFs reached levels close to or even exceeding the ideals proposed by the British Royal College of Physicians,9
of about 86,000 inhabitants/rheumatologist (e.g., DF, 41,383; PR, 80,746; RS, 94,479; MS, 96,350), while still others fell far short of this level (e.g., AC, 758,786; RO 530,004; MA 559,526; RR 469,524). Considering only the number of rheumatologists offering their services to SUS, all UFs were far from optimal levels of provision, and the best positioned UF was RJ with 156,071 inhabitants/rheumatologist. Data on SUS rheuma-tologists were generated from CNES, whose records are used in the calculation of inancial transfers for service providers, with mandatory periodic updating of the system by its ad-ministrators.18 In general, CNES is a good indicator of human
resources at SUS, but there is an overestimation bias: the re-duction of registered human resources can result in reduced inancial transfer to the management unit. Thus, despite the requirement for periodic updating, not always a physician
Table 1 – Population, number of rheumatologists, GDP, HDI-M, medical resident inishers in rheumatology and habitants/ rheumatologist ratio per state
Region Population Rheumatologist GDP† HDI-M†† RM‡ Hab/Rheum.#
State Capital SUS State Capital General SUS
North
AC 758.786 1 1 0 8.477 0,697 0,754 0 758.786 dna
AM 3.590.985 10 10 10 59.779 0,753 0,774 6 359.099 359.099
AP 698.602 4 4 4 8.266 0,713 0,772 0 174.651 174.651
PA 7.792.561 19 18 12 77.848 0,723 0,806 0 410.135 649.380
RO 1.590.011 3 2 2 23.561 0,735 0,763 0 530.004 795.006
RR 469.524 1 1 1 6.341 0,746 0,779 0 469.524 469.524
TO 1.417.694 6 5 2 17.240 0,710 0,800 0 236.282 708.847
Northeast
AL 3.165.472 22 18 19 24.575 0,649 0,739 0 143.885 166.604
BA 14.175.341 47 32 16 154.340 0,688 0,805 11 301.603 885.959
CE 8.606.005 38 33 17 77.865 0,700 0,786 19 226.474 506.236
MA 6.714.314 12 10 7 45.256 0,636 0,778 0 559.526 959.188
PB 3.815.171 29 18 23 31.947 0,661 0,783 0 131.558 165.877
PE 8.931.028 30 26 24 95.187 0,705 0,797 18 297.701 372.126
PI 3.160.748 10 10 3 22.060 0,656 0,766 2 316.075 1.053.583
RN 3.228.198 16 14 11 32.339 0,705 0,788 0 201.762 293.473
SE 2.110.867 11 11 5 23.932 0,682 0,794 0 191.897 422.173
Midwest
DF 2.648.532 64 64 15 149.906 0,844 0,844 47 41.383 176.569
GO 6.154.996 44 35 20 97.576 0,776 0,832 16 139.886 307.750
MS 2.505.088 26 19 4 43.514 0,773 0,814 11 96.350 626.272
MT 3.115.336 15 9 7 59.600 0,778 0,821 0 207.689 445.048
Southeast
ES 3.578.067 34 17 10 82.122 0,765 0,856 5 105.237 357.807
MG 19.855.332 148 71 49 351.381 0,773 0,839 55 134.158 405.211
RJ 16.231.365 96 72 104 407.123 0,807 0,842 63 169.077 156.071
SP 41.901.219 241 130 191 1.247.596 0,820 0,841 274 173.864 219.378
South
PR 10.577.755 131 77 19 217.290 0,787 0,856 37 80.746 556.724
RS 10.770.603 114 61 29 252.483 0,814 0,865 29 94.479 371.400
SC 6.383.286 57 19 10 152.482 0,822 0,875 0 111.987 638.329
Brazil 193.946.886 1.229 787 614 3.770.086 dna dna 593 157.809 315.874
who leaves SUS will have his/her registration status at CNES immediately modii ed by the administrator. Therefore, the situation of rheumatologists’ provision to SUS can be even worse than the picture reported here.
About two-thirds of Rheumatology Residency graduated physicians attended specialization in the Southeast, and the state of São Paulo alone accounted for 46.2% (n = 274) of all graduates. At the other extreme, the entire Northern region ac-counted for only 1% (n = 6) of these graduates. In 13 UFs, there was no active program and/or any physician who i nished their Rheumatology Residency in the years 2000-2012. Among these UFs, four presented general rates larger than 400,000 inhabit-ants/rheumatologist, namely AC, PA, RO, RR, and MA. Despite these numbers, the rheumatology specialty is not contem-plated as a priority specialty by the national program for sup-porting the training of medical specialists in strategic areas (Pró-Residência).19,20 The results presented here argue in favor
of the reconsideration of that position by the ofi cials of Public Administration. The Brazilian Society of Rheumatology can ex-ercise a preponderant role in this subject.
We observed a strong positive correlation between the number of rheumatologists and GDP, HDI-M of State capi-tals and the number of Rheumatology Residency graduated physicians in each UF, suggesting that some elements related to income opportunities and human development elements, besides the place where the specialized training was offered, may inl uence the geographical i xation of these specialists. Póvoa and Andrade observed a greater likelihood of i nding non-native physicians,7 i.e., those coming from other regions,
in UFs with a highest number of MR vacancies, and thus also in those UFs with the highest GDP per capita, suggesting that these two factors function as local physician concentrators.
Other studies show that physicians tend to stay in the place where they did their MR, and that there are more physi-cians in UFs with greater GDP.6,8 The only moderate
correla-tion with HDI-M of the UF (average of the municipalities) is not surprising, given the concentration of rheumatologists in the States’ capitals. Moreover, it seems reasonable to assume that factors operating at local (municipal) level exert greater inl uence on the individual’s choice as to where to i x his/her living, because the local problems and opportunities will oc-cur mainly at this level.
The study published by CFM/CREMESP, previously cited, adopted different methodology for its counting of physi-cians.1 This study used other sources, in addition to the
CFM records, performing data cross-checking with the goal of identifying specialists. For that research, 1,631 rheuma-tologists were operating in Brazil in 2012, different from the 1,229 professionals reported here. The system of administra-tive and notary record of CFM is integrated with those of the Conselhos Regionais de Medicina (CRMs), so that all specialist qualii cation titles registered in CRM are automatically also included in CFM basis. Thus, a specialists’ underreporting CRM/CFM system was noted. That is, there were physicians with a rheumatologist title, obtained either through comple-tion of medical residency or by approval at Brazilian Society of Rheumatology specii c scrutiny; but these entities do not reg-ister titles in CRM/CFM system. This underreporting leads to curious situations, as in Table 1, where it can be seen that the total rheumatologists registered at CRM/CFM in Rio de Janeiro
was inferior to the number of rheumatologists who worked in the SUS in that UF.
Therefore, the present work, in considering rheumatolo-gists from CFM records, underestimates by approximately 24.6% the total number of rheumatologists in the country. For the calculation of inhabitants/rheumatologist rate, the CFM system search was not restricted to primary enrollments, considering that a rheumatologist with active registration in more than one UF will be available to each of them (unevenly, or not). If only the primary registrations were considered, then 1,187 registered rheumatologists across the country would be computed, bringing the sub-registry in CFM to 27.2%, com-pared with the study of CFM/CREMESP. Given this limitation, we must evaluate to what extent this difference impacts the results presented here.
First, data on number of rheumatologists in the SUS and its relationship versus number of inhabitants do not change, because, at that point, the sources of both studies (CNES and IBGE) are identical. As for the correlation analysis, we recalcu-lated the tests using the data published by CFM/CREMESP for number of rheumatologists versus GDP, HDI-M of State capital and number of MR graduates in rheumatology in each state, and the coefi cients (r) were 0.94, 0.74 and 0.82, respectively – very similar to our original coefi cients. Thus, here the i nd-ings also do not change.
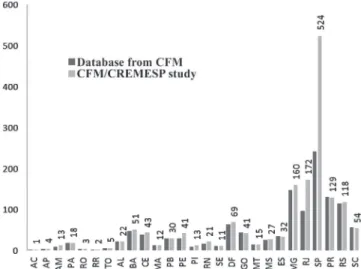
However, when relating data from CNES (rheumatologists in SUS) with those published by CFM/CREMESP (total of rheu-matologists), we conclude that only 37.6% of rheumatologists in the country are available to SUS, compared to those 49.9% reported here. There are also differences in the inhabitants/ rheumatologist general rates by UF. Fig. 1 associates the re-sults obtained here (from databases of CFM) with those pub-lished by CFM/CREMESP. The main differences were seen in SP and RJ, where – by the methodology of CFM/CREMESP – more 283 and 76 rheumatologists were respectively computed, compared with our data in this study. As for MG and PE, more 12 and 11 rheumatologists, respectively, were noted. For all re-maining states, the differences in absolute numbers between
forms of counting ranged from 0 to 5 rheumatologists by UF (either more or less).
Data of CFM/CREMESP imply that Brazil has an overall ratio of 118,913 inhabitants/rheumatologist. When analyzed by UF, the median of this ratio is 174,651 inhabitants/rheu-matologist (interquartile range = 144,670), with extremes of 38,385 in DF and 758,786 in AC. These numbers show a better scenario for the inhabitants/rheumatologist rate, compared to that obtained from CFM registry data, but do not modify the pattern of poor distribution of rheumatologists among UFs, as noted in Fig. 1. Even using CFM/CREMESP data, several UFs still present inhabitants/rheumatologist general rates distant from the levels postulated as ideal (e.g., AC, 758,786; MA, 559,526; RO, 530,004; PA, 432,920; TO, 283,539; BA, 277,948; AM, 276,230), while others exhibit proper proportions or even an excess of rheumatologists (e.g., DF, 38,385; SP, 79,964; PR, 81,998; RS, 91,276; MS, 92,781; RJ, 94,368). So, no matter which data set used, whether CFM’s (methodology adopted for this study) or CFM/CREMESP’s – the general conclusions of this pa-per do not change.
In short, we observed imbalance in the distribution of rheumatologists in our country, with a concentration of these specialists in Brazilian State capitals and larger municipali-ties. The South and Southeast gathered about two-thirds of rheumatologists, the remaining third being distributed by North, Northeast and Midwest regions. Some units of the federation reached levels postulated as ideal for the inhab-itants/rheumatologist rates (particularly in Southeast, South and Midwest), while others exhibited severe shortage of these professionals (especially in North and Northeast). Half or less of the total number of rheumatologists in Brazil were avail-able to SUS. The distribution of rheumatologists in our coun-try paralleled the GDP, the HDI-M from the state capital and the number of Rheumatology Residency graduates of UFs, suggesting that factors related to income opportunities and human development, besides the site where the specialized training occurred, may inluence the choice of their geograph-ical settlement.
Conlicts of interest
The author declares no conlicts of interest.
R E F E R E N C E S
1. Conselho Federal de Medicina, Conselho Regional de Medicina do Estado de São Paulo. Demograia Médica no Brasil, v. 2. São Paulo: CFM, CREMESP; 2013.
2. Brasil, Ministério da Saúde, Secretaria de Gestão do Trabalho e da Educação na Saúde. Seminário nacional sobre escassez, provimento e ixação de proissionais de saúde em áreas remotas e de maior vulnerabilidade. Relatório síntese. Brasília: Ministério da Saúde, 2012.
3. Ney MS, Rodrigues PH de A. Fatores críticos para a ixação do médico na Estratégia Saúde da Família. Physis. 2012;22:1293-311. 4. Campos CV de A, Malik AM. Satisfação no trabalho e
rotatividade dos médicos do Programa de Saúde da Família. Rev Adm Pública. 2008;42:347-68.
5. Perpetuo IHO, De Oliveira AC, Ribeiro MM, Rodrigues RB. A categoria proissional dos médicos: fatores condicionantes da sua atração e ixação na Atenção Primária à Saúde em Minas Gerais. Belo Horizonte: Observatório de Recursos Humanos em Saúde do Nig. One / UFMG; 2009.
6. Pinto LF da S, Machado MH. Médicos migrantes e a formação proissional: um retrato brasileiro. Rev Bras Educ Med. 2000;24:53-64.
7. Póvoa L, Andrade MV. Distribuição geográica dos médicos no Brasil: uma análise a partir de um modelo de escolha locacional. Cad Saúde Pública. 2006;22:1.555-64.
8. Bittar OJNV. O mercado médico no Brasil. Rev Adm Pública. 1999;33:55-66.
9. Royal College of Physicians. Consultant physicians working with patients – rheumatology. London: RCP, 2011.
10. Conselho Federal de Medicina. Busca de Médicos. Disponível em: http://portal.cfm.org.br/index.php?option=com_ medicos&Itemid=59. Acesso em: 13 mar. 2013.
11. Cadastro Nacional de Estabelecimentos de Saúde. Disponível em: http://tabnet.datasus.gov.br/cgi/deftohtm.exe?cnes/cnv/ prid02br.def. Acesso em: 20 mar. 2013.
12. Comissão Nacional de Residência Médica. Consulta de certiicados. Disponível em: http://siscnrm.mec.gov.br/ consulta/consultaresidente. Acesso em: 11 mar. 2013. 13. Instituto Brasileiro de Geograia e Estatística. Contas
Regionais 2010. Disponível em: http://www.ibge.gov.br/home/ estatistica/economia/contasregionais/2010/default.shtm. Acesso em: 12 mar. 2013
14. Instituto Brasileiro de Geograia e Estatística. População residente enviada ao Tribunal de Contas da União 2001-2012. Disponível em: http://www.ibge.gov.br/home/estatistica/ populacao/estimativa2012/default.shtm. Acesso em 12 mar. 2013.
15. Organização das Nações Unidas, Programa das Nações Unidas para o Desenvolvimento. Atlas de Desenvolvimento Humano 2003. Disponível em: http://www.pnud.org.br/IDH/ Atlas2003.aspx?indiceAccordion=1&li=li_Atlas2003. Acesso em: 15 mar. 2013.
16. Brasil, Ministério do Planejamento, Orçamento e Gestão, Instituto Brasileiro de Geograia e Estatística. Contas Regionais do Brasil 2010. Rio de Janeiro: IBGE, 2012. 17. Organização das Nações Unidas, Programa das
Nações Unidas para o Desenvolvimento. O que é IDH. Disponível em: http://www.pnud.org.br/IDH/IDH.
aspx?indiceAccordion=0&li=li_IDH. Acesso em: 20 mar. 2013. 18. Brasil, Ministério da Saúde. Portaria N° 3.462, de 11 de
novembro de 2010. Estabelece critérios para alimentação dos Bancos de Dados Nacionais dos Sistemas de Informação da Atenção à Saúde. Diário Oicial da União. 12 nov. 2010; Seção 1:50.
19. Brasil, Ministério da Educação. Portaria Interministerial N° 1.001, de 22 de outubro de 2009. Institui o Programa Nacional de Apoio à Formação de Médicos Especialistas em Áreas Estratégicas — PRÓ-RESIDÊNCIA. Diário Oicial da União. 23 oct 2009; Seção 1:9.