(1) Universidade Tiradentes, UNIT, Aracaju, Sergipe, Brasil.
Conlict of interest: Nonexistent
Quality of life in individuals with tinnitus
with and without hearing loss
Gregorina Silva Ribeiro Rocha(1)
Marlizete Maldonado Vargas(1)
Margarete Zanardo Gomes(1)
Received on: April 05, 2017 Accepted on: September 28, 2017
Mailing address:
Gregorina Silva Ribeiro Rocha Instituto de Pesquisa e Tecnologia - ITP Avenida Murilo Dantas, 300 - Farolândia CEP: 49032-490 - Aracaju, Sergie, Brasil E-mail: [email protected]
ABSTRACT
Purpose: to evaluate the perception of the level of quality of life in subjects with tinni
-tus, with and without hearing loss.
Methods: a cross-sectional quantitative study. A total of 189 subjects (mean age 53.06 years) divided into four groups. Group 1: subjects with normal auditory thresholds without tinnitus complaint; Group 2: subjects with normal auditory thresholds and tinnitus complaint; Group 3: subjects with sensorineural hearing loss without tinnitus complaint; Group 4: subjects with sensorineural hearing loss and with tinnitus com
-plaint. Levels of quality of life were investigated through the World Health Organization Quality Of Life (WHOQOL) website - brief and psycho-emotional and functional aspects of patients with tinnitus through the Tinnitus Handicap Inventory (THI). Statistical
analyzes, comparisons among groups and descriptive analysis were performed, con
-sidering a signiicance level of 5%.
Results: the overall mean scores of quality of life in group 4 (56.07) were smaller than those of group 1 (64.67) (p<0.05). The subjects with tinnitus complaint presented a moderate level of disturbance of the symptom.
INTRODUCTION
Tinnitus is an auditory sensation perceived by the individual that is not originated from the external environment1. A study conducted in a South Indian
population revealed that the most prevalent etiological factors leading to the development of tinnitus associated with hearing loss are otitis media (60.9%), presbycusis (16.6%) and otosclerosis (14.3%). The
authors also veriied that in 96.9% of subjects with tinni -tusthere was an association with hearing loss 2.
About 15% of the world population (278 million) presents tinnitus3. In the United States, 10% of the
population (30 million) has tinnitus4, and one in 10
adults presents the symptom5. In Brazil, it is estimated to ind it in 13% of the population (28 million)3. In the
city of São Paulo, São Paulo, Brazil, the prevalence is of 22%, and the symptom affects mostly women6.
Concerning to the hearing loss, a study showed that it has been decreasing in North American adults aged between 20 and 69 years. It was found that the preva-lence of hearing loss reduced from 16 to 14%, i.e., from 28 million adults inthe years 1999-2004 to 27.7 million in the years 2011-20127.
Researchers evaluated 68 individuals with senso-rineural hearing loss and tinnitus complaint from the Tinnitus Clinic of the Federal University of Rio de Janeiro and found no correlation between tinnitus severity and degree of hearing loss3.
In Londrina, Paraná, Brazil, 519 elderly subjects
were evaluated in order to investigate the association
of hearing loss and tinnitus. It was veriied that,among
159 right ears studied, 58 (36.47%) presented tinnitus, being 13 (22.41%) ears with normal hearing and 45 (77.58%) with hearing loss; and among the 159 left ears, 38 (23.89%) presented tinnitus, nine (23.68%) ears presented normal hearing and 29 (76.31%) presented hearing loss8.
Although the association between tinnitus and quality of life impairment do exist, there is still little
evidence to identify the speciic characteristics respon -sible for this association, such as the factors relatedto the tinnitus complaint and the results of the audiological (hearing) evaluation – the kind and extent of hearing loss9.
Elderly people aged 60 to 80 years, from the Basic Care Coordination of Itabaiana, Sergipe, Brazil, were evaluated regarding their quality of life. Amid the
108 subjects who participated in the study, 89.1%
complained of tinnitus and presented impairment in their quality of life10.
Some studies have assessed the quality of life and hearing. One of them was carried out in South Korea in order to investigate the relationship between hearing loss, tinnitus and quality of life. The sample was divided
into four groups of subjects who presented normal
hearing without tinnitus, normal hearing with tinnitus, hearing loss without tinnitus and hearing loss with tinnitus. The authors observed that hearing loss with tinnitus has a considerable impact on the quality of life in that population. They reported that the group of
subjects with hearing loss without tinnitus had a better
quality of life than the group with normal hearing and tinnitus11.
The Tinnitus Handicap Inventory - THI, an instrument that investigates the repercussion of tinnitus on
subjects’ quality of life, was used by researchers from
the University of São Paulo. They concluded that sex and age, as well as the degree of hearing loss, did
not inluence the discomfort generated by tinnitus.
On the other hand, the occurrence of hearing loss in individuals with tinnitus is progressively greater with the age and also in individuals with sensorineural hearing loss12. That study aimed to evaluate the perception of the level of quality of life in subjects with tinnitus with
and without hearing loss.
METHODS
This work was a cross-sectional quantitative study. It was approved by the Ethics Committee of the Universidade Tiradentes, protocol number 1.222.866.
They were included patients from the Audiology Clinic of the Department of Speech and Hearing Therapy of the institutional University Hospital with ages above 18 years, who agreed to participate in the study and signed the free and informed consent term. Exclusion criteria were: conductive or mixed hearing loss, presence of earwax or foreign body in the external ear and neurological, psychiatric or cognitive altera-tions already diagnosed.
In the irst stage, participants answered a data
collection form to identify gender, age, educational level, family income, hearing complaints and tinnitus characteristics. The second step comprisedthe evalu-ation of hearing, initiated by the inspection of the external acoustic meatus. The auditory evaluation was composed by conventional pure tone audiometry.
Those subjects who complained of tinnitus were
the World Health Organization Quality of Life - WHOQOL-BREF, and also the instrument that
investi-gates the impact of tinnitus on the subject’s quality of
life, the Tinnitus Handicap Inventory - THI.
The WHOQOL-BREF instrumentmeasures
thesub-ject’s quality of life. It comprises 26 items, two of them
are general questions related to the global quality of life score, and the other 24 questions are distributed in 4 domains: physical health, psychological health, social relationships, and environmental.The THI instrument
investigates the repercussion of tinnitus on subjects’
quality of life and is composed of 25 questions that assess the emotional, functional and catastrophic aspects.
The participants were divided into four groups, which were:
• Group 1: subjects with normal auditory thresholds without tinnitus complaint;
• Group 2: subjects both with normal auditory thresholds and tinnitus complaint;
• Group 3: subjects with sensorineural hearing loss without tinnitus complaint;
• Group 4: subjects with sensorineural hearing loss and with tinnitus complaint.
Subsequently, each group was divided again into age groups: young adults (18 to 39 years), adults (40 to 59 years) and elderly (over 60 years).
The sample consisted of 189 subjects of both
genders. Age ranged from 20 to 85 years, with an average of 51.06 years (SD = ± 16.27). The G1 was
composed of 52 (27.5%) subjects, G2, composed of 43 (22.7%) subjects, G3 by 33 (17.5%) subjects and G4, 61 (32.3%) subjects.
Statistical analyzes were performed on the software
GraphPad Prism 5.0. To evaluate the inluence (inter -action) of the age range (age variable) in the compar-isons between groups G1 to G4 (group variable), two-way analysis of variance was performed.In the
case of signiicant interactions, data were submitted to
a Shapiro-Wilk normality test, and then to the
Kruskall-Wallis test followed by Dunn’s post-test for comparison
between the fourgroups or Mann-Whitney test for comparison between two groups.The correlation between variables was evaluated using the Spearman
correlation test, considering a level of signiicance of
0.05.The descriptive analysis of the variables included-frequency and percentage, and the age (independent variable) was analyzed by mean and standard deviation.
RESULTS
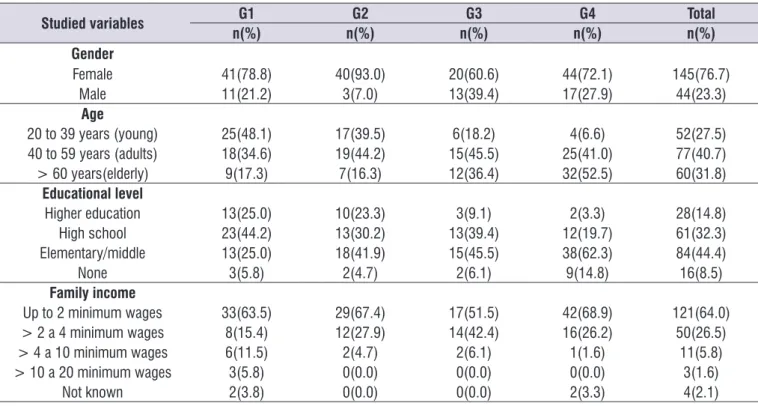
The Table 1 presents the socio-demographic data of
the subjects evaluated, the auditory threshold and the
when comparing the results among young adults,
adults and the elderly.On the other hand, signiicant
differences were observed between groups (Tables 2 and 3). These groups were compared in each domain (two-way ANOVA, p> 0.05).
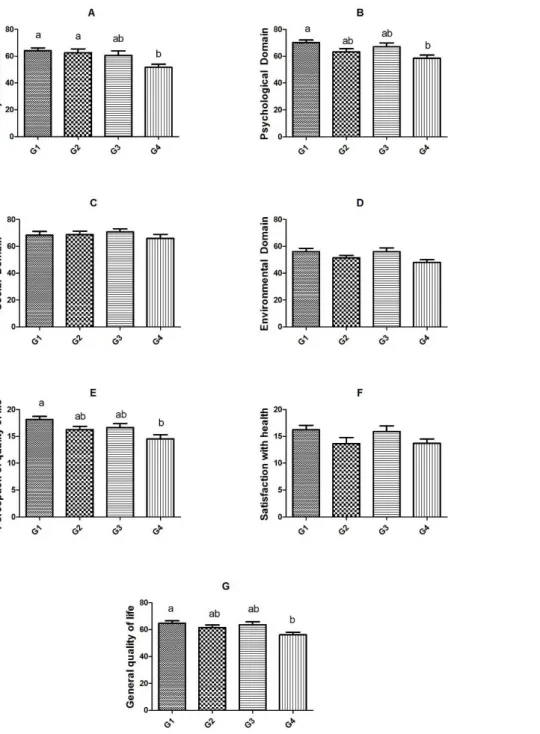
The comparisons between the means values of the groups in each domain of the WHOQOL-BREF are presented in Figure 1.
The average quality of life scores were assessed according to the physical, psychological, social and environmental domains, as well as the general quality
olife.
In all domains of the WHOQOL-BREF, as well as
in the aspects evaluated in the THI, no signiicant
interactions were observed between the variables age
and groups. No signiicant differences were observed
Table 1. Distribution of the subjects regarding sociodemographic data, Aracaju/SE, 2015/2016
Studied variables G1 G2 G3 G4 Total
n(%) n(%) n(%) n(%) n(%)
Gender
Female 41(78.8) 40(93.0) 20(60.6) 44(72.1) 145(76.7)
Male 11(21.2) 3(7.0) 13(39.4) 17(27.9) 44(23.3)
Age
20 to 39 years (young) 25(48.1) 17(39.5) 6(18.2) 4(6.6) 52(27.5)
40 to 59 years (adults) 18(34.6) 19(44.2) 15(45.5) 25(41.0) 77(40.7)
> 60 years(elderly) 9(17.3) 7(16.3) 12(36.4) 32(52.5) 60(31.8)
Educational level
Higher education 13(25.0) 10(23.3) 3(9.1) 2(3.3) 28(14.8)
High school 23(44.2) 13(30.2) 13(39.4) 12(19.7) 61(32.3)
Elementary/middle 13(25.0) 18(41.9) 15(45.5) 38(62.3) 84(44.4)
None 3(5.8) 2(4.7) 2(6.1) 9(14.8) 16(8.5)
Family income
Up to 2 minimum wages 33(63.5) 29(67.4) 17(51.5) 42(68.9) 121(64.0)
> 2 a 4 minimum wages 8(15.4) 12(27.9) 14(42.4) 16(26.2) 50(26.5)
> 4 a 10 minimum wages 6(11.5) 2(4.7) 2(6.1) 1(1.6) 11(5.8)
> 10 a 20 minimum wages 3(5.8) 0(0.0) 0(0.0) 0(0.0) 3(1.6)
Not known 2(3.8) 0(0.0) 0(0.0) 2(3.3) 4(2.1)
G1: group 1; G2: group 2; G3: group 3, G4: group 4.
Table 2. Statistical data from WHOQOL-BREF per age, Aracaju/SE, 2015/2016
Domain Variable:
Interaction age X group Variable: age Variable: group
Table 3. Statistical data from THI per age, Aracaju/SE, 2015/2016
Domain Variable:
Interaction age X group Variable: age Variable: group
Emotional F2-98=0.48; p=0.6191 F2-98= 2.28; p=0.1080 F1-98= 4.29; p=0.0410
Functional F2-98=0.01; p=0.9907 F2-98= 2.16; p=0.1207 F1-98= 1.25; p=0.2653
Catastrophic F2-98=0.42; p=0.6604 F2-98= 1.18; p=0.3105 F1-98= 0.24; p=0.6262
THI=Tinnitus Handicap Inventory; Two-way analyzes of variance.
Signiicant differences in the comparison between
the groups were observed in the physical domain (p = 0.0035), G1 being different from G4 (p <0.05) and G2
being different from G4 (p <0.01) (Figure 1A). Subjects
with hearing loss and tinnitus have a lower quality of life score in this domain than those with normal hearing, either with or without tinnitus.
There was a signiicant difference in the psycho -logical domain (p = 0.0053), G1 being different from
G4 (p <0.01) (Figure 1B). In this domain, subjects
with normal hearingwithout complaint of tinnitus have a better average score when compared to those with hearing loss and tinnitus.
Regarding the self-assessment of quality of life
perception, the groups presented signiicant differ -ences (p = 0.0026), G1 being different from G4 (p
<0.01) (Figure 1E). This result reveals that subjects with
good hearing conditions and no complaints of tinnitus evaluate their quality of life better when compared with those patients with hearing loss and tinnitus.
The overall quality of life mean scores were statis-tically different between the groups (p = 0.0334), the G4 means being lower than G1 (p <0.05, Figure 1G). Since there was no statistical difference between the groups of patientswith tinnitus (G2 and G4), it indicates that tinnitus interfere in thequality of life, associated or not with hearing loss.
They were not observed signiicant differences in
the social (p = 0.9486, Figure 1C) and environmental (p = 0.0771, Figure 1D) domains, as well as in the satisfaction with health (p = 0.1172, Figure 1F).
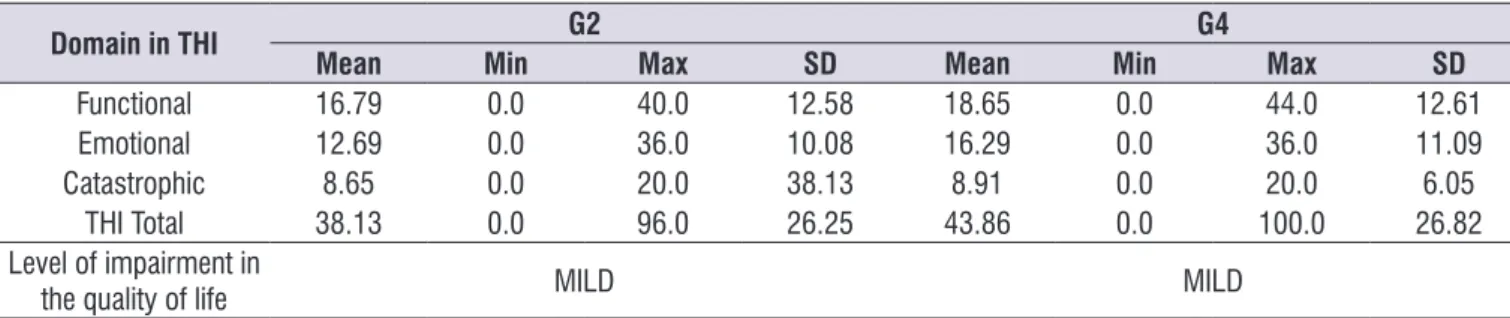
Of the 104 subjects complaining of tinnitus, 43
(22.7%) belonged to G2 and 61 (32.3%) to G4. The THI scores of these groups are shown in Table 4.
Table 4. Scores from thi in groups G2 and G4, Aracaju-SE, 2015/2016
Domain in THI G2 G4
Mean Min Max SD Mean Min Max SD
Functional 16.79 0.0 40.0 12.58 18.65 0.0 44.0 12.61
Emotional 12.69 0.0 36.0 10.08 16.29 0.0 36.0 11.09
Catastrophic 8.65 0.0 20.0 38.13 8.91 0.0 20.0 6.05
THI Total 38.13 0.0 96.0 26.25 43.86 0.0 100.0 26.82
Level of impairment in
the quality of life MILD MILD
THI=Tinnitus Handicap Inventory; Min= minimum; Max=maximum; SD = standard deviation; G=group.
The analyses of the THI results by using
Mann-Whitney test did not show signiicant differences
when comparing the G2 and G4 groups in the functional (p = 0.1041), emotional (p = 0.4627), catastrophic (p
= 0.9152) and the subject’s general quality of life of(p = 0.2532). It conirms the indings of WHOQOL-BREF,
which showed that hearing loss does not interfere with the quality of life of the patients with tinnitus. In the THI, both groups presented moderate degree of discomfort to the tinnitus when the total score was evaluated, the average of G2 being 38.13 and that of G4 equal to 43.86.
The Figure 2 illustrates the correlation between the
WHOQOL-BREF and THI questionnaires. Spearman’s
correlation test showed that there is a negative and
signiicant correlation (r = -0.5570; p <0.0001), that is,
the greater the discomfort caused by tinnitus, the lower the level of quality of life.
W
H
O
Q
O
L
-B
R
E
F
THI
conversations. The mean scores of quality of life were statically lower in the G4 than in G1, what is agree with other authors who reported an important impact of tinnitus with hearing loss in a Korean population11. They also veriied that the group with tinnitus without hearing
loss had a better level of quality of life than the group with normal hearing and tinnitus, what indicates that tinnitus has a closer relationship with quality of life than hearing loss11.
When assessing the psychological domain, it was
veriied that subjects with normal hearing without
complaint of tinnitus have a higher average score when compared to those who have hearing loss and tinnitus, showing that alterations in the auditory system affect the psychic of individuals.
There was no statistical difference between groups in the environmental domain, and all of them presented low scores. This result indicates that the issues assessed in this area, such as physical security,
home environment, inancial resources, health and
social care, opportunities to acquire information and skills, opportunities of leisure and participation in recre-ational activities, physical environment (pollution/noise/
trafic/climate) and transport, are unsatisfactory for all
studied population.It should be emphasized that the population studied comes from a public health service, which usually has a low socioeconomic level, and it may be associated with the issues evaluated in the environmental domain -the domain with a lower score The psychoacoustic evaluation of tinnitus through
acuphenometry showed the frequency range in which
tinnitus was perceived by the subjects. The results
in each ear are presented in Table 5, frequencies
classiied aslow, medium and high.
In addition, there were no signiicant differences
when comparing the discomfortcaused by tinnitus
between subjects who perceived tinnitus in the low,
medium orhigh frequency ranges, for the right ear (p = 0.9634) and for the left ear (p = 0.0834 ). Likewise,
no signiicant differences were observed regarding thequality of life level, when compared thesubjects who
perceived tinnitusin the three frequency ranges,both in the right ear (p = 0.5308) and the left ear (p = 0.6045)
(Kruskal-Wallis test, followed by Dunn’s multiple
comparison test).
Table 5. distribution of the subjects with tinnitus (G2 and G4) by tinnitus frequency as measured in acuphenometry, Aracaju/SE, 2015/2016
Frequency range/tone Right ear Left ear
n (%) n (%)
Low (125 to 750Hz) 16 (25.0) 16 (22.8)
Medium (1000 to 3000Hz) 13 (20.3) 11 (15.8)
High (4000 to 8000Hz) 35 (54.7) 43 (61.4)
Total 64 (100.0) 70 (100.0)
DISCUSSION
The analysis of the population studied revealed a largest participation of women, which is in agreement with previous studies3,13. This data probably results
from the fact that women are more careful about their own health, seeking medical attention more often when compared to men.
The predominant educational level in the studied population was the primary education, which is probably related to low family income. Generally the population with a low socioeconomic level is the one that most seeks public health services, and the studied population herewas coming from a public University
Hospital.It was veriied that most of the subjects
reported receiving up to two minimum wages, what is in agreement with another study performed with
subjects attended in the primary care of the cities of Rio
de Janeiro and São Paulo13.
Since there were no statistically differences when compared the results of THI and WHOQOL-BREF considering different ages (young, adults and elderly), but the differences remain among groups, it was considered that tinnitus interferes in the general quality of life, independently of the age or the presence of associated hearing loss.This result demonstrates how
much the tinnitus bothers people’s daily life, even more than the discomfortgenerated by the dificulty to listen
- thus indicating a lack of housing conditions, basic sanitation and transportation, access to the media, health services, leisure and general information. Other authors found similar results regarding the low score in the environmental domain13,14.
When analyzing the THI instrument, it was observed that G2 and G4 presented a moderate-level ofdiscomfort with tinnitus, which means that tinnitus is perceived in the presence of a background noise, although daily activities can still be performed. Some authors also found mild discomfort to tinnitus in similar studies15,16
while others different results3,17. It reveals that tinnitus interferes in subjects’ quality of life independently of
having preserved or altered auditory thresholds.
The signiicant correlation found between the data analyzed revealed that the higher the subject’s
perception of tinnitus, the lower the generalquality of life level. Previous works have shown that the high
frequency tinnitus was reported by most of subjects18-20.
Another study found the highest occurrence of tinnitus in the medium frequencies15.The present study
corrob-orates previous works regarding the occurrence of high frequency of tinnitus, but it was not observed relation-ships between the frequency range and the discomfort
generated by to tinnitus.Therefore, it was veriied that
patients with tinnitus were uncomfortable with this symptom regardless they perceive it as low, medium
or high.Likewise, the quality of life level was not inlu -enced by the frequency range of tinnitus. Similar result was found in a previous work15, however a correlation
between frequency range and discomfort to tinnitus was observed: the higher the tinnitus frequency, the higher the THI score18.
It is important to alert the population about the inter-ference of tinnitus in the level of quality of life, as well as to develop means to reduce the discomfort caused by this symptom, then improving the quality of life of the
subjects.
CONCLUSION
Tinnitus interferes with the quality of life of individuals who have preserved or altered auditory thresholds. The
subjects complained of tinnitus presented a moderate
degree of discomfort to this symptom. Age did not
inluence subjects’ quality of life. Those patients with
sensorineural hearing loss and tinnitus complaint presented lower mean scores of quality of life than those with normal auditory thresholds without tinnitus complaint.
REFERENCES
1. Figueiredo RR, Azevedo AA. Introdução,
epidemiologia e classiicações. In: Figueiredo
RR, Azevedo AA (orgs). Zumbido. Rio de Janeiro: Revinter, 2013. p. 1-4.
2. Santoshi Kumari M, Madhavi J, Meganadh KR, Jyothy A. Association of tinnitus and hearing loss in ontological disorders: a decade-long epidemiological study in a South Indian population.
Braz. j. otorhinolaryngol. 2016;82(6):643-9.
3. Pinto PC, Sanchez TG, Tomita S. The impact of gender, age and hearing loss on tinnitus severity.
Braz. j. otorhinolaryngol. 2010;76(1):1824.
4. Kochkin S, Tyler R, Born J. Marketrak VIII: The prevalence of tinnitus in the United States and the
self-reported eficacy of various treatments. Hearing
Review. 2011;18(12):10-27.
5. Bhatt JM, Lin HW, Bhattacharyya N. Prevalence, severity, exposures and treatment patterns of tinnitus in the United States. JAMA Otolaryngol Head Neck Surg. 2016;142(10):959-65.
6. Oiticica J, Bittar RSM. Tinnitus prevalence in
the city of São Paulo. Braz. j. otorhinolaryngol.
2015;81(2):167-76.
7. Martinez C, Wallenhorst C, McFerran D, HallL DA.
Incidence rates of clinically signiicant tinnitus:
10-year trend from a cohort study in England. Ear Hear. 2015;36(3):69-75.
8. Gibrin PCD, Melo JJ, MarchioriI LLM. Prevalence of tinnitus complaints and probable association with hearing loss, diabetes mellitus and hypertension in elderly. CoDAS. 2013;25(2):176-80.
9. Weidt S, Delsignore A, Meyer M, Rufer M, Peter N, Drabe N et al. Which tinnitus-related characteristics affect current health-related quality of life and depression? A cross-sectional cohort study. Psychiatry Rsearch. 2016;237:114-21.
10. Gois RO, Gois BO, Pereira MCCS, Taguchi CK. State mental and impact of the tinnitus in the elderly. Rev. CEFAC. 2014;16(3):798-809.
11. Joo Y, Han K, Park KH. Association of hearing loss and tinnitus with health-related quality of life: The Korea National Health and Nutrition Examination Survey. PLOS ONE. 2015;10(6):1-10.
12. Mondelli MFCG, Rocha AB. Correlation between
the audiologic indings and buzz disturbing. Arq.
Int. Otorrinolaringoly. 2011;15(2):172-80.
with stressful life events and mental health. Ciência & Saúde Coletiva. 2016;21(2):497-508.
14. Olivares A, Bonito J, Silva R. Qualidade de vida no trabalho dos médicos da atenção básica no estado de Roraima (BRASIL). Psicologia, Saúde e Doenças. 2015;16(1):100-11.
15. Cribari J, Ribas A, Fonseca VR, Moretti CM, Zeigelboim BS, Martins J et al. Description of tinnitus and its relation to discomfort level in a group of elderly hearing aid wearers. Int Tinnitus J. 2016;20(1):36-41.
16. Lacerda ABN, Facco C, Zeigelboim BS, Cristoff K, Stechman Neto J, Fonseca VR. The impact of tinnitus on the quality of life in patients with temporomandibular dysfunction. Int Tinnitus J. 2016;20(1):24-30.
17. Cardoso NA, Hoshino ACH, Perez MA, Bastos WR, Carvalho DP, Câmara VM. Tinnitus in a riverside population exposed to methyl-mercury. Audiol Commun Res. 2014;19(1):40-4.
18. Morais AA, Gil D. Tinnitus in individuals without hearing loss and its relationship with
temporomandibular dysfunction. Braz. j.
otorhinolaryngol. 2012;78(2):59-65.
19. Seimetz BM, Teixeira AR, Rosito LPS, Flores LS,
Pappen CH, Dall’igna C. Pitch and loudness
tinnitus in individuals with presbycusis. Int Arch Otorhinolaryngol. 2016;20(4):321-6.