V. S. Chandel, S. Manohar, A. K. Srivastava, R. Manohar: An apparatus of increased precision for the measurement of electro-optical parameters of liquid crystals 40
AN APPARATUS OF INCREASED PRECISION FOR
THE MEASUREMENT OF ELECTRO-OPTICAL
PARAMETERS OF LIQUID CRYSTALS
Vishal Singh Chandel
1,*, Shashwati Manohar
2, Abhishek Kumar Srivastava
3,
Rajiv Manohar
31
Integral University, Lucknow - 226026, U. P. India.
2
RML Awadh University, Faizabad - 224001, U. P. India.
3
University of Lucknow, Lucknow - 226007, U. P. India.
*
corresponding author: e-mail: [email protected]
Resume
The ferroelectric liquid crystals (FLCs) are demanding high attention now a day, because of their potential applications in many electro-optical devices, particularly in displays. The suitable applications of FLCs in devices are decided by their electro-optical properties like tilt angle, birefringence and spontaneous polarization. In this paper we are presenting a new apparatus for highly accurate measurement of electro-optical parameters of FLCs. The accuracy of the apparatus is the best among the currently available equipments in the market. The accuracy and performance of the apparatus has been confirmed by performing the experiments on standard ferroelectric liquid crystals.
Available online: http://fstroj.uniza.sk/journal-mi/PDF/2013/05-2013.pdf
Article info Article history: Received 17 July 2012 Accepted 2 November 2012 Online 28 December 2012 Keywords:
Ferroelectric liquid crystal; Tilt angle;
Electro-optical properties; Spontaneous polarization.
ISSN 1335-0803 (print version) ISSN 1338-6174 (online version)
1. Introduction
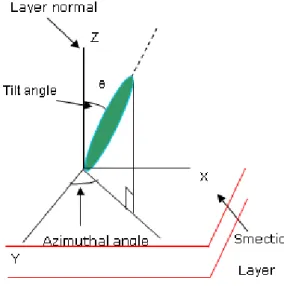
FLCs have some very useful advantages over the other type of liquid crystals, as their response time is less than their counterparts, due to which they can be used in high speed modulation devices, microsecond optical switches and high resolution displays. The most relevant parameters of FLCs affecting the performance of such devices are tilt angle, birefringence and spontaneous polarization. The FLCs have layered structure (in XY plane) and the layer normal is perpendicular as Z axis. The director of each planar layer is tilted at an angle from the layer normal (Fig. 1) known as tilt angle. The tilt angle is temperature dependent and behaves as order parameter for the FLCs and governs almost all of its physical properties. Therefore, precise measurement of tilt angle is required for the use of FLCs in different devices.
Fig. 1. The FLC geometry (full colour version available online)
There are several devices available for the measurement of the tilt angle of FLCs in the market [1 - 3]. Most of these equipments are based on pulse electro-optical techniques to measure the tilt angle and birefringence
This
copy
of
the
artic
le
wa
s
downloa
d
ed
from
ht
tp:
//
ww
w.ma
teng.
sk
,
onl
ine
ve
rsion
o
f
Ma
te
ria
ls
Engine
ering
-
Ma
te
riá
lov
é
inžinier
stvo
(ME
MI)
journa
l, IS
S
N 1335
-0803 (
print ve
rsion)
, ISS
N 13
38
-6174 (
onli
ne
ve
rsion)
. Online ve
of FLC systems. The accuracy of these apparatuses is quite low. One could measure the tilt angle with an accuracy of 1° [1 - 3]. There are some other techniques for such measurements like dielectric spectroscopy by which one could measure the tilt angle with the accuracy of few minutes. All these apparatus suffers not only from less accuracy but are highly expensive too. In this paper we are presenting low cost equipment having high accuracy and one could measure the tilt angle with an accuracy of 20 seconds. The performance of the apparatus has been confirmed by measuring the tilt angle and birefringence of planar aligned standard ferroelectric liquid crystal (FELIX 16/030, FELIX 17/100 and FELIX 17/000) at
temperature 25 °C.
2. Principle
The pulse electro-optical technique is well known for measurement of electro-optical properties of ferroelectric liquid crystals. This technique was first proposed by Baikalov et al. in 1985 [1]. For ferroelectric liquid crystal
the director is inclined by the angle (Fig. 1) to either side of the layer normal (say OZ axis). If the electric field of opposite polarity (say + E) is applied to the sample the director turns by
180° around the OZ axis, and director is now
inclined by the angle to other side of the layer normal OZ (i.e. right side of OZ). Under such conditions FLCs behaves like uniaxial optical plate with two possible directions of their optical axis corresponding to two different polarities of external electric field. These two directions are separated by an angle of 2 and both lie in XY plane. The tilt angle of the FLC geometry is half of this angle 2.
2.1 Design Details
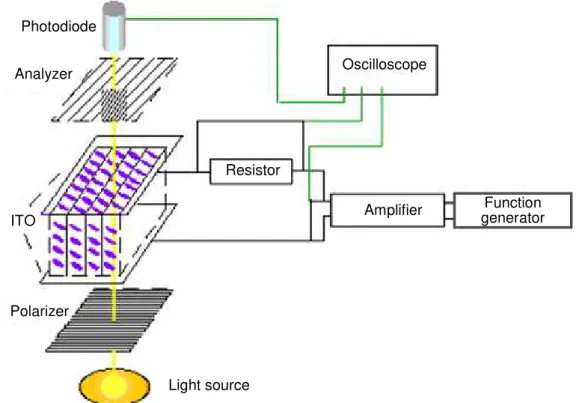
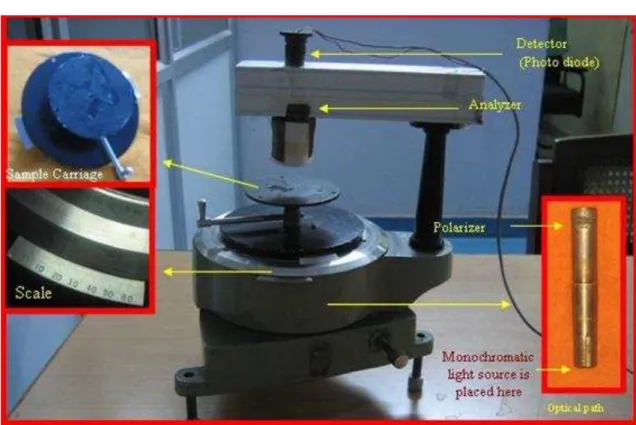
The block diagram of system is presented in Fig. 2. It consists of a monochromatic light source, crossed polarizer, a planar aligned liquid crystal cell and an optical signal detector placed after the analyzer. The coloured photograph of the designed apparatus has been given in the Fig. 3. The different parts of the equipment have been enlarged and shown in the insets of the Fig. 3.
Fig. 2. The schematic diagram of the designed apparatus (full colour version available online)
Photodiode
Analyzer
Resistor
Amplifier Function
generator Oscilloscope
Light source Polarizer
This arrangement has been developed by converting a manually operated spectrometer. The horizontal optic axis of the spectrometer has been replaced by a vertical optic axis and the axial levels have been maintained by the laser type of plumb line and spirit level (Fig. 3). Monochromatic light source (He-Ne Laser) has been fitted at the bottom side and light from this source passed through polarizer, which has been placed next to this monochromatic light source in the tube (Fig. 3). Turn table of the spectrometer has been converted in the liquid crystal cell carriage. One may place the liquid crystal cell on this carriage with or without any hot stage. This type of LC cell carriage arrangement allows us to rotate the cell in horizontal plane. The light coming from FLC sample passes through an analyzer and after that these optical signals are detected by detector like photomultiplier, phototransistor or photodiode. These detected optical signals have been fed to storage type of oscilloscope (Hemage 407).
2.2 Measurement Technique
To measure the tilt angle of the sample, square wave signal is applied to the cell.
On rotating the sample carriage around vertical axis, two minima will be observed for optical response (under crossed polarizer condition) corresponding to the different electric field polarities. Let the corresponding angles for these minima be 1 and 2 then the difference
between these angles will directly give the value of 2. Now keeping the sample carriage fixed at any one switching position and rotating the analyzer around the vertical axis, we can observe two absolute minima for both electric field polarities. Such positions of analyzer correspond to the directions of the principal axis of a polarization ellipse. The angle between these two minima is 2 + . Therefore, for a cell of known thickness d the phase delay between the ordinary and extraordinary light beam can be determined using the expression
2 nen0 d/ (1)tan 2 ß = tan 4 . cos (2)
Hence the optical anisotropy may be calculated as n = ne – n0 for various
wavelengths.
3. Accuracy and performance
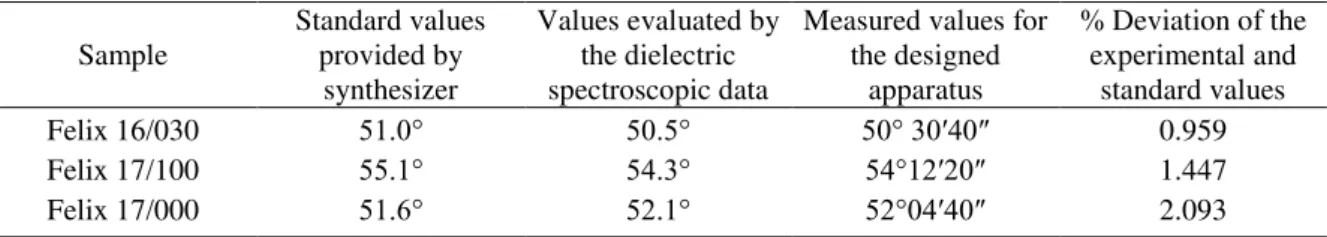
The performance and accuracy of the apparatus has been checked by performing the experiments on three standard ferroelectric liquid crystals Felix 16/000, Felix 17/100 and Felix 17/000 (Clariant Chemicals, Germany). The values of the measured tilt angle are then compared with the standard values and the values evaluated by the dielectric spectroscopic data [4, 5]. All the measurements have been performed at the temperature 25 °C. Table 1 represents the values of tilt angle obtained by this newly designed apparatus, evaluated by dielectric spectroscopic study and standard values provided by the company. Table also shows the deviation in the experimental and standard values.
The experimental values are slightly different from the standard values provided by manufacturer. It is also noted that this deviation from the standard value is different for the different samples, the maximum deviation in these values is 30΄ 40 or in other words the maximum percentage error is 2.093 %. The deviation in these values does not indicate the poor performance or less accuracy of the deigned apparatus. This is due to the different experimental conditions like sample holder surface interaction of FLC molecules, cell gap and the material used to align the FLC
molecules [6]. The effect of these conditions on such electro-optical parameters has already been discussed by many researchers and our group as well [5 - 7]. Therefore, the percentage error may differ for the different samples and with different experimental conditions.
To confirm this, the dielectric measurements have also been performed with the same experimental conditions and values of the tilt angle for all of the samples have been listed in the Table 1 [4, 5]. The values evaluated from the dielectric spectroscopy are comparable with the values measured by this newly designed apparatus. This shows that the accuracy of the apparatus is very good.
The birefringence for the FLCs have also been measured and listed in the Table 2. The values obtained from the apparatus are comparable with the standard values and the average % deviation is comparable with the standard data provided by the manufacturer. Different percentage deviations in the birefringence for all the samples are again due to the different experimental conditions. These experiments prove that the accuracy of the apparatus is as good as expected.
4. Conclusions
We have designed low cost equipment to measure different electro-optical parameters
Table 2 Values of the birefringence for all the samples at the temperature of 25 °C
Sample Standard values
provided by synthesizer
Measured values for the designed apparatus
% Deviation Felix 16/030
Felix 17/100 Felix 17/000
0.161 0.172 0.172
0.159 0.169 0.175
1.20 1.53 1.89
Table 1 Values of the double of the tilt angle for all the samples at the temperature of 25 °C
Sample
Standard values provided by
synthesizer
Values evaluated by the dielectric spectroscopic data
Measured values for the designed
apparatus
% Deviation of the experimental and
standard values Felix 16/030
Felix 17/100 Felix 17/000
51.0° 55.1° 51.6°
50.5° 54.3° 52.1°
50° 30 40 54°12 20 52°04 40
of ferroelectric liquid crystals. The least count of the apparatus is much better than any other equipment available in the market thus increasing the accuracy of measurement. The percentage error may differ for the different experimental conditions. The cost of the equipment is very low. We are also working on automizing this apparatus by using one servo motor for movement of turn table and analyzer which can be controlled by a microchip. This will be very useful for avoiding manual error in the process of measurement.
Acknowledgements
The authors are sincerely thankful to DST, New Delhi for the financial assistance in the form of project for the present work.
References
[1] V. A. Baikalov, L. A. Beresnev, L. M. Blinov: Mol. Cryst. Liq. Cryst. 127 (1985) 397-406. [2] D. M. Potukuchi, A. K. George, C. Carboni, S.
H. Al-Harthi, J. Naciri: Ferroelectrics 300 (2004) 79-93.
[3] V. Lapanik, V. Bezborodov, W. Haase, A. Lapanik: Mol. Cryst. Liq. Cryst. 324 (2006) 127-132.
[4] R. Manohar, A. K. Misra, A. K. Srivastava, P. B. Chand, J. P. Shukla: Soft Materials 5 (2007) 1-12.
[5] R. Manohar, S. P. Yadav, K. K. Pandey, A. K.
Srivastava, A. K. Misra: J. Polym. Res. 18 (2011) 435-441.
[6] J. F. Lyuu, C. C. Chen, J. Y. Lee: Mol. Cryst. Liq. Cryst. 329 (1999) 99-112.