BGD
9, 2623–2653, 2012Posidonia oceanica
trace element cycling C. Sanz-L ´azaro et al.
Title Page
Abstract Introduction
Conclusions References
Tables Figures
◭ ◮
◭ ◮
Back Close
Full Screen / Esc
Printer-friendly Version
Interactive Discussion
Discussion
P
a
per
|
Dis
cussion
P
a
per
|
Discussion
P
a
per
|
Discussio
n
P
a
per
|
Biogeosciences Discuss., 9, 2623–2653, 2012 www.biogeosciences-discuss.net/9/2623/2012/ doi:10.5194/bgd-9-2623-2012
© Author(s) 2012. CC Attribution 3.0 License.
Biogeosciences Discussions
This discussion paper is/has been under review for the journal Biogeosciences (BG). Please refer to the corresponding final paper in BG if available.
The role of the seagrass
Posidonia
oceanica
in the cycling of trace elements
C. Sanz-L ´azaro1,2,*, P. Malea3, E. T. Apostolaki2,4, I. Kalantzi2, A. Mar´ın1, and
I. Karakassis2
1
Departamento de Ecolog´ıa e Hidrolog´ıa, Facultad de Biolog´ıa, Universidad de Murcia,
Campus de Espinardo, 30100 Murcia, Spain
2
Marine Ecology Laboratory, Biology Department, University of Crete, P.O. Box 2208, 71409, Heraklion, Crete, Greece
3
Department of Botany, School of Biology, University of Thessaloniki, P.O. Box 109, 54124, Thessaloniki, Greece
4
Institute of Oceanography, Hellenic Centre for Marine Research, P.O. Box 2214, 71003, Heraklion, Crete, Greece
*
now at: Dipartimento di Biologia, University of Pisa, CoNISMa, via Derna 1, Pisa 56126, Italy
Received: 31 January 2012 – Accepted: 22 February 2012 – Published: 9 March 2012
Correspondence to: C. Sanz-L ´azaro (carsanz@um.es)
BGD
9, 2623–2653, 2012Posidonia oceanica
trace element cycling C. Sanz-L ´azaro et al.
Title Page
Abstract Introduction
Conclusions References
Tables Figures
◭ ◮
◭ ◮
Back Close
Full Screen / Esc
Printer-friendly Version
Interactive Discussion
Discussion
P
a
per
|
Dis
cussion
P
a
per
|
Discussion
P
a
per
|
Discussio
n
P
a
per
|
Abstract
The aim of this work was to study the role of the seagrassPosidonia oceanicaon the cycling of a wide set of trace elements (Ag, As, Ba, Bi, Cd, Co, Cr, Cs, Cu, Fe, Ga, Li, Mn, Ni, Pb, Rb, Sr, Tl, V and Zn). We measured the concentration of these trace elements in the different compartments of P. oceanica (leaves, rhizomes, roots and
5
epibiota) in a non-polluted seagrass meadow representative of the Mediterranean and calculated the annual budget from a mass balance. We provide novel data on accumu-lation dynamics of many trace elements inP. oceanicacompartments and demonstrate that trace element accumulation patterns are mainly determined by plant compartment rather than by temporal variability. Epibiota was the compartment which showed the
10
greatest concentrations for most trace elements. Thus, they constitute a key compart-ment when estimating trace elecompart-ment transfer to higher trophic levels byP. oceanica. For most trace elements, translocation seemed to be low and acropetal. Zn, Cd, Sr and Rb were the trace elements that showed the highest release rate through decomposition of plant detritus, while Cs, Tl and Bi the lowest.P. oceanicaacts as a sink of potentially
15
toxic trace elements (Ni, Cr, As and Ag), which can be sequestered, decreasing their bioavailability. P. oceanicamay have a relevant role in the cycling of trace elements in the Mediterranean.
1 Introduction
Seagrass meadows are considered one of the most valuable habitats in coastal areas
20
(Orth et al., 2006) and rank among the most productive habitats (Pergent et al., 1997; Duarte and Chiscano, 1999). Posidonia oceanica is the most abundant seagrass in the Mediterranean playing a key role in the cycling of matter in Mediterranean coasts (Pergent et al., 1994).
P. oceanica biomass can have very different fate according to the part of the plant.
25
BGD
9, 2623–2653, 2012Posidonia oceanica
trace element cycling C. Sanz-L ´azaro et al.
Title Page
Abstract Introduction
Conclusions References
Tables Figures
◭ ◮
◭ ◮
Back Close
Full Screen / Esc
Printer-friendly Version
Interactive Discussion
Discussion
P
a
per
|
Dis
cussion
P
a
per
|
Discussion
P
a
per
|
Discussio
n
P
a
per
|
buried in the sediment, the rest of it, mainly leaves, is mineralized, either in situ or in ad-jacent ecosystems (Pergent et al., 1994). Together with leaves, the algal epibiota that grows onP. oceanicaleaves account for a substantial part of the primary production of the seagrass meadows (Lepoint et al., 1999). Epibiota constitute a considerable and preferential food resource for herbivores (Tomas et al., 2005) and along with leaves,
5
rhizomes and roots, is a main compartment of the plant in the matter fluxes of this ecosystem.
Marine coastal systems are areas under pressure of many anthropogenic activities (Turner et al., 1996) and represent a sink for potential pollutants (Sanz-Lazaro and Marin, 2009), such as trace elements (Islam and Tanaka, 2004). Trace elements are
10
elements that occur naturally in very low concentrations in the environment and can be either essential (e.g., Co, Cu, Fe, Mn, Ni, Rb and V) or non essential (e.g., Li, Cd, Sr, Ba, Tl, Ag, Ga, Pb, Bi and Cs) to living organisms (Alloway, 1995). Trace elements are not necessarily toxic but many anthropogenic activities increase their natural concentrations causing pollution.
15
Seagrasses take up trace elements through leaves and roots (Schroeder and Thorhaug, 1980), which can be translocated among the parts of the plant. Since, seagrasses show different element accumulation patterns among their compartments (Lewis and Devereux, 2009), they may act as storage compartments and biological filters, favouring the decrease of toxic substances (Kaldy, 2006). They also can be
20
introduced into higher trophic levels of the ecosystem, through grazing and decompo-sition of leaves and epibiota (Lewis and Devereux, 2009).
To understand trace element cycling in seagrasses, it is important to study the accu-mulation trends in all plant compartments. Most of the works dealing with uptake and accumulation of trace elements inP. oceanicaand in other seagrasses have mainly
an-25
BGD
9, 2623–2653, 2012Posidonia oceanica
trace element cycling C. Sanz-L ´azaro et al.
Title Page
Abstract Introduction
Conclusions References
Tables Figures
◭ ◮
◭ ◮
Back Close
Full Screen / Esc
Printer-friendly Version
Interactive Discussion
Discussion
P
a
per
|
Dis
cussion
P
a
per
|
Discussion
P
a
per
|
Discussio
n
P
a
per
|
few trace elements, mainly Cd, Cr, Cu, Fe, Ni, Pb and Zn. Nevertheless, other trace elements that are essential and/or may be also toxic have been barely (Ag, As, Ba, Bi, Co, Cs, Li, Mn and Tl) (Pergent-Martini and Pergent, 2000 and references therein; Tovar-Sanchez et al., 2010) or not at all studied (Ga, Rb, Sr and V).
P. oceanica is expected to play a main role in the cycling of trace elements in the
5
coastal areas of the Mediterranean, due to its wide abundance, high productivity and capacity to accumulate trace elements.
The aim of this work was to study the role of P. oceanica in the cycling of a wide set of trace elements (Ag, As, Ba, Bi, Cd, Co, Cr, Cs, Cu, Fe, Ga, Li, Mn, Ni, Pb, Rb, Sr, Tl, V and Zn). Trace element concentrations were quantified in the different
10
compartments of P. oceanica (leaves, rhizomes, roots and epibiota) in six bimonthly samplings in a non-polluted meadow representative of the Mediterranean. An annual budget was calculated from a mass balance analysis.
2 Materials and methods
2.1 Study area
15
The study was conducted in a P. oceanica meadow in Sounion (37◦39.617′N, 23◦58.276′E), Aegean Sea (Greece), which has been taken as a reference area in other studies dealing with anthropogenic impact (Apostolaki et al., 2009a; Apostolaki et al., 2009b; Apostolaki et al., 2011). The meadow was situated in a shallow strait (14.5 m depth) with 5.5 cm s−1 bottom current speed The site was characterized by
20
coarse sand (0.90 mm diameter pore size), low percentage of silt/clay (4.83 %) and oxic conditions (353 mV redox potential). Concentration of dissolved inorganic nitrogen and phosphorus in the water column was 1.43 and 0.21 µM, respectively. Shoot den-sity was 312 shoots m−2, shoot or leaf biomass was 518 g dry wt m−2and shoot or leaf production was 377 g dry wt m−2
yr−1
(Apostolaki et al., 2009a).
BGD
9, 2623–2653, 2012Posidonia oceanica
trace element cycling C. Sanz-L ´azaro et al.
Title Page
Abstract Introduction
Conclusions References
Tables Figures
◭ ◮
◭ ◮
Back Close
Full Screen / Esc
Printer-friendly Version
Interactive Discussion
Discussion
P
a
per
|
Dis
cussion
P
a
per
|
Discussion
P
a
per
|
Discussio
n
P
a
per
|
2.2 Sampling procedure
Six bimonthly sampling events from June 2006 to April 2007 were done to integrate the natural variability along the year. During each sampling event and two months before the first one, 24 to 45P. oceanicashoots were punched with a hypodermic needle just above the leaf sheath according to a modified Zieman method (Alcoverro et al., 2000) to
5
measure growth. At each sampling event, punched shoots (including the below-ground parts) were collected in triplicates using cores to measure trace element concentration in plant tissues and in epibiota growing on the leaves of the plant. Divers inserted cores approximately 20 cm in the sediment, to enclose adequate number of punched shoots. Then, they gently dag the sediment around the core (from the exterior part), inserted
10
a knife to cut the roots and retrieved the enclosed shoots.
To estimate trace element loss rate through decomposition of P. oceanicadetritus, a litter bag experiment was conducted. In June 2006, the oldest alive leaf blades from different seagrass shoots were collected by hand. Then, 15 bags containing 10 g fresh weight of the senescent leaf blades with its epibiota were collected and enclosed
15
in a 1 mm pore size mesh bag. The bags were anchored under the canopy of the seagrass meadow. The bags were retrieved in triplicates one, two, three, four and six months after deployment, (i.e. from July until December 2006).
2.3 Laboratory analyses
In the laboratory, epibiota were gently scraped from the leaves andP. oceanica were
20
separated into new (i.e. unmarked tissue produced between sampling events) and old leaves, rhizomes and roots.P. oceanicatissues, epibiota, and detritus collected during each retrieval point of the litter bag experiment were dried at 70◦C for 48 h, ground to
powder and stored in a moisture-free atmosphere.
For the analysis of Ag, As, Ba, Bi, Cd, Co, Cr, Cs, Cu, Fe, Ga, Li, Mn, Ni, Pb, Rb,
25
BGD
9, 2623–2653, 2012Posidonia oceanica
trace element cycling C. Sanz-L ´azaro et al.
Title Page
Abstract Introduction
Conclusions References
Tables Figures
◭ ◮
◭ ◮
Back Close
Full Screen / Esc
Printer-friendly Version
Interactive Discussion
Discussion
P
a
per
|
Dis
cussion
P
a
per
|
Discussion
P
a
per
|
Discussio
n
P
a
per
|
for trace analysis), and 2 ml of 30 % H2O2(Fluka, TraceSelectUltra for trace analysis) were added. The reactor was maintained in a microwave digester for 40 min with a top temperature of 200◦C. For each batch of samples there was a blank (another reactor with all the reagents used in the digestion but without sample ofP. oceanica), which was used as a control of the reagents used, but also to check sample contamination
5
and differences among the sample digestions on each batch. Following digestion, the content of each vessel was poured into volumetric flasks and ultrapure water was added to make up 25 ml the final volume. Then, samples were stored at 4◦C. Trace element concentrations were done with an X-series inductively coupled plasma-mass spectrometer (ICP-MS; Thermo Fischer Scientific, Winsford, UK).
10
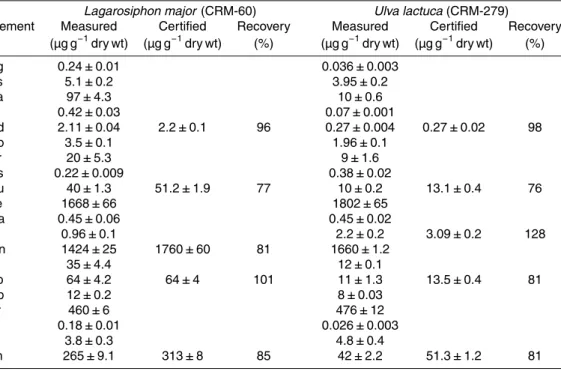
The limits of detection of the ICP-MS were calculated as three times the standard deviation of the blanks and were: 0.009 (Ag), 0.368 (As), 0.117 (Ba), 0.002 (Bi), 0.005 (Cd), 0.034 (Co), 1.766 (Cr), 0.001 (Cs), 0.524 (Cu), 42.51 (Fe), 0.005 (Ga), 0.204 (Li), 0.164 (Mn), 1.372 (Ni), 0.043 (Pb), 0.010 (Rb), 0.519 (Sr), 0.006 (Tl), 0.428 (V) and 6.009 (Zn) µg g−1. Yttrium and Indium were used as internal standards. The accuracy
15
of the technique was checked with the analysis of standard reference materials (Ulva lactucaCRM 279, Lagarosiphon major CRM 060, Community Bureau of Reference) and the measured values were in agreement with certified values (Table 1).
2.4 Calculations
Data on shoot biomass, shoot production rate, leaf shedding rate and leaf residual
20
loss rate (biomass consumed by herbivores or torn off by waves and currents) were obtained from Apostolaki et al. (2009a). Biomass (g dry wt m−2) of leaves, rhizomes and roots was estimated as the product of dry weight per shoot and shoot density (shoots dry wt m−2
) at each sampling event. Leaf production rate (g dry wt m−2 d−1
) at each sampling event was estimated as the product of dry weight of “new” leaf tissue
25
BGD
9, 2623–2653, 2012Posidonia oceanica
trace element cycling C. Sanz-L ´azaro et al.
Title Page
Abstract Introduction
Conclusions References
Tables Figures
◭ ◮
◭ ◮
Back Close
Full Screen / Esc
Printer-friendly Version
Interactive Discussion
Discussion
P
a
per
|
Dis
cussion
P
a
per
|
Discussion
P
a
per
|
Discussio
n
P
a
per
|
For rhizome and root production, we used the annual production rate (g dry wt m−2yr−1), since more detailed estimates were not possible. This
extrapola-tion was reasonable because belowground biomass growth ofP. oceanica shows low variation among seasons (Wittmann, 1984). In the case of rhizome, it was estimated as the sum of annual horizontal and vertical production rate. Annual horizontal
rhi-5
zome production rate (27.51 g dry wt m−2yr−1) was estimated as the product of annual rhizome elongation rate per apex, the horizontal rhizome biomass per cm of rhizome and apex density at the study area. Data on apex density were obtained from mea-surements at the same stations in June 2003 (D´ıaz-Almela, unpubl. data). Similarly, annual vertical rhizome production rate (27.96 g dry wt m−2yr−1), obtained from Marb `a
10
et al. (2006), was calculated as annual vertical rhizome elongation multiplied by the vertical rhizome biomass per cm of rhizome and mean shoot density during the study.
Annual root production rate (25.81 g dry wt m−2yr−1) was estimated by multiplying the maximum root biomass measured during this study with the mean root turnover (0.13 yr−1) estimated forP. oceanica(Duarte et al., 1998).
15
Leaf shedding rate (g dry wt m−2d−1) was calculated at each sampling event as the product of the number of leaf blades per shoot shed by senescence, the dry weight of the oldest leaf per shoot and the mean shoot density at the beginning and end of sampling interval, divided by the duration of sampling interval in days.
Leaf residual loss rate (g dry wt m−2d−1) at each sampling event was calculated from
20
leaf production rate minus leaf shedding rate and minus the difference in standing leaf biomass during the sampling interval, divided by time in days (Cebrian et al., 1997).
Trace element incorporation rate (EILi; µg dry wt m−2d−1) in leaf tissue at each sam-pling event was estimated as:
EILi=LPi×ECi,
25
where LPi is the leaf production rate (µg dry wt m−
2
BGD
9, 2623–2653, 2012Posidonia oceanica
trace element cycling C. Sanz-L ´azaro et al.
Title Page
Abstract Introduction
Conclusions References
Tables Figures
◭ ◮
◭ ◮
Back Close
Full Screen / Esc
Printer-friendly Version
Interactive Discussion
Discussion
P
a
per
|
Dis
cussion
P
a
per
|
Discussion
P
a
per
|
Discussio
n
P
a
per
|
incorporation rate (g dry wt m−2yr−1) is calculated as the mean of the trace element incorporation rates calculated at each sampling event.
Trace element incorporation rate for rhizomes and roots (EIRi, g dry wt m−2 yr−1
) was estimated as:
ERIi=RPi×ECoi;
5
where RPi is either, rhizome and root production rate (g dry wt m−2yr−1), and ECi is the corresponding annual mean trace element concentration (µg g−1dry wt). In the
case of rhizomes, the trace element incorporation rate was calculated separately for the horizontal vertical rhizome production. Then, both are summed up to obtain the trace element incorporation rate in rhizomes.
10
Trace element loss rate through leaf shedding (ELSi, µg dry wt m−
2
d−1) at each sam-pling event was estimated as:
ELSi=LSi×ECi,
where LSi is the leaf shedding rate (g dry wt m−2d−1) at the corresponding sampling event and ECi is the corresponding trace element concentration (µg g−1dry wt) of “old” 15
leaf tissue at the corresponding sampling event. Then, the annual mean trace element loss rate through leaf shedding (g dry wt m−2yr−1) was calculated as the mean of the trace element loss rates at each sampling event.
Trace element residual loss rate (ERLi; µg dry wt m−
2
d−1) at each sampling event was estimated as:
20
ERLi=RLi×ECi,
where RLi is the leaf residual loss rate (g dry wt m−2yr−1) at the corresponding
sam-pling event and ECi is the corresponding annual mean trace element concentration
(µg g−1dry wt) of leaf tissue at the corresponding sampling event. Then, the annual mean trace element residual loss rate (g dry wt m−2yr−1) was calculated as the mean
25
BGD
9, 2623–2653, 2012Posidonia oceanica
trace element cycling C. Sanz-L ´azaro et al.
Title Page
Abstract Introduction
Conclusions References
Tables Figures
◭ ◮
◭ ◮
Back Close
Full Screen / Esc
Printer-friendly Version
Interactive Discussion
Discussion
P
a
per
|
Dis
cussion
P
a
per
|
Discussion
P
a
per
|
Discussio
n
P
a
per
|
Trace element release rate through decomposition ofP. oceanica detritus was esti-mated as the fraction of element releasedk (d−1
) according to this formula:
Et=E0e−kt,
whereEt(µg dry wt trace element bag−1), is the element content at each retrieval event of the litter bag experiment, and was calculated by multiplying the weight of litter
5
mass at that time with the corresponding trace element concentration of leaf litter. E0 (µg trace element bag−1) is the initial element content and was calculated by multiplying the initial weight of litter mass with the corresponding trace element concentration of leaf litter.tis the time of retrieval (d) from the beginning of the experiment.kwas calcu-lated as the slope of the regression analysis between ln(EtE0−1) at each retrieval event
10
and time elapsed since the start of the experiment. Estimates of detritus decomposi-tion were obtained from Apostolaki et al. (2009b). We estimated annual trace element release rate through decomposition ofP. oceanica detritusk (yr−1) by multiplying the mean daily rate over a year with 365 days.
Annual trace element incorporation rate per shoot was calculated as the sum of
15
annual incorporation rates in leaves, rhizomes and roots. The trace element accu-mulation excess was calculated as the element incorporation minus the sum of both element loss sources (shedding, as well as grazing and mechanical grazing).
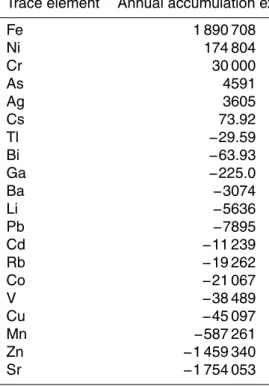
The annual trace element budget at basin level was calculated by extrapolating the total coverage ofP. oceanicain the Mediterranean, 50 000 km2estimated by Pasqualini
20
et al. (1998).
2.5 Data analyses
A two-way factorial ANOVA was used to analyze the variability in trace element concen-trations among plant compartments and time. The factors considered were compart-ment of the plant (four levels, fixed) and time(six levels, random). The independence
25
BGD
9, 2623–2653, 2012Posidonia oceanica
trace element cycling C. Sanz-L ´azaro et al.
Title Page
Abstract Introduction
Conclusions References
Tables Figures
◭ ◮
◭ ◮
Back Close
Full Screen / Esc
Printer-friendly Version
Interactive Discussion
Discussion
P
a
per
|
Dis
cussion
P
a
per
|
Discussion
P
a
per
|
Discussio
n
P
a
per
|
When variances were not homogeneous, data was ln(x+1) transformed. After trans-formation, some data was still not showing homogeneity of variances. In these cases, we analyzed the data untransformed, since ANOVA is considered robust to lack of homogeneity of variances with balanced designs and a considerable large amount of treatments (Underwood, 1997). ANOVA main effects may be difficult to interpret in the
5
presence of statistically significant interactions (Underwood, 1997), but in mixed effect ANOVAs, the test of the fixed main effect is potentially interpretable even in the pres-ence of an interaction (Quinn and Keough, 2002). Student–Newman–Keuls test was performed to check for a posteriori comparisons among levels after significant main effects in ANOVA.
10
Two principal component analysis (PCA) were performed to identify patterns in ele-ment concentrations amongP. oceanicacompartments along time. Both PCAs were based on a matrix with the concentrations of the elements (samples) on the plant com-partment for each sampling event (variables). Data was previously normalized (values for each variable have their mean subtracted and are divided by their standard
devia-15
tion) since element concentrations had different scales (Clarke and Gorley, 2006). One PCA was performed with all plant compartments to investigate the general element concentration patterns among all the compartments of P. oceanica along time. The other PCA comprised only the compartments of the plant that are physiologically con-nected, i.e. leaves, rhizomes and roots. This second PCA was intended to investigate
20
element translocation and discerned which elements showed similar accumulation pat-terns among plant compartments that are physiologically connected.
PERMANOVA was applied to compare the concentration patterns of the different trace elements in the compartments of the plant and along time using the complemen-tary package PERMANOVA+(v. 1) of the Primer software. The PERMANOVA design
25
BGD
9, 2623–2653, 2012Posidonia oceanica
trace element cycling C. Sanz-L ´azaro et al.
Title Page
Abstract Introduction
Conclusions References
Tables Figures
◭ ◮
◭ ◮
Back Close
Full Screen / Esc
Printer-friendly Version
Interactive Discussion
Discussion
P
a
per
|
Dis
cussion
P
a
per
|
Discussion
P
a
per
|
Discussio
n
P
a
per
|
an analysis of the homogeneity of variances in the univariate analyses. After checking that the results of the PERMDISP indicated that the dispersion of the data was homo-geneous, then the PERMANOVA analysis was performed. Both analyses comprised 9999 permutations. Multivariate analyses were done with Primer (v6) software pack-age. All statistical tests were conducted with a significance level ofα=0.05 and data
5
was reported as mean±standard deviation (SD).
3 Results
Annual concentrations showed very different scales among trace elements, varying from thousands (Sr and Fe) to thousandths (Bi, Cs and Tl) of µg g−1dry wt (Table 2). Different trace elements exhibited contrasting accumulation patterns amongP.
ocean-10
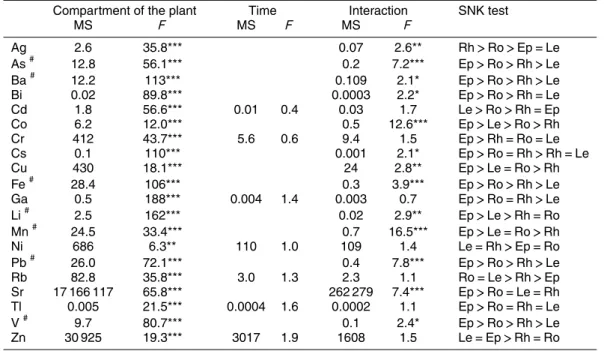
ica compartments (Fig. 1; Tables 2 and 3). All trace elements showed significant (p <0.01) differences on trace element concentrations among plant compartments, while there were no significant temporal variations for Cd, Cr, Ga, Ni, Rb, Tl and Zn. For Ag, As, Ba, Bi, Co, Cs, Cu, Fe, Li, Mn, Pb, Sr, and V; the main effecttimecould not be tested because there was an interaction between the two factors (compartment of
15
the plantandtime; Table 3).
The PCA plot based on trace element concentrations in all P. oceanica compart-ments grouped samples according to plant compartcompart-ments. PC1 and PC2 explained, respectively, 68 and 14 % of the variation. Epibiota samples stood out from the rest of the plant compartments along PC1. Leave samples were at the opposite position from
20
rhizome and root samples for PC2. Epibiota was the plant compartment that showed the greatest temporal variation (Fig. 1).
The main test of the PERMANOVA showed significant differences for the factor com-partment of the plant(p=0.0001). Since the interaction between both factors was sig-nificant (p=0.0002), the other factor,time, could not be tested. The pair-wise test of
25
BGD
9, 2623–2653, 2012Posidonia oceanica
trace element cycling C. Sanz-L ´azaro et al.
Title Page
Abstract Introduction
Conclusions References
Tables Figures
◭ ◮
◭ ◮
Back Close
Full Screen / Esc
Printer-friendly Version
Interactive Discussion
Discussion
P
a
per
|
Dis
cussion
P
a
per
|
Discussion
P
a
per
|
Discussio
n
P
a
per
|
compartments, showing that trace element concentration among plant compartments was highly dependent on the trace element.
The epibiota samples showed significantly (p <0.05) highest concentrations in most elements (As, Ba, Bi, Co, Cr, Cs, Cu, Fe, Ga, Li, Mn, Pb, Sr, Tl and V; Fig. 1 and Tables 2 and 3). Out of these trace elements, As, Ba, Bi, Cr, Cs, Fe, Ga, Pb, Sr, Tl and
5
V showed the lowest concentrations on leaves, while Co, Cu, Li, Mn and Zn showed, to some extent, high concentrations on leaves. Cd, Ni and Rb were the elements which had the highest concentrations in leaves. Ag had significantly (p <0.05) greatest concentrations in rhizome samples, although the concentration of this element in roots was relatively high (Fig. 1 and Table 2).
10
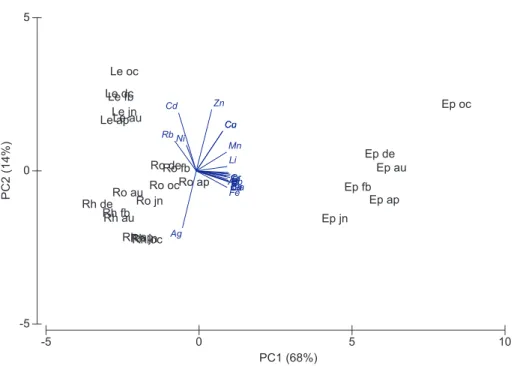
The PCA that only comprised leaves, rhizomes and roots, grouped samples mainly according to plant compartments. Roots and rhizomes showed higher temporal varia-tion in trace element concentravaria-tion compared to leaves (Fig. 2). PC1 explained 47 % of the variation and gathered, on the one hand, all leave samples and rhizome samples from February, August and December, and, on the other had, root and the
remain-15
ing rhizome samples. PC2 explained 28 % of the variation and grouped, on the one hand, leave and most root samples, while on the other grouped rhizome samples and the root sample from August (Fig. 2). The PCA ofP. oceanicacompartments that are physiologically connected plotted same metals very close together, indicating very sim-ilar accumulation patterns among these plant compartments. This was the case for:
20
Co and Cu; Mn and Rb; As, Bi, Fe and Pb; Cs and V; Ba, Ga and Tl. In opposition, Ag and Ni showed particular accumulation patterns that markedly differed from the rest of the metals (Fig. 2).
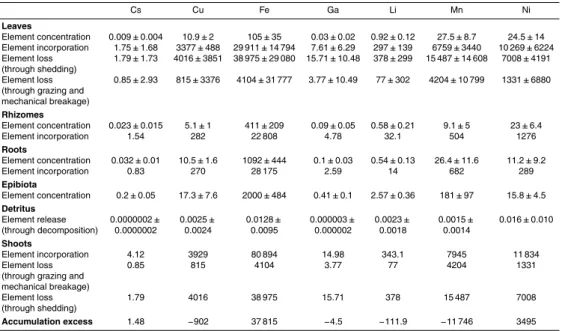
Zn, Cd, Sr and Rb showed the highest release rates through decomposition of P. oceanica detritus, while Cs, Tl and Bi showed the lowest (Table 2). According to
25
the obtained budget, Fe was the trace element with the greatest incorporation rate (37 815 µg dry wt m−2yr−1), followed by Ni, Cr, As, Ag and Cs. Sr was the trace
BGD
9, 2623–2653, 2012Posidonia oceanica
trace element cycling C. Sanz-L ´azaro et al.
Title Page
Abstract Introduction
Conclusions References
Tables Figures
◭ ◮
◭ ◮
Back Close
Full Screen / Esc
Printer-friendly Version
Interactive Discussion
Discussion
P
a
per
|
Dis
cussion
P
a
per
|
Discussion
P
a
per
|
Discussio
n
P
a
per
|
trace element release and incorporation for the Mediterranean basin were considerably high for some elements such as Sr (1754 kg dry wt yr−1
) and Fe (1891 kg dry wt yr−1 ), respectively (Table 4).
4 Discussion
Trace elements are toxic above certain concentrations on marine life (Alloway, 1995).
5
We choose the studied trace elements since all of them are potentially toxic above natural concentrations and because some of them are essential for organisms.
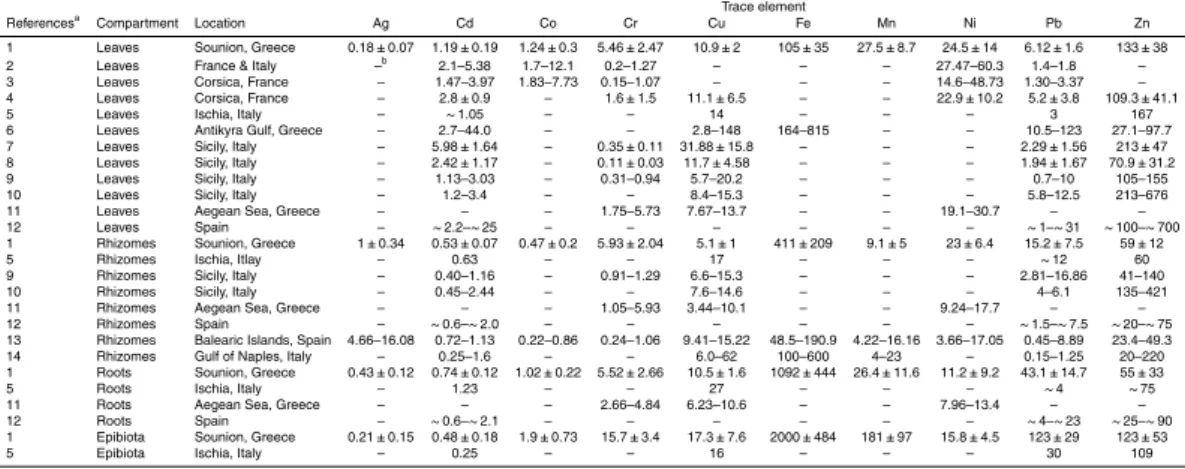
Trace element concentrations in this study were mainly within the range of values re-ported forP. oceanicain previous studies (Table 5). Cr and Pb were the only elements whose concentrations were generally high compared to previously reported data
(Ta-10
ble 5). The only source of pollution that, to the best of our knowledge, is close to the studied site is a fish farm (1 km away). The studied site has been used in many studies as a reference site and widely proved not to be affected by this facility (e.g., Apostolaki et al., 2011). Besides, concentrations of Cr and Pb inP. oceanica compartments at 20 m from the fish farm were similar or moderately lower than in the studied site
(un-15
publ. data.). Furthermore, Cr and Pb are not pollutants derived from fish farming (Dean et al., 2007; Sanz-Lazaro et al., 2011). Thus, the relatively high concentrations found in this experiment maybe due to a unknown diffuse source of these trace elements or because the basal level of the area has naturally high Cr and Pb levels.
For some trace elements that we did not found previous reported concentrations in
20
P. oceanica(As, Ba, Li and Sr), the values reported here were within the same range of other seagrasses, such asThalassia testudinum(Whelan et al., 2005) andZostera capricorni, (Sanchez-Jerez et al., 2002). For Bi, Cs, Ga, Rb, Tl and V, we did not find previous reported concentrations in seagrasses. The compartments which showed the greatest lack of trace element concentration data were the roots and epibiota (Table 5).
25
BGD
9, 2623–2653, 2012Posidonia oceanica
trace element cycling C. Sanz-L ´azaro et al.
Title Page
Abstract Introduction
Conclusions References
Tables Figures
◭ ◮
◭ ◮
Back Close
Full Screen / Esc
Printer-friendly Version
Interactive Discussion
Discussion
P
a
per
|
Dis
cussion
P
a
per
|
Discussion
P
a
per
|
Discussio
n
P
a
per
|
oceanicacompartments, which helps to understand their cycling dynamics in seagrass meadows.
Marine macrophytes, i.e. seagrasses and macroalgae, accumulate trace elements, but seagrasses, opposed to macroalgae, have a well developed belowground system. On the one hand, this detritus is very recalcitrant and can form mattes where roots and
5
rhizomesP. oceanicacan persist for thousand of years (Mateo et al., 1997). Because of that, a fraction of the trace metals accumulated byP. oceanicais sequestered, reducing the total amount that is available to other organisms (Pergent et al., 1997). On the other hand, seagrasses, since they have roots, can also mobilized metals that are buried in the sediment (Amado et al., 2004). Depending on the plant compartment where the
10
trace elements are mainly accumulated and on their incorporation and loss dynamics,
P. oceanicacan act as a sink or source of these elements.
Trace element concentrations were mainly dependent on plant compartment rather than on time and the accumulation trends among plant compartments varied depend-ing on each trace element (Fig. 1; Tables 2 and 3). This differential accumulation
15
patterns within plant compartments has been reported for some metals inP. oceanica
(Catsiki and Panayotidis, 1993; Schlacher-Hoenlinger and Schlacher, 1998; Sanchiz et al., 2000) and other seagrasses (Lyngby and Brix, 1984; Llagostera et al., 2011). We found preferential accumulation of Cd and Zn in the above-ground plant parts com-pared to roots (Pergent-Martini and Pergent 2000 and references therein).
20
Cd, Cu and Zn had a higher accumulation in the leaves than in the rhizomes (Sanchiz et al., 2000; Campanella et al., 2001; Tranchina et al., 2005), while Cr, Fe and Pb showed an opposed trend (Lewis and Devereux, 2009). The accumulation dynamics inP. oceanica compartments (leaves, rhizomes, roots and epibiota) agreed to some extent with Schlacher-Hoenlinger and Schlacher (1998) for Cd, Pb and Zn, while for Cu
25
BGD
9, 2623–2653, 2012Posidonia oceanica
trace element cycling C. Sanz-L ´azaro et al.
Title Page
Abstract Introduction
Conclusions References
Tables Figures
◭ ◮
◭ ◮
Back Close
Full Screen / Esc
Printer-friendly Version
Interactive Discussion
Discussion
P
a
per
|
Dis
cussion
P
a
per
|
Discussion
P
a
per
|
Discussio
n
P
a
per
|
Trace element uptake and translocation in seagrasses differs depending on the trace element and plant tissue. This specificity depends on the chemical properties of each trace element (Pulichm, 1987). We found that some groups of trace elements have similar accumulation patterns. This was the case of: Co and Cu; Mn and Rb; As, Bi, Fe and Pb; Cs and V; Ba, Ga and Tl (Fig. 2). Thus, trace elements within each
5
of these groups are expected to have very similar uptake and translocation pathways in P. oceanica. On the other hand, Ag and Ni showed very different accumulation dynamics with the rest of the trace elements, indicating unique uptake and translocation dynamics.
Element translocation dynamics in seagrasses are hard to elucidate since
sea-10
grasses take up trace elements by leaves and roots (Schroeder and Thorhaug, 1980). Thus, trace elements that mainly accumulate in the rhizomes are expected to have a high translocation rate either from leaves and/or roots. In this experiment, this was only the case for Ag (Tables 2 and 3). Also, trace elements that have similar concen-trations in all the compartments of the plant that are physiologically connected are also
15
expected to have a considerable translocation rate. This was the case for Cr and Sr. For some trace elements, accumulation trend followed the order: roots>rhizomes>leaves. These were: As, Ba, Bi, Cs, Fe, Ga, Pb, Tl and V. While other trace elements accumulated in the order: leaves>roots>rhizomes. These were: Cd, Co, Cu and Mn (Tables 2 and 3). These observations seem to
20
indicate that, for most analyzed trace elements, translocation was low and acropetal. In fact, under oligotrophic scenarios such as the Mediterranean sea, seagrass nutrient root uptake may notably exceed leaf uptake (Stapel et al., 1996). Thus, acropetal translocation is expected to be the main direction of element translocation.
Among allP. oceanicacompartments, epibiota was the one that showed the greatest
25
BGD
9, 2623–2653, 2012Posidonia oceanica
trace element cycling C. Sanz-L ´azaro et al.
Title Page
Abstract Introduction
Conclusions References
Tables Figures
◭ ◮
◭ ◮
Back Close
Full Screen / Esc
Printer-friendly Version
Interactive Discussion
Discussion
P
a
per
|
Dis
cussion
P
a
per
|
Discussion
P
a
per
|
Discussio
n
P
a
per
|
Pergent-Martini and Pergent, 2000). In this study, there were no significant differences on trace element concentrations among sampling events for all the trace elements for which the main effect time could be tested. In the case of trace element variation among plant compartments, there were significant differences among plant compart-ments for all trace elecompart-ments (Table 3). Furthermore, PCA plot showed that samples
5
were mainly grouped according to plant compartment than to sampling events (Fig. 1). So, although the concentrations of trace elements showed temporal variations to some extent, plant compartment was the main driver of trace element concentrations.
Accumulation of trace elements was significantly higher in epibiota for most trace el-ements (Table 3). High concentrations in epibiota may be due to its great accumulation
10
capacity of trace elements (Sanz-Lazaro et al., 2011), but also to seagrass leaching of elements through leaves, which is a pathway to transfer elements from sediments to epibiota (Mcroy and Goering, 1974) . Thus, epibiota is expected to play a relevant role in the accumulation and transfer of trace elements inP. oceanica meadows. Epibiota should be taken into consideration when studying trace element cycling inP. oceanica
15
as well as in other seagrass meadows, since it is ubiquitous on the leaves of seagrass species.
P. oceanica, as other seagrasses, is considered a bioindicator of trace elements (Lafabrie et al., 2007), but most studies have focused on leaves and/or rhizomes of the plant (Pergent-Martini and Pergent, 2000). This can lead to a underestimation of
20
the concentration of some trace elements which may have higher accumulation rates in other compartments such as roots or epibiota. To avoid this, it is essential to have information on the accumulation dynamics of different trace elements among seagrass compartments. Hence, this work provides novel data on this field.
Zn, Cd, Sr and Rb were the trace elements that showed the highest release rate
25
BGD
9, 2623–2653, 2012Posidonia oceanica
trace element cycling C. Sanz-L ´azaro et al.
Title Page
Abstract Introduction
Conclusions References
Tables Figures
◭ ◮
◭ ◮
Back Close
Full Screen / Esc
Printer-friendly Version
Interactive Discussion
Discussion
P
a
per
|
Dis
cussion
P
a
per
|
Discussion
P
a
per
|
Discussio
n
P
a
per
|
Based on the mass balance analysis, this study shows that P. oceanica acts as a sink for Fe, Ni, Cr, As, Ag and Cs. Out of these elements, Fe was the element that had the highest incorporation rate. This is maybe because Fe is a micronutrient which normally limits primary production, specially in the Mediterranean (Marba et al., 2007). The rest of the elements for whichP. oceanica acts as a sink (Ni, Cr, As, Ag and Cs)
5
are common pollutants at relatively low concentrations (Lewis and Devereux, 2009). According to our calculations, in the case of Ni,P. oceanicain the whole Mediterranean can sequester∼175 kg in a year (Table 4). The high incorporation rate of some trace elements byP. oceanica in the Mediterranean basin (Table 4) points to the major role thatP. oceanicamay have in sequestering some potentially toxic trace elements, and
10
reducing their bioavailability.
Even though, we acknowledge the limitations of doing an estimate for the whole Mediterranean based in just one meadow, this estimation can be a good starting point, since, to the best of our knowledge it has never been done before for many trace ele-ments. Furthermore, the studiedP. oceanicameadow can be taken as representative
15
of the Mediterranean for the following reasons. Firstly, the primary production rate of theP. oceanicameadow sampled (377 g dry wt m−2yr−1) is close to the mean produc-tion rate ofP. oceanicameadows in the Mediterranean (352 g dry wt m−2yr−1) (Pergent et al., 1997). Secondly, the characteristics of the studied P. oceanicameadow, such as, depth (14.5 m), mean shoot density (312 shoots m−2), biomass (518 g dry wt m−2)
20
and mean rate of decomposition (0.0033 d−1
reported in Apostolaki et al., 2009b) are similar to otherP. oceanicameadows (Pergent et al., 1994, 1997).
Apart from the many important ecosystem functions that have been reported on
P. oceanica (Hemminga and Duarte, 2000), the present work demonstrates that P. oceanicaacts as a sink of potentially toxic trace elements. Further studies should be
25
BGD
9, 2623–2653, 2012Posidonia oceanica
trace element cycling C. Sanz-L ´azaro et al.
Title Page
Abstract Introduction
Conclusions References
Tables Figures
◭ ◮
◭ ◮
Back Close
Full Screen / Esc
Printer-friendly Version
Interactive Discussion
Discussion
P
a
per
|
Dis
cussion
P
a
per
|
Discussion
P
a
per
|
Discussio
n
P
a
per
|
Acknowledgements. We are grateful to S. A. Pergantis from the Chemistry Department of Uni-versity of Crete who kindly allowed the use of the ICP-MS and assisted us with analytical issues. This work was funded by the General Secretariat for Research and Technology (IBIS Project) and facilitated by the COST Action ES0906 “Seagrass Productivity: from genes to ecosystem management”. CS was supported by the Ministerio de Educaci ´on y Ciencia of Spain. We
5
would like to thank T. Tsagaraki, I. Glabedakis, V. Pefanis-Vassilatos and N. Kouroubalis for assistance with sampling.
References
Alcoverro, T., Manzanera, M., and Romero, J.: Nutrient mass balance of the seagrass
Posido-nia oceanica: the importance of nutrient retranslocation, Mar. Ecol.-Prog. Ser., 194, 13–21,
10
2000.
Alloway, B. J.: Heavy Metals in Soils, Blackie Academi & Professional, Glasgow, 1995.
Amado, G. M., Creed, J. C., Andrade, L. R., and Pfeiffer, W. C.: Metal accumulation by Halodule
wrightii populations, Aquat. Bot., 80, 241–251, 2004.
Ancora, S., Bianchi, N., Butini, A., Buia, M. C., Gambi, M. C., and Leonzio, C.: Posidonia
15
oceanica as a biomonitor of trace elements in the Gulf of Naples: temporal trends by lepi-dochronology, Environ. Toxicol. Chem., 23, 1093–1099, 2004.
Apostolaki, E. T., Marba, N., Holmer, M., and Karakassis, I.: Fish farming enhances biomass
and nutrient loss in Posidonia oceanica(L.) Delile, Estuar. Coast. Shelf S., 81, 390–400,
2009a.
20
Apostolaki, E. T., Marba, N., Holmer, M., and Karakassis, I.: Fish farming impact on
decompo-sition ofPosidonia oceanicalitter, J. Exp. Mar. Biol. Ecol., 369, 58–64, 2009b.
Apostolaki, E. T., Holmer, M., Marba, N., and Karakassis, I.: Reduced carbon sequestration
in a Mediterranean seagrass (Posidonia oceanica) ecosystem impacted by fish farming,
Aquacult. Environ. Interact., 2, 49–59, 2011.
25
Campanella, L., Conti, M. E., Cubadda, F., and Sucapane, C.: Trace metals in seagrass, algae and molluscs from an uncontaminated area in the Mediterranean, Environ. Pollut., 111, 117– 126, 2001.
BGD
9, 2623–2653, 2012Posidonia oceanica
trace element cycling C. Sanz-L ´azaro et al.
Title Page
Abstract Introduction
Conclusions References
Tables Figures
◭ ◮
◭ ◮
Back Close
Full Screen / Esc
Printer-friendly Version
Interactive Discussion
Discussion
P
a
per
|
Dis
cussion
P
a
per
|
Discussion
P
a
per
|
Discussio
n
P
a
per
|
seagrasses posidonia-oceanica and cymodocea-nodosa (potamogetonaceae) from Greek coastal areas, Chemosphere, 26, 963–978, 1993.
Cebrian, J., Duarte, C. M., Marba, N., and Enriquez, S.: Magnitude and fate of the production of four co-occurring Western Mediterranean seagrass species, Mar. Ecol.-Prog. Ser., 155, 29–44, 1997.
5
Clarke, K. R. and Gorley, R. N.: Primer v6: User Manual/Tutorial PRIMER-E Ltd, Plymouth, UK, 2006.
Conti, M. E., Iacobucci, M., and Cecchetti, G.: A biomonitoring study: trace metals in seagrass, algae and molluscs in a marine reference ecosystem (Southern Tyrrhenian Sea), Int. J. En-viron. Pollut., 29, 308–332, 2007.
10
Conti, M. E., Bocca, B., Iacobucci, M., Finoia, M. G., Mecozzi, M., Pino, A., and Alimonti, A.: Baseline trace metals in seagrass, algae, and mollusks in a Southern Tyrrhenian ecosystem (Linosa Island, Sicily), Arch. Environ. Con. Tox., 58, 79–95, 2010.
Dean, R. J., Shimmield, T. M., and Black, K. D.: Copper, zinc and cadmium in marine cage fish farm sediments: an extensive survey, Environ. Pollut., 145, 84–95, 2007.
15
Duarte, C. M. and Chiscano, C. L.: Seagrass biomass and production: a reassessment, Aquat. Bot., 65, 159–174, 1999.
Duarte, C. M., Merino, M., Agawin, N. S. R., Uri, J., Fortes, M. D., Gallegos M. E., Marba, N., and Hemminga, M. A.: Root production and belowground seagrass biomass, Mar. Ecol.-Prog. Ser., 171, 97–108, 1998.
20
Gosselin, M., Bouquegneau, J. M., Lefebvre, F., Lepoint, G., Pergent, G., Pergent-Martini, C.,
and Gobert, S.: Trace metal concentrations inPosidonia oceanicaof North Corsica
(North-western Mediterranean Sea): use as a biological monitor?, BMC Ecol., 6, 12, 2006.
Hemminga, M. A. and Duarte, C. M.: Seagrass Ecology, Cambridge University Press, Cam-bridge, 2000.
25
Islam, M. S. and Tanaka, M.: Impacts of pollution on coastal and marine ecosystems including coastal and marine fisheries and approach for management: a review and synthesis, Mar. Pollut. Bull., 48, 624–649, 2004.
Kaldy, J. E.: Carbon, nitrogen, phosphorus and heavy metal budgets: how large is the eelgrass (Zostera marinaL.) sink in a temperate estuary?, Mar. Pollut. Bull., 52, 342–353, 2006.
30
Lafabrie, C., Pergent, G., Kantin, R., Pergent-Martini, C., and Gonzalez, J. L.: Trace metals assessment in water, sediment, mussel and seagrass species – Validation of the use of
BGD
9, 2623–2653, 2012Posidonia oceanica
trace element cycling C. Sanz-L ´azaro et al.
Title Page
Abstract Introduction
Conclusions References
Tables Figures
◭ ◮
◭ ◮
Back Close
Full Screen / Esc
Printer-friendly Version
Interactive Discussion
Discussion
P
a
per
|
Dis
cussion
P
a
per
|
Discussion
P
a
per
|
Discussio
n
P
a
per
|
Lafabrie, C., Pergent-Martini, C., and Pergent, G.: Metal contamination ofPosidonia
ocean-icameadows along the Corsican coastline (Mediterranean), Environ. Pollut., 151, 262–268,
2008.
Lepoint, G., Havelange, S., Gobert, S., and Bouquegneau, J. M.: Fauna vs. flora contribution to
the leaf epiphytes biomass in aPosidonia oceanicaseagrass bed (Revellata Bay, Corsica),
5
Hydrobiologia, 394, 63–67, 1999.
Lewis, M. A. and Devereux, R.: Nonnutrient anthropogenic chemicals in seagrass ecosystems:
fate and effects, Environ. Toxicol. Chem., 28, 644–661, 2009.
Llagostera, I., Perez, M., and Romero, J.: Trace metal content in the seagrass Cymodocea
nodosa: differential accumulation in plant organs, Aquat. Bot., 95, 124–128, 2011.
10
Lyngby, J. E. and Brix, H.: The uptake of heavy-metals in eelgrass zostera-marina and their
effect on growth, Ecol. Bull., 36, 81–89, 1984.
Malea, P. and Haritonidis, S.: Cymodocea nodosa (Ucria) aschers. as a bioindicator of metals in Thermaikos Gulf, Greece, during monthly samplings, Bot. Mar., 42, 419–430, 1999. Malea, P., Haritonidis, S., and Kevrekidis, T.: Seasonal and local variations of metal
concen-15
trations in the seagrass posidonia-oceanica (L) delile in the Antikyra Gulf, Greece, Sci. Total Environ., 153, 225–235, 1994.
Malea, P., Boubonari, T., and Kevrekidis, T.: Iron, zinc, copper, lead and cadmium contents in Ruppia maritima from a Mediterranean coastal lagoon: monthly variation and distribution in
different plant fractions, Bot. Mar., 51, 320–330, 2008.
20
Marba, N., Santiago, R., Diaz-Almela, E., Alvarez, E., and Duarte, C. M.: Seagrass (Posidonia
oceanica) vertical growth as an early indicator of fish farm-derived stress, Estuar. Coast. Shelf S., 67, 475–483, 2006.
Marba, N., Calleja, M. L., Duarte, C. M., Alvarez, E., Diaz-Almela, E., and Holmer, M.: Iron
additions reduce sulfide intrusion and reverse seagrass (Posidonia oceanica) decline in
car-25
bonate sediments, Ecosystems, 10, 745–756, 2007.
Mateo, M. A., Romero, J., Perez, M., Littler, M. M., and Littler, D. S.: Dynamics of millenary
or-ganic deposits resulting from the growth of the Mediterranean seagrassPosidonia oceanica,
Estuar. Coast. Shelf S., 44, 103–110, 1997.
Mcroy, C. P. and Goering, J. J.: Nutrient transfer between seagrass zostera-marina and its
30
epiphytes, Nature, 248, 173–174, 1974.
BGD
9, 2623–2653, 2012Posidonia oceanica
trace element cycling C. Sanz-L ´azaro et al.
Title Page
Abstract Introduction
Conclusions References
Tables Figures
◭ ◮
◭ ◮
Back Close
Full Screen / Esc
Printer-friendly Version
Interactive Discussion
Discussion
P
a
per
|
Dis
cussion
P
a
per
|
Discussion
P
a
per
|
Discussio
n
P
a
per
|
Williams, S. L.: A global crisis for seagrass ecosystems, Bioscience, 56, 987–996, 2006.
Pasqualini, V., Pergent-Martini, C., Clabaut, P., and Pergent, G.: Mapping ofPosidonia oceanica
using aerial photographs and side scan sonar: application offthe Island of Corsica (France),
Estuar. Coast. Shelf S., 47, 359–367, 1998.
Pergent, G., Romero, J., Pergent-Martini, C., Mateo, M. A., and Boudouresque C. F.: Primary
5
production, stocks and fluxes in the Mediterranean seagrass posidonia-oceanica, Mar. Ecol.-Prog. Ser., 106, 139–146, 1994.
Pergent, G., Rico-Raimondino, V., and Pergent-Martini, C.: Fate of primary production in
Posi-donia oceanicameadows of the Mediterranean, Aquat. Bot., 59, 307–321, 1997.
Pergent-Martini, C. and Pergent, G.: Marine phanerogams as a tool in the evaluation of marine
10
trace-metal contamination: an example from the Mediterranean, Int. J. Environ. Pollut., 13, 126–147, 2000.
Pulichm, W. M.: Subtropical seagrasses and trace metal cycling, Proceedings of the sympo-sium on subtropical-tropical seagrasses of the Southeastern United States, 12 August 1985, Gainesville, Florida, USA, 42, 39–52, 1987.
15
Quinn, G. P. and Keough, M. J.: Experimental design and data analysis for biologists, Cam-bridge University Press, CamCam-bridge, 2002.
Sanchez-Jerez, P., Gillanders, B. M., and Kingsford, M. J.: Spatial variability of trace elements in fish otoliths: comparison with dietary items and habitat constituents in seagrass meadows, J. Fish. Biol., 61, 801–821, 2002.
20
Sanchiz, C., Garcia-Carrascosa, A. M., and Pastor, A.: Heavy metal contents in soft-bottom marine macrophytes and sediments along the Mediterranean coast of Spain, Mar. Ecol.-P. S. Z. N. I, 21, 1–16, 2000.
Sanz-Lazaro, C. and Marin, A.: A manipulative field experiment to evaluate an integrative methodology for assessing sediment pollution in estuarine ecosystems, Sci. Total Environ.,
25
407, 3510–3517, 2009.
Sanz-Lazaro, C., Navarrete-Mier, F., and Marin, A.: Biofilm responses to marine fish farm wastes, Environ. Pollut., 159, 825–832, 2011.
Schlacher-Hoenlinger, M. A. and Schlacher, T. A.: Accumulation, contamination, and seasonal variability of trace metals in the coastal zone – patterns in a seagrass meadow from the
30
Mediterranean, Mar. Biol., 131, 401–410, 1998.
BGD
9, 2623–2653, 2012Posidonia oceanica
trace element cycling C. Sanz-L ´azaro et al.
Title Page
Abstract Introduction
Conclusions References
Tables Figures
◭ ◮
◭ ◮
Back Close
Full Screen / Esc
Printer-friendly Version
Interactive Discussion
Discussion
P
a
per
|
Dis
cussion
P
a
per
|
Discussion
P
a
per
|
Discussio
n
P
a
per
|
Stapel, J., Aarts, T. L., van Duynhoven, B. H. M., de Groot, J. D., van den Hoogen, P. H. W., and Hemminga, M. A.: Nutrient uptake by leaves and roots of the seagrass Thalassia hemprichii in the Spermonde Archipelago, Indonesia, Mar. Ecol.-Prog. Ser., 134, 195–206, 1996.
Tomas, F., Turon, X., and Romero, J.: Effects of herbivores on aPosidonia oceanicaseagrass
meadow: importance of epiphytes, Mar. Ecol.-Prog. Ser., 287, 115–125, 2005.
5
Tovar-Sanchez, A., Seron, J., Marba, N., Arrieta, J. M., and Duarte, C. M.: Long-term records
of trace metal content of Western Mediterranean seagrass (Posidonia oceanica)
mead-ows: natural and anthropogenic contributions, J. Geophys. Res.-Biogeo., 115, G02006, doi:10.1029/2009JG001076, 2010.
Tranchina, L., Brai, M., D’Agostino, F., Bartolotta, A., and Rizzo, G.: Trace metals in “Posidonia
10
oceanica” seagrass from South-Eastern Sicily, Chem. Ecol., 21, 109–118, 2005.
Turner, R. K., Subak, S., and Adger, W. N.: Pressures, trends, and impacts in coastal zones: interactions between socioeconomic and natural systems, Environ. Manage., 20, 159–173, 1996.
Underwood, A. J.: Experiments in Ecology: Their Logical Design and Interpretation Using
15
Analysis of Variance, Cambridge University Press, Cambridge, 1997.
Whelan, T., Espinoza, J., Villarreal, X., and CottaGoma, M.: Trace metal partitioning in Thalas-sia testudinum and sediments in the Lower Laguna Madre, Texas, Environ. Int., 31, 15–24, 2005.
Wittmann, K. J.: Temporal and morphological variations of growth in a natural stand of
20
BGD
9, 2623–2653, 2012Posidonia oceanica
trace element cycling C. Sanz-L ´azaro et al.
Title Page
Abstract Introduction
Conclusions References
Tables Figures
◭ ◮
◭ ◮
Back Close
Full Screen / Esc
Printer-friendly Version
Interactive Discussion
Discussion
P
a
per
|
Dis
cussion
P
a
per
|
Discussion
P
a
per
|
Discussio
n
P
a
per
|
Table 1. Analysis of the reference materials of the Community Bureau of Reference Ulva lactucaCRM 279 andLagarosiphon major CRM 060: certified values, measured values and
recovery (mean±SD). Certified values are given when they are available from the Community
Bureau of Reference.
Lagarosiphon major (CRM-60) Ulva lactuca(CRM-279)
Element Measured Certified Recovery Measured Certified Recovery
(µg g−1dry wt) (µg g−1dry wt) (%) (µg g−1dry wt) (µg g−1dry wt) (%)
Ag 0.24±0.01 0.036±0.003
As 5.1±0.2 3.95±0.2
Ba 97±4.3 10±0.6
Bi 0.42±0.03 0.07±0.001
Cd 2.11±0.04 2.2±0.1 96 0.27±0.004 0.27±0.02 98
Co 3.5±0.1 1.96±0.1
Cr 20±5.3 9±1.6
Cs 0.22±0.009 0.38±0.02
Cu 40±1.3 51.2±1.9 77 10±0.2 13.1±0.4 76
Fe 1668±66 1802±65
Ga 0.45±0.06 0.45±0.02
Li 0.96±0.1 2.2±0.2 3.09±0.2 128
Mn 1424±25 1760±60 81 1660±1.2
Ni 35±4.4 12±0.1
Pb 64±4.2 64±4 101 11±1.3 13.5±0.4 81
Rb 12±0.2 8±0.03
Sr 460±6 476±12
Tl 0.18±0.01 0.026±0.003
V 3.8±0.3 4.8±0.4
BGD
9, 2623–2653, 2012Posidonia oceanica
trace element cycling C. Sanz-L ´azaro et al.
Title Page
Abstract Introduction
Conclusions References
Tables Figures
◭ ◮
◭ ◮
Back Close
Full Screen / Esc
Printer-friendly Version
Interactive Discussion
Discussion
P
a
per
|
Dis
cussion
P
a
per
|
Discussion
P
a
per
|
Discussio
n
P
a
per
|
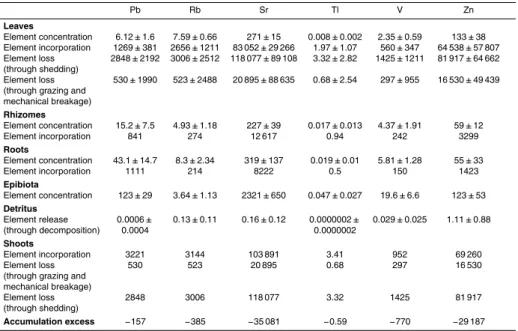
Table 2.Annual trace element concentration (µg dry wt g−1
dry wt), incorporation and loss rates
(µg dry wt m−2yr−1) and release rate through decomposition (kvalue; yr−1) in the compartments
ofPosidonia oceanica(leaves, rhizomes, roots and epibiota) and its detritus during the studied
time (mean±SD). The annual trace element budget (µg m−2
yr−1
) is represented as the
accu-mulation excess. For the trace elements thatP. oceanicaacts as a sink or source, the value of
the accumulation excess budget is either positive or negative, respectively.
Ag As Ba Bi Cd Co Cr
Leaves
Element concentration 0.18±0.07 1.08±0.3 0.93±0.26 0.006±0.001 1.19±0.19 1.24±0.3 5.46±2.47 Element incorporation 59.5±18.9 292±107 269±136 0.99±0.24 287±43.7 247±136 2396±2565 Element loss 52.3±12.9 491±385 415±330 3.04±2.84 498±329 601±401 2013±793 (through shedding)
Element loss 1.9±54.2 105±415 106±303 0.56±1.86 62.86±343 120±395 254±1682 (through grazing and
mechanical breakage) Rhizomes
Element concentration 1±0.34 3.16±1.31 2.19±1.08 0.011±0.007 0.53±0.07 0.47±0.2 5.93±2.04
Element incorporation 55.7 175 122 0.6 29.5 26.3 329
Roots
Element concentration 0.43±0.12 8.56±3.34 2.65±0.92 0.029±0.013 0.74±0.12 1.02±0.22 5.52±2.66
Element incorporation 11.1 221 68 0.74 19.2 26.4 143
Epibiota
Element concentration 0.21±0.15 14.2±5 13.5±4 0.09±0.021 0.48±0.18 1.9±0.73 15.7±3.4 Detritus
Element release 0.00019± 0.0005± 0.00002± 0.0000004± 0.17±0.11 0.0008± 0.0008±
(through decomposition) 0.00005 0.0004 0.00002 0.0000004 0.0005 0.0003
Shoots
Element incorporation 126.3 688 459 2.33 335.7 299.7 2868
Element loss 1.9 105 106 0.56 62.86 120 254
(through grazing and mechanical breakage)
Element loss 52.3 491 415 3.04 498 601 2013
(through shedding)
BGD
9, 2623–2653, 2012Posidonia oceanica
trace element cycling C. Sanz-L ´azaro et al.
Title Page
Abstract Introduction
Conclusions References
Tables Figures
◭ ◮
◭ ◮
Back Close
Full Screen / Esc
Printer-friendly Version
Interactive Discussion
Discussion
P
a
per
|
Dis
cussion
P
a
per
|
Discussion
P
a
per
|
Discussio
n
P
a
per
|
Table 2.Continued.
Cs Cu Fe Ga Li Mn Ni
Leaves
Element concentration 0.009±0.004 10.9±2 105±35 0.03±0.02 0.92±0.12 27.5±8.7 24.5±14 Element incorporation 1.75±1.68 3377±488 29 911±14 794 7.61±6.29 297±139 6759±3440 10 269±6224 Element loss 1.79±1.73 4016±3851 38 975±29 080 15.71±10.48 378±299 15 487±14 608 7008±4191 (through shedding)
Element loss 0.85±2.93 815±3376 4104±31 777 3.77±10.49 77±302 4204±10 799 1331±6880 (through grazing and
mechanical breakage)
Rhizomes
Element concentration 0.023±0.015 5.1±1 411±209 0.09±0.05 0.58±0.21 9.1±5 23±6.4 Element incorporation 1.54 282 22 808 4.78 32.1 504 1276
Roots
Element concentration 0.032±0.01 10.5±1.6 1092±444 0.1±0.03 0.54±0.13 26.4±11.6 11.2±9.2 Element incorporation 0.83 270 28 175 2.59 14 682 289
Epibiota
Element concentration 0.2±0.05 17.3±7.6 2000±484 0.41±0.1 2.57±0.36 181±97 15.8±4.5
Detritus
Element release 0.0000002± 0.0025± 0.0128± 0.000003± 0.0023± 0.0015± 0.016±0.010 (through decomposition) 0.0000002 0.0024 0.0095 0.000002 0.0018 0.0014
Shoots
Element incorporation 4.12 3929 80 894 14.98 343.1 7945 11 834 Element loss 0.85 815 4104 3.77 77 4204 1331 (through grazing and
mechanical breakage)
Element loss 1.79 4016 38 975 15.71 378 15 487 7008 (through shedding)
BGD
9, 2623–2653, 2012Posidonia oceanica
trace element cycling C. Sanz-L ´azaro et al.
Title Page
Abstract Introduction
Conclusions References
Tables Figures
◭ ◮
◭ ◮
Back Close
Full Screen / Esc
Printer-friendly Version
Interactive Discussion
Discussion
P
a
per
|
Dis
cussion
P
a
per
|
Discussion
P
a
per
|
Discussio
n
P
a
per
|
Table 2.Continued.
Pb Rb Sr Tl V Zn
Leaves
Element concentration 6.12±1.6 7.59±0.66 271±15 0.008±0.002 2.35±0.59 133±38 Element incorporation 1269±381 2656±1211 83 052±29 266 1.97±1.07 560±347 64 538±57 807 Element loss 2848±2192 3006±2512 118 077±89 108 3.32±2.82 1425±1211 81 917±64 662 (through shedding)
Element loss 530±1990 523±2488 20 895±88 635 0.68±2.54 297±955 16 530±49 439 (through grazing and
mechanical breakage)
Rhizomes
Element concentration 15.2±7.5 4.93±1.18 227±39 0.017±0.013 4.37±1.91 59±12 Element incorporation 841 274 12 617 0.94 242 3299
Roots
Element concentration 43.1±14.7 8.3±2.34 319±137 0.019±0.01 5.81±1.28 55±33 Element incorporation 1111 214 8222 0.5 150 1423
Epibiota
Element concentration 123±29 3.64±1.13 2321±650 0.047±0.027 19.6±6.6 123±53
Detritus
Element release 0.0006± 0.13±0.11 0.16±0.12 0.0000002± 0.029±0.025 1.11±0.88 (through decomposition) 0.0004 0.0000002
Shoots
Element incorporation 3221 3144 103 891 3.41 952 69 260 Element loss 530 523 20 895 0.68 297 16 530 (through grazing and
mechanical breakage)
Element loss 2848 3006 118 077 3.32 1425 81 917 (through shedding)
BGD
9, 2623–2653, 2012Posidonia oceanica
trace element cycling C. Sanz-L ´azaro et al.
Title Page
Abstract Introduction
Conclusions References
Tables Figures
◭ ◮
◭ ◮
Back Close
Full Screen / Esc
Printer-friendly Version
Interactive Discussion
Discussion
P
a
per
|
Dis
cussion
P
a
per
|
Discussion
P
a
per
|
Discussio
n
P
a
per
|
Table 3. Two-way factorial ANOVA on differences in trace element concentration of Posido-nia oceanica among the factors, compartment of the plant (df=3) and time (df=5) and the
interaction between them (df=15). Le: leaves; Rh: rhizomes; Ro: roots; Ep: epibiota.
Compartment of the plant Time Interaction SNK test
MS F MS F MS F
Ag 2.6 35.8*** 0.07 2.6** Rh>Ro>Ep=Le
As# 12.8 56.1*** 0.2 7.2*** Ep>Ro>Rh>Le
Ba# 12.2 113*** 0.109 2.1* Ep>Ro>Rh>Le
Bi 0.02 89.8*** 0.0003 2.2* Ep>Ro>Rh=Le
Cd 1.8 56.6*** 0.01 0.4 0.03 1.7 Le>Ro>Rh=Ep
Co 6.2 12.0*** 0.5 12.6*** Ep>Le>Ro>Rh
Cr 412 43.7*** 5.6 0.6 9.4 1.5 Ep>Rh=Ro=Le
Cs 0.1 110*** 0.001 2.1* Ep>Ro=Rh>Rh=Le
Cu 430 18.1*** 24 2.8** Ep>Le=Ro>Rh
Fe# 28.4 106*** 0.3 3.9*** Ep>Ro>Rh>Le
Ga 0.5 188*** 0.004 1.4 0.003 0.7 Ep>Ro=Rh>Le
Li# 2.5 162*** 0.02 2.9** Ep>Le>Rh=Ro
Mn# 24.5 33.4*** 0.7 16.5*** Ep>Le=Ro>Rh
Ni 686 6.3** 110 1.0 109 1.4 Le=Rh>Ep=Ro
Pb# 26.0 72.1*** 0.4 7.8*** Ep>Ro>Rh>Le
Rb 82.8 35.8*** 3.0 1.3 2.3 1.1 Ro=Le>Rh>Ep
Sr 17 166 117 65.8*** 262 279 7.4*** Ep>Ro=Le=Rh
Tl 0.005 21.5*** 0.0004 1.6 0.0002 1.1 Ep>Ro=Rh=Le
V# 9.7 80.7*** 0.1 2.4* Ep>Ro>Rh>Le
Zn 30 925 19.3*** 3017 1.9 1608 1.5 Le=Ep>Rh=Ro
#
=ln(x+1) transformation *=p <0.05;
BGD
9, 2623–2653, 2012Posidonia oceanica
trace element cycling C. Sanz-L ´azaro et al.
Title Page
Abstract Introduction
Conclusions References
Tables Figures
◭ ◮
◭ ◮
Back Close
Full Screen / Esc
Printer-friendly Version
Interactive Discussion
Discussion
P
a
per
|
Dis
cussion
P
a
per
|
Discussion
P
a
per
|
Discussio
n
P
a
per
|
Table 4. Annual amount of trace element accumulation excess (g dry wt yr−1
) byPosidonia oceanicafor the Mediterranean basin according to the estimates of the total cover ofP. oceanica
(50 000 km2) (Pasqualini et al., 1998). Positive or negative values indicate either incorporation
or release byP. oceanica, respectively.
Trace element Annual accumulation excess
Fe 1 890 708
Ni 174 804
Cr 30 000
As 4591
Ag 3605
Cs 73.92
Tl −29.59
Bi −63.93
Ga −225.0
Ba −3074
Li −5636
Pb −7895
Cd −11 239
Rb −19 262
Co −21 067
V −38 489
Cu −45 097
Mn −587 261
Zn −1 459 340