www.biogeosciences.net/13/2179/2016/ doi:10.5194/bg-13-2179-2016
© Author(s) 2016. CC Attribution 3.0 License.
Effects of in situ CO
2
enrichment on structural characteristics,
photosynthesis, and growth of the Mediterranean
seagrass
Posidonia oceanica
T. Erin Cox1, Frédéric Gazeau1, Samir Alliouane1, Iris E. Hendriks2, Paul Mahacek1, Arnaud Le Fur1, and Jean-Pierre Gattuso1,3
1Sorbonne Universités, UPMC Univ. Paris 06, CNRS-INSU, Laboratoire d’Océanographie de Villefranche, 181 chemin du Lazaret, 06230 Villefranche-sur-mer, France
2Global Change Department, IMEDEA (CSIC-UIB), Instituto Mediterraneo de Estudios Avanzados, C/Miquel Marques 21, 07190 Esporles, Mallorca, Spain
3Institute for Sustainable Development and International Relations, Sciences Po, 27 rue Saint Guillaume, 75007 Paris, France
Correspondence to:T. Erin Cox ([email protected])
Received: 15 December 2015 – Published in Biogeosciences Discuss.: 18 January 2016 Revised: 22 March 2016 – Accepted: 2 April 2016 – Published: 13 April 2016
Abstract.Seagrass is expected to benefit from increased car-bon availability under future ocean acidification. This hy-pothesis has been little tested by in situ manipulation. To test for ocean acidification effects on seagrass meadows under controlled CO2/pH conditions, we used a Free Ocean Car-bon Dioxide Enrichment (FOCE) system which allows for the manipulation of pH as continuous offset from ambient. It was deployed in a Posidonia oceanica meadow at 11 m depth in the Northwestern Mediterranean Sea. It consisted of two benthic enclosures, an experimental and a control unit both 1.7 m3, and an additional reference plot in the ambient environment (2 m2) to account for structural artifacts. The meadow was monitored from April to November 2014. The pH of the experimental enclosure was lowered by 0.26 pH units for the second half of the 8-month study. The great-est magnitude of change inP. oceanicaleaf biometrics, pho-tosynthesis, and leaf growth accompanied seasonal changes recorded in the environment and values were similar between the two enclosures. Leaf thickness may change in response to lower pH but this requires further testing. Results are congru-ent with other short-term and natural studies that have inves-tigated the response ofP. oceanicaover a wide range of pH. They suggest any benefit from ocean acidification, over the next century (at a pH of ∼7.7 on the total scale), on
Posi-doniaphysiology and growth may be minimal and difficult
to detect without increased replication or longer
experimen-tal duration. The limited stimulation, which did not surpass any enclosure or seasonal effect, casts doubts on speculations that elevated CO2 would confer resistance to thermal stress and increase the buffering capacity of meadows.
1 Introduction
Ocean carbonate chemistry is being altered in ways that may affect future ocean ecology. The ocean absorbs carbon diox-ide (CO2)from the atmosphere which increases the concen-trations of inorganic carbon and CO2, and decreases pH in a process referred to as ocean acidification. Surface ocean pH has decreased by 0.1 units since the beginning of the indus-trial era and a further decline (0.06 to 0.32 units) is projected over the next century (Ciais et al., 2013). Through this pro-cess, the relative proportions of dissolved inorganic carbon species are concurrently being altered. By 2100, bicarbon-ate (HCO−
3), already widely available, will increase along with CO2, which will have the largest proportional increase from present-day levels. An increase in carbon availability may benefit some marine producers (Koch et al., 2013). In contrast, the concentration of carbonate ions (CO2−
Seagrass meadows rank as one of the most productive ecosystems on Earth (Duarte et al., 2010; Duarte and Chis-cano, 1999). They are highly valued for their ability to im-prove water quality, stabilize sediment, and provide habi-tat for a diversity of organisms. Human-driven changes to the seawater clarity and quality (e.g. eutrophication, ocean warming) are often related to meadow decline (Jordà et al., 2012; Waycott et al., 2009). However, these habitat-forming seagrasses are thought to benefit from ocean acidification be-cause they are able to use both CO2and HCO−3 for photosyn-thesis but, with a higher affinity for CO2and are often found to be carbon-limited (Invers et al., 2001; Koch et al., 2013).
Experiments under elevated CO2have shown an increase in seagrass photosynthesis (Apostolaki et al., 2010; Invers et al., 1997; Jiang et al., 2010; Ow et al., 2015; Zimmer-man et al., 1997), below-ground growth (Hall-Spencer et al., 2008; Zimmerman et al., 1997; Russell et al., 2013) and flowering frequency (Palacios and Zimmerman, 2007). Yet the majority of these studies were conducted in the lab-oratory over relatively short durations with single taxa or small groups of taxa isolated from their surroundings. Al-though studies along carbon dioxide vents allow for a whole ecosystem approach, the high spatial and temporal variabil-ity in CO2 levels hampers the determination of a reliable dose-response relationship (Hall-Spencer et al., 2008; Ker-rison et al., 2011). To the best of our knowledge, only Camp-bell and Fourqurean (2011, 2013a, 2014) have manipulated partial pressure of carbon dioxide (pCO2)levels in a
con-tained (ie. as opposed to free flow CO2 bubbling) manner in situ within a Thalassia meadow to test the response of seagrass to ocean acidification. After 6 months of exposure to lowered pH (−0.3 from mean ambient), the seagrass had increased non-structural carbohydrate content by 29 % in below-ground structures (Campbell and Fourqurean 2014). This finding generally supports the hypothesis that plant pro-duction will be stimulated from the increased carbon avail-ability.
Posidonia oceanica is the foundation species for
mono-specific meadows in the Mediterranean Sea where it cov-ers up to 23 % of shallow watcov-ers (0–50 m; Pasqualini et al., 1998) and provide services valued at 172 C m−2yr−1 (Vas-sallo et al., 2013). These plants are largely dependent upon abiotic factors as evident by its seasonal growth and physiol-ogy (Alcoverro et al., 1995, 1998; Bay, 1984; Duarte, 1989). They have been studied under a range of pH in the labora-tory as well as along pH gradients near CO2vents (Invers et al., 1997, 2001, 2002; Hall-Spencer et al., 2008; Cox et al., 2015). Around natural CO2vents in Ischia (Italy),P. ocean-icabiomass was greatest at the station nearest the CO2source with a mean pH of 7.6 and minimum of 6.98 (on the total scale, pHT, Hall-Spencer et al., 2008). Indeed, P. oceanica has a C3 photosynthetic pathway that is hypothesized to ben-efit from increased carbon availability and its photosynthesis is not saturated with respect to dissolved inorganic carbon at natural concentrations in seawater (Invers et al., 1997, 2001).
This is evident by their enhanced productivity in the labora-tory under a pH range from 9.0 to 7.9 and has been attributed to a less efficient use of widely available HCO−
3 and their reliance on CO2for about 50 % of carbon for photosynthe-sis (Invers et al., 1997, 2001). External carbonic anhydrase acts to dehydrate HCO−
3 to CO2which enters the cell by a diffusive process (Invers et al., 2001). Thus CO2limitation depends upon the thickness of the boundary layer and can also occur at high pH with slow diffusion rates (Invers et al., 2001). However, the extent of the stimulation atpCO2levels projected for the coming decades appears limited (Cox et al., 2015; Invers et al., 2002). In addition, the environment and species dynamics in meadows are complex and interactions can alter outcomes. For example, the leaves and roots are colonized by small invertebrates and epiphytic algae (Borow-itzka et al., 2006). These associated species, many sensitive to dissolution, compete with the plants for resources (Cebrián et al., 1999; Martin et al., 2008; Sand-Jensen et al., 1985). A laboratory investigation of this potential interaction under two elevatedpCO2levels (pHT7.7 and 7.3) was performed
(Cox et al., 2015). Despite a loss of calcified photosynthetic epiphytes at pHT 7.7, the effect on shoot productivity was limited and seagrass photosynthesis (without epiphytes) was only stimulated at pHTof 7.3, a value unlikely to occur in the Mediterranean Sea in the next century (Cox et al., 2015). The long-lived plants, however, were maintained for a relatively short duration of 6 weeks and only under the irradiance, tem-perature, and nutrient conditions of February to March. From these studies it is difficult to predict the impact of ocean acid-ification onP. oceanica.
Any alteration inP. oceanica productivity or abundance will likely have repercussions to meadow function. Therefore the aim of the present study was to test the hypothesis that Mediterranean seagrass,P. oceanica,will benefit from ocean acidification. We tested this hypothesis in situ with a Free Ocean Carbon Dioxide Enrichment (FOCE) system (see Gat-tuso et al., 2014) which consisted of two partially open enclo-sures that were deployed in the Bay of Villefranche (France) for 8 months (April–November 2014). The pH was manipu-lated continuously, in one enclosure, at a−0.26 pH unit off-set from ambient between June and November. Before and during pH manipulation, macrophyte abundance,Posidonia leaf biometrics, photosynthesis, and growth were measured and environmental conditions were monitored.
2 Method
2.1 Experimental setup and system function
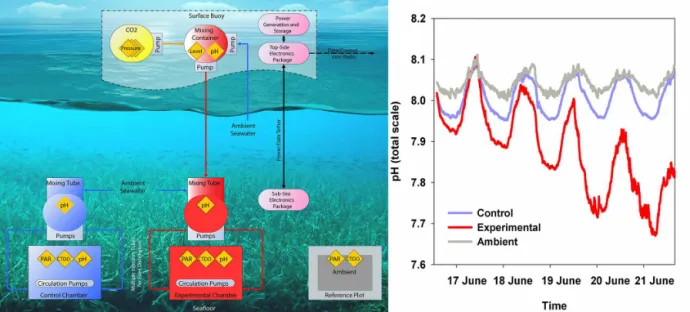
Labora-toire d’Océanographie de Villefranche (NW Mediterranean Sea, France; 43◦40.73′N, 07◦19.39′E; Fig. 1). The eFOCE engineering design consisted of a surface buoy and two un-derwater benthic enclosures (Fig. 1).
The underwater portion of eFOCE consisted of two clear, 1.7 m3 (2 m long×1 m width×0.85 m tall) perspex enclo-sures that were open on the bottom to partially enclose a por-tion of a P. oceanica meadow. They were located at 11 m depth, were placed end to end approximately 1.5 m apart and faced south. The pH in one enclosure, referred to as the ex-perimental enclosure, was lowered by∼0.25 units as an off-set from ambient pH. The second enclosure served as a con-trol. A third treatment consisted of an open fiberglass frame of the same dimensions as the enclosure footprint (2 m2). It
was placed nearby (3 m north of the experimental enclosure) and in the same meadow. It is referred to as a reference plot and accounts for any artifacts from the structure of the enclo-sures.
The surface component of eFOCE consisted of a buoy that housed solar panels, a wind turbine and 12 V batteries that provided energy to the system. It also housed three CO2tanks and a peristaltic pumping system which drew surface seawa-ter into a 20 L container inside the buoy where pure CO2was added and mixed until a desired pH was reached (usually be-tween 5.5 and 5.7 pHT). A Seabird potentiometric 18-S pH
sensor was used to monitor pHTin this surface container. The two underwater enclosures (experimental and control) were mostly enclosed to maintain the desired pH offset, with the exception of two openings (12 cm) on the upper, side panels. The top of the enclosure could be removed to al-low scuba divers to enter when needed. Each enclosure had 10 openings (8 cm diameter) along the bottom sides that al-lowed tubes to pass through. These “injection” tubes passed through each enclosure into the ambient environment where they were connected to a set of three underwater brushless centrifugal pumps and a mixing tube (one for each enclo-sure). For the experimental enclosure, a hose ran from the surface to depth and connected the surface low pH container to the underwater mixing tube. A second peristaltic pump on the buoy controlled the flow rate (up to 0.12 L min−1)of the low-pH water through this hose while the underwater cen-trifugal pumps (6.7 L min−1each) continuously brought am-bient seawater into the mixing tube. Each mixing tube also housed a potentiometric Seabird 18-S pH sensor that moni-tored pH. By sensing the pH of seawater before it enters the enclosure, the system, via a feedback loop, could adjust the CO2-saturated seawater pumping rate to maintain seawater entering the experimental enclosure at the desired pH offset from ambient. Once seawater reached the subsurface mixing tubes, it then entered the enclosures via the injection tubes described above, where it was circulated by another set of centrifugal pumps (4 per chamber; 6.7 L min−1each). Water could then exit enclosures through the two openings (12 cm diameter) on the upper side panels. The complete renewal time of seawater in each enclosure was ca. 1.5 h.
2.2 Field sensors and system maintenance
The environment was characterized using sensors placed in-side the enclosures and placed within 5 m from the reference plot. Sensors were connected by cables to the surface elec-tronic hub. The surface elecelec-tronic hub communicated 2 min averaged data by radio to the laboratory. Underwater sensors (with their sampling frequency) included four potentiomet-ric Seabird 18-S pH sensors (eight measures in 1 s) located inside each enclosure and in each mixing tube, three Seabird 37 SMP-ODO CTD with SBE 63 oxygen (O2)optodes one
in each enclosure and one nearby in the ambient (one ple, each, for salinity and temperature every 2 min, two sam-ples for O2 every 2 min), and three LI-COR-192 PAR sen-sors (2000 irradiance measurements every 5 s) also located in each enclosure and in the nearby ambient environment.
The system required routine maintenance. Scuba divers lightly brushed the enclosure surfaces and sensor probes at least once per week to remove sediment and fouling. On four occasions throughout the experiment duration, CTDs were flushed by a syringe filled with clean seawater to remove any debris inside the sampling ports. Tubes and pumps on the buoy and subsea were also cleaned once a week of debris and replaced when heavily fouled.
The underwater 18-S pH sensors were calibrated one to three times per month by placing them together in the am-bient environment for 45 min, followed by collection of three, 100 mL syringes of seawater drawn directly next to the probes. Seawater was immediately returned to the lab-oratory and pH determined spectrophotometrically as de-scribed in Dickson et al. (2007). Absorbances at peak wave-lengths for purified meta-Cresol Purple (Liu et al., 2011) were measured using an Ocean Optics© spectrophotometer model USB2000+VIS+NIR. The pH of seawater samples was determined in triplicate (SD < 0.008) at 22◦C and re-computed at in situ temperature using the R package seacarb (function pHinsi, Gattuso et al., 2015, seacarb: seawater car-bonate chemistry with R. R package version 3.0.2). The off-set between the probe-sensed value at the time of water col-lection and laboratory determined measures was used for cor-rection. In addition, pH sensors were refreshed every 4 to 6 weeks in a NBS buffer at pH 4 for 45 min.
2.3 Timeline
Figure 1.Schematic of the system and study design (left), see text for details; (right) the pH (total scale) inside the enclosures and in ambient
during the week-long transition to the targeted offset (−0.25 units).
the pre-acidification period began on 5 April; however, data from all sensors were available from 15 May.
2.4 Environment characterization
All sensed data were initially screened for quality. Any ob-vious outliers or missing data that resulted from system or sensor malfunction were eliminated from the data set. The mean (±SD) pHTand median (±median absolute deviation, MAD) diel pH changes for the two enclosures and the ambi-ent environmambi-ent were calculated by time period and month.
Seawater samples for the determination of total alkalin-ity (AT) levels in each enclosure were taken one to five
times per month from May to October (n=11 to 12). Sam-ples (300 mL) were filtered on GF/F membranes (47 mm) and immediately poisoned with 100 µL of mercuric chlo-ride (HgCl2).AT was determined on triplicate 50 mL sub-samples by potentiometric titration on a Metrohm Titrando 888 titrator coupled to a glass electrode (Metrohm, ecotrode plus) and a thermometer (pt1000). The pH electrode was calibrated on the total scale using TRIS buffers of salin-ity 38, corresponding to salinsalin-ity in the Bay of Villefranche. Measurements were carried out at 22◦C and A
T was cal-culated as described by Dickson et al. (2007). During the experiment, standards provided by A. Dickson (batch 132) were used to check precision (standard deviation) and accu-racy (deviation from the certified value provided by Dick-son); which was 0.889 and 1.04 µmol kg−1 (n=6), re-spectively. As AT variations during the experiment were very small, average AT (mean±SD, experimental enclo-sure, n=12, AT=2545.5±8.0 µmol kg−1; control enclo-sure, n=11, AT=2541.7±12.2 µmol kg−1) was used to
calculate all carbonate chemistry parameters at a high
fre-quency, together with sensed temperature, salinity and pHT, using seacarb. To calculate carbonate chemistry of the ambi-ent environmambi-ent at high frequency, we used anATvalue of 2556 µmol kg−1and the sensed ambient values of tempera-ture, salinity, pHT, using seacarb. ThisATvalue is the mean for 2014 determined from weekly measures of seawater col-lected at 1 m depth station, Point B, within the Bay (Point B data provided by Service d’Observation Rade de Villefranche and the Service d’Observation en Milieu Littoral). All these parameters, as well as the O2 concentration (mean±SD), median (±median absolute deviation, MAD) diel O2change and photosynthetically active radiation (PAR, mean±SD, mol photons m−2d−1) were summarized by month and by time period for the two enclosures and the reference plot (am-bient).
2.5 Shoot density and macrophyte abundance
After the enclosures had been deployed on the meadow for 4 weeks and before the acidification period, scuba divers counted the number of shoots within each treatment. Shoot density was determined twice by different divers and val-ues were averaged, except for the experimental treatment where an observer error was made and one count was elim-inated. Permanent quadrats were then used to determine any change in shoot density through time. On 11 April, three 0.25×0.25 m2permanent quadrats were haphazardly placed inside each enclosure and in the reference plot. The number of shoots per quadrat was then determined every 2 to 4 weeks throughout the experiment.
treat-ment. The quadrats were also divided into four smaller squares 0.25×0.25 m2to assist with estimation. Prior to esti-mation, researchers practiced estimates on the same quadrat location to inter-calibrate and limit observer bias. On some occasions, the cover and shoot density could not be estimated in all 9 to 15 quadrat locations in 1 day. In these instances, divers returned to the treatments within 15 days (most within 8 days) to complete sampling.
2.6 Leaf biometrics
The number of leaves per shoot, and leaf length, area, thick-ness and toughthick-ness were monitored several times per month from April to November, before and during the acidification period. On these occasions, scuba divers used a tape mea-sure to meamea-sure the leaf length and counted the number of leaves per shoot for five to fifteen shoots per enclosure and plot. In addition, approximately every four weeks from 1 Au-gust, divers collected eight mature, six intermediate and two to four young leaves from each enclosure and from the ref-erence plot. To limit destructive sampling yet get a baseline measurement, on 27 June (near the start of the acidification period) leaves of about the same age were collected nearby. All leaves were collected from different shoots and taken at their base above the meristem. They were brought back to the laboratory and their length, width, and thickness were measured with a tape measure and caliper. The width and thickness was measured at the middle of the length of each leaf. On three occasions (in July, September, and October), the toughness of each leaf was determined in the middle of the leaf length with a penetrometer (see Cherrett, 1968).
For all leaf biometric parameters, data collected over sev-eral days were pooled into one data set for a comparison by month and among treatments (experimental, control and reference plot). Lab and field determined leaf lengths were combined and averaged by month into a leaf length param-eter that is included graphically. The leaf area is included because it is a frequent meadow descriptor (Pergent-Martini et al., 2005). The leaf length, thickness and toughness were investigated for relatedness with a scatter plot.
2.7 Fluorescence, photosynthesis, and respiration
A diving pulse amplitude modulated fluorometer (diving-PAM, Walz, Germany) equipped with a red light emitting diode and an internal halogen lamp to provide actinic light was used to measure the fluorescence in illuminated and dark-adapted leaves in situ throughout the experiment. These fluorescence values were used to produce rapid light curves (RLCs, rETR, relative electron transport rate vs. actinic
light) and dark-adapted quantum yields (Fυ/Fm).
All fluorescence and photosynthesis measures were per-formed on a randomly selected secondary leaf from enclo-sures and reference plot. Dark-adapted yields and RLCs were measured in situ between 10:00 and 12:00 LT (local time)
over two to three consecutive days to produce a sample size of three to ten leaves per enclosure and reference for May (pre-acidification), July, September, and October (acidifica-tion period for experimental enclosure). For all fluorescence measures, the fiber optic cable was attached 8 cm above the leaf meristem and held at a standard distance of 3 mm and at a 90◦angle from the blade.
RLCs were produced following the procedures outlined in Cox and Smith (2015). The actinic irradiance levels ranged up to 895 µmol photons m−2s−1 and were applied on the leaf surface for 10 s followed by a 0.8 s saturating pulse. Actinic range was also adjusted by month to account for the changing abilities of plants and corrected each time for battery decline. We determined the absorption factor (AF), used in rETR calculations, following the methods
and assumptions described in Beer and Björk (2000). Mea-surements were conducted one to three times each sam-pled month and monthly averages were used in calcula-tions. Curves were fitted with the exponential model pro-posed by Platt et al. (1980). Parameters derived from the curves include (1) α, the initial slope before the onset of
saturation (µmol electrons m−2s−1/µmol photons m−2s−1), (2) the relative maximum electron transport rate, rETRmax (µmol electrons m−2s−1)and (3)E
k, optimal irradiance for
maximal electron transport (µmol photons m−2s−1)which is determined by the equationEk=rETRmax/α.
For dark-adapted quantum yield, leaves were placed in the dark for 5 min using the dark-adapter and were exposed to a 0.8 s white saturating light pulse (saturation intensity setting of 8). Then the maximum PSII quantum yield was calculated using the equation in Genty et al. (1989) for dark adaption.
In addition, the photosynthesis vs. irradiance (PE) curves of experimental and control leaf segments were produced in the laboratory using O2 evolution within a series of incu-bations. These incubations were performed over two con-secutive days in September and November to produce four PE curves per enclosure each month. Leaf segments (5 cm) collected from∼10 cm length leaf were collected from the enclosures in the morning and incubated in the afternoon (13:00–19:00 LT). Immediately after collection, leaves were stored underwater in plastic bags, and transported to the lab-oratory in a dark mesh bag. Leaves were held for up to 3 h in dim light within a temperature-controlled laboratory (20◦C) in two open top cylindrical aquaria (1.5 L). Ambient water from the nearby bay was pumped into two header tanks that fed the aquaria and allowed excess water to overflow into a drainage basin. The pH in one header tank was maintained at a pHTof∼7.8, corresponding to pH levels in the experimen-tal enclosure by metered additions of pure CO2controlled by a pH-stat system (IKS, Aquastar Aquatic Products).
be-tween each incubation with fresh seawater from the respec-tive header tank (ambient, or lowered pH) with a stirrer be-low. Light was provided at a 90◦ angle to the leaf surface by a 250 W metal-halide lamp and adjusted to nine increas-ing irradiance levels (5 to 200 µmol photons m−2s−1 mea-sured directly at the leaf surface). This range of irradiance is within and above irradiance observed at the depth of col-lection. Plants were maintained at each irradiance or in dark-ness (to measure respiration,R) for 15–30 min while the
con-centration of O2was continuously monitored with a PreSens OXY-4 O2 meter with PSt3 fiber-optic mini-sensors. After the incubations, leaf segments were ground in a chilled room using a glass homogenizer with 90 % acetone that had been previously chilled for 12 h. The extract was left for 24 h in darkness, centrifuged at 3000 rpm for 15 min, and the ab-sorbance of the supernatant measured in quartz-glass cuvette with a UV/VIS spectrophotometer (Lambda 2, Perkin 366 Elmer). The concentrations of Chla andbwere determined
by measuring the absorbance at 647 and 664 nm and the concentrations calculated from the equations in Jeffrey and Humphrey (1975).
Rates of changes in O2 normalized to total chlorophyll (Chlaandb) were plotted against irradiance levels.
Parame-ters of the PE curves were estimated using a hyperbolic tan-gent model (Jassby and Platt, 1976), assuming thatRis
sim-ilar in the light and dark:
Pnet=Pg max×tanh(−E/Ek)+R,
with Pnet: rate of net photosynthesis (µmol O2 (mg Chl)−1min−1), Pg max, rate of maximal gross pho-tosynthesis (µmol O2 (mg Chl)−1min−1), E, irradiance
(µmol photons m−2s−1), E
k, irradiance at which α
in-tersects Pg max (µmol photons m−2s−1), R, respiration
rate.
The initial slope, α (µmol O2 (mg Chl)−1min−1/ µmol photons m−2s−1) was calculated as P
g max/Ek
andEc, the irradiance at which gross photosynthesis equals
respiration and above which plants exhibit a positive net photosynthesis, was determined fromR/α.
2.8 Growth and biomass
Leaf production and leaf plastochrone interval were deter-mined using the Zieman method modified by Short and Duarte (2001). Three to eight shoots in both enclosures and in the reference plot were marked with a plastic tag with a unique number in July, August, and September. A hypoder-mic needle was used to punch a hole in the meristem region. These tagged shoots were again located 33 to 46 days later. The distance from the puncture to the meristem was mea-sured and any new leaves that lacked a puncture were enu-merated. Using these methods, it was possible to calculate the number of days to produce a new leaf (plastochrone in-terval) and leaf production per day for each shoot. Leaf pro-duction incorporates the new length added to the shoot from
both the newly produced leaf (or leaves) and from the growth of older leaves.
Above-ground and below-ground biomass was determined for each enclosure and for the reference plot at the conclusion of the study. A fourth 2 m2area was also sampled for biomass in a nearby seagrass habitat located approximately 6 m from the enclosures. This area was added to further account for natural spatial variation. Three to five, 10 cm diameter cores of 12 cm height were hammered into haphazardly selected locations within the treatment area. They were brought back to the laboratory, stored in 5 % formalin, and later sorted into above-ground and below-ground plant parts, blotted dry, and weighed. A one-way ANOVA was used to test for differences in above- and below-ground biomass when data met paramet-ric requirements.
2.9 Pseudoreplication
Samples were collected or measured inside the plot or enclo-sure through time, often both before and after the pH manipu-lation. Thus the replication is equal to one for each treatment. True replication was sacrificed at the expense of controlling pH as an offset, at the spatial scale of the plants. Traditional inferential statistics could, therefore, not be rigorously ap-plied and we compare results graphically, paying careful at-tention to any divergence in values between the enclosures and the reference plot.
3 Results
3.1 Environment characterization
The pH in the experimental enclosure was maintained at a −0.26 unit offset from the control enclosure during the acidification period (Table 1). Values summarized by month showed that the difference between the two enclosures was maintained close to the targeted offset (range: −0.22 to −0.29 pH units). Before the pH was manipulated the offset between enclosures was smaller,−0.1 to 0.06 pH units.
The pHTin ambient ranged from a mean of 7.98 (±0.06 SD) in September to 8.11 (±0.04 SD) in June (Table 1). The ambient pHTwas similar to the pHTin the control enclosure, which ranged from 7.97 (±0.07 SD) in September to 8.12 (±0.06 SD) in June. The greatest difference between control and ambient, in monthly mean pHT values was 0.06 units. The differences inpCO2 reflected the magnitude of
differ-ence in pHT, asAT levels were rather constant during the study (see method section).
con-T able 1. A comparison of the carbonate chemistry and diel changes within the ambient and enclosures: the mean ( ± standard de viation, SD) pH (on the total scale), the maintained pH of fset between experimental and control enclosures as a dif ference (Dif f), the partia lpressure of carbon dioxide ( p CO 2 ) ,and the median (Med ± median absolut e de viation, MAD ) diel pH and oxygen (O2 ) change for each month and the period before and during the acidification. pH T p CO 2 (µatm) 1 Diel pH T 1 Diel O2 (µmol kg − 1) N Ambient Control Experimental Dif f Ambient Control Experimental N Ambient Control Experimental Ambient Control Experimental Months in Period Samples Mean SD Mean SD Mean SD Mean SD Mean SD Mean SD Mean SD Days Med MAD Med MAD Med MAD Med MAD Med MAD Med MAD Before May 11 840 8.10 0.03 8.12 0.06 8.01 0.05 − 0.10 0.03 374 30 358 55 477 74 17 0.08 0.02 0.10 0.06 0.12 0.05 52.0 11.0 68.0 7.0 82.0 14.0 June 8119 8.11 0.04 8.04 0.05 8.10 0.06 0.06 0.05 369 38 443 63 378 65 11 0.10 0.03 0.15 0.04 0.16 0.02 72.0 9.0 91.0 8.0 101.0 9.0 Acidification June 6226 8.05 0.03 8.02 0.04 7.79 0.13 − 0.23 0.13 430 42 470 57 868 318 9 0.12 0.03 0.12 0.04 0.27 0.08 72.0 7.0 85.0 10.0 92.0 11.0 July 21 007 8.03 0.03 8.03 0.06 7.79 0.12 − 0.24 0.11 454 46 453 81 870 254 30 0.09 0.02 0.17 0.05 0.27 0.06 60.5 14.0 95.5 18.0 100.5 18.0 August 22 682 8.00 0.03 8.04 0.07 7.81 0.12 − 0.23 0.09 489 42 445 85 834 253 31 0.09 0.02 0.18 0.05 0.29 0.06 55.0 8.0 77.0 12.0 86.0 12.0 September 21 854 7.98 0.07 7.97 0.06 7.70 0.11 − 0.27 0.10 521 96 536 87 1098 288 30 0.07 0.01 0.11 0.06 0.28 0.10 37.5 5.5 62.5 15.5 54.0 11.5 October 22 420 8.01 0.04 8.00 0.04 7.70 0.13 − 0.29 0.14 480 52 497 64 1086 390 31 0.06 0.02 0.09 0.04 0.29 0.08 27.0 3.0 34.0 5.0 44.0 5.0 No vember 5377 8.02 0.03 8.02 0.02 7.80 0.15 − 0.22 0.15 469 48 467 22 836 305 10 0.04 0.01 0.06 0.03 0.09 0.05 21.0 5.5 34.0 22.5 45.5 29.5 Before 24 334 8.10 0.04 8.05 0.07 8.06 0.07 0.01 0.09 380 39 434 85 426 87 34 0.09 0.02 0.14 0.06 0.16 0.07 63.5 13.0 80.5 13.5 88.0 13.0 Acidification 95 711 8.01 0.05 8.01 0.06 7.75 0.13 − 0.26 0.11 483 67 482 86 971 323 132 0.08 0.02 0.14 0.06 0.28 0.14 44.0 14.5 68.5 23.5 74.0 23.0
centration declined to a night-time minimum. In the morn-ing, the O2 began to increase to a daily afternoon maxi-mum; then it declined with decreasing irradiance. Over the months of the experiment, this diel O2 change ranged from 21 to 72 µmol kg−1in the ambient, 34 to 95 µmol kg−1in the control enclosure, and 34.5 to 100.5 µmol kg−1in the experi-mental enclosure (Table 1). The difference in diel change be-tween the ambient and the enclosures was most likely due to the amplification of a metabolic signal inside a partially en-closed space (similar to the example of a larger O2fluctuation when a similar sized plant is contained in a relatively smaller volume of water) as was evidenced by the more similar, and greater diel change in the two enclosures. The largest differ-ence in median values between enclosures was 14 µmol kg−1 in May, prior to the perturbation.
The diel pHTchange in the meadow corresponded to the daily change in O2 concentration. The natural diel pHT for this meadow was evident from the measures in the ambi-ent which median values show it fluctuated by 0.09 (±0.02 MAD) and 0.08 (±0.02 MAD) units per day in the pre- and acidification period, respectively. The diel change in pHTfor the control enclosure was slightly greater but consistent in the pre- and during acidification period (0.14±0.06 MAD and 0.14±0.06 MAD). In contrast, the diel pHTchange for the experimental enclosure increased from a median of 0.16 (±0.06 MAD) before pH manipulation to 0.28 (±0.14 MAD) during the acidification period.
Monthly differences were evident particularly for tem-perature, oxygen concentration, and PAR (Table S1) but were similar in the ambient, control and experimental enclo-sures. For example, the mean±SD during the acidification period for temperature in ambient, control and experimen-tal enclosures was 23.9◦C±0.01 (for each) and for PAR, 4.6±1.9, 4.6±2.0, 4.1±1.7 mol photons m−2d−1, respec-tively. Temperature increased approximately by 6◦C from May through August and declined by 4◦C until November. Oxygen concentrations and PAR fluctuated similarly with higher values in May to August (mean monthly range: 212 to 270 µmol kg−1, 4.7 to 7.7 mol photons m−2d−1)and de-creases in September to November (mean monthly range: 193 to 211 µmol kg−1, 1.4 to 4.4 mol photons m−2d−1).
3.2 Shoot density and macrophyte abundance
Initial shoot densities were similar in both enclosures and ref-erence plot and ranged from 150 to 175 shoots m−2(Fig. 2). There was no obvious change in shoot number (as deter-mined in permanent quadrates sampled through time) re-lated to the lowered pH in the experimental enclosure. For both enclosures and the reference plot, the number of shoots (initially 6 to 27 in permanent quadrats) tended to decline with time.
sam-Figure 2. Macrophyte abundance throughout the experiment;
(a)enclosures and reference plot had initially similarP. oceanica
shoot density m−2(mean±SE).(b)mean shoot number with time within three permanently located quadrats (0.06 m2)per reference
plot (top), control (middle) and experimental (bottom) enclosures.
(c, d, e)coverage (%) of benthic macrophytes and unoccupied sedi-ment or rocks (bare space) before and during the acidification period (xaxis after the dashed vertical line).
pling interval (Fig. 2).Posidonia oceanicawas the dominant species, with a surface cover of 18 to 35 %. Peyssonnelia, a red alga, covered between 1 and 11 % of the substratum. Their abundances were similar between months throughout the experiment. There was a slightly greater percentage of
P. oceanicain the experimental enclosure (experimental
en-closure, 31.6±0.6 %; control enclosure, 27.9±1.7 %; refer-ence plot, 28.9±1.3 %) throughout the experiment duration that did not appear to be related to the timing of the pH ma-nipulation.
3.3 Leaf biometrics
There was no large difference in shoot height among the enclosures and reference plot but there were large differ-ences in shoot height between the sampled months (Fig. 3). A similar monthly pattern in leaf length was observed be-tween the three treatments, for the minimum, average and maximum leaf length. From April through August, average
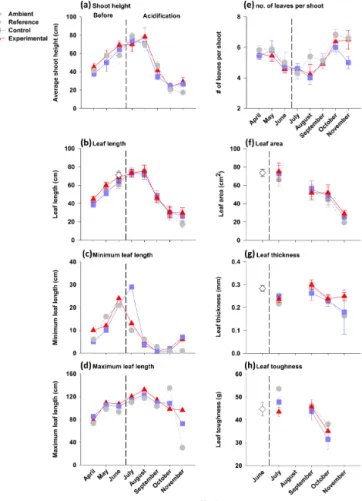
Figure 3.Leaf biometrics (mean±SE) before and during the
acid-ification period for the reference and enclosure plants. Measures through time: average shoot height(a), leaf length(b), minimum
(c)and maximum leaf length(d), number of leaves per shoot(e),
leaf area(f), leaf thickness(g)and leaf toughness(h)are shown.
The dashed vertical line indicates when the pH was lowered in the experimental enclosure. Additional leaves were collected in June from the meadow and are referred to as ambient leaves.
leaf length and average shoot height both increased and then declined between August and September. For example, the overall average shoot height increased from 40.6 cm in April to 73.4 cm in August then declined to 24.8 cm in November. Shoots had between 2 and 8 leaves (Fig. 3). The refer-ence and control plants differed slightly in leaf number per shoot (reference, 5.4±0.1 vs. control, 5.1±0.1), but control and experimental plants (5.2±0.2) were highly similar indi-cating an absence of pH effect. Furthermore, the number of leaves per shoot in the experimental enclosure did not consis-tently increase or decrease after the pH was manipulated. In-stead, leaf number per shoot in enclosures and plot increased during months when leaf height was lower (April, May and then October, November: 6 to 7) and tended to be lower in June and August (4 to 5) when leaf height was elevated.
corre-lated to leaf toughness. Both parameters varied among the enclosures and reference plot, and between months (Fig. 3). Leaves in the experimental enclosure were slightly thicker (2.5±0.1 mm) than leaves in the control enclosure and the reference plot (2.2±0.08 mm and 2.1±0.1 mm, respec-tively). Leaves in control enclosure and the reference plot for the month of November had a decreased and more vari-able thickness. Leaves inside the enclosures appeared to be weaker than the leaves in the reference plot. Furthermore, leaves appeared weaker in October compared to July and September. For example, the weakest leaf in July could with-stand 34 g of force as compared to the weakest leaf in Octo-ber which could only withstand 12 g of force. The ambient leaf samples collected in June also had a greater mean value of toughness than the October values from enclosures and the reference plot.
3.4 Fluorescence, photosynthesis, and respiration
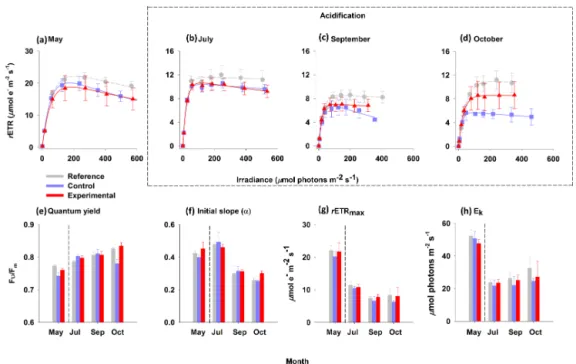
The dark-adapted quantum yield obviously differed by month but not according to pH (Fig. 4). The overall dark-adapted quantum yield ranged from 0.72 to 0.88 (n=69). The mean values were similar in the enclosures and the ref-erence plot. Mean yield was 0.8, 0.789, and 0.799 for leaves measured in the experimental, control, and reference treat-ments, respectively. Yield values increased over the duration of the experiment.
The AF factor for the calculation ofrETR changed with
month. The determined values (as a mean±SD) were as fol-lows: May: 74.5; July: 65.0; September: 69.6±1.5 (n=3); October, 54.2±0.0 (n=2).
The photosynthetic RLCs in Fig. 4a–d, show that the shape of the curve changed with month. Leaves from the con-trol and experimental enclosures have similar rETR values
that were slightly lower at elevated irradiance relative to the leaves in the reference plot.
The initial slope (α, µmol electrons m−2s−1/
µmol photons m−2s−1) ranged between 0.23 and 0.58 (n=57). It decreased substantially as a function of time (Ta-ble S6) from elevated values in May (0.43±0.01) and July (0.48±0.01) to lower values in September (0.31±0.01) and October (0.27±0.01). Overall (n=57), rETRmax values (in µmol electrons m−2s−1) ranged from 4.3 to 27.4 and
Ek (µmol photons m−2s−1)ranged from 12.0 to 63.6. The
leaves from the reference plot had rETRmax (12.3±0.6) andEk (33.7±2.0) that were more different than the leaves
from the control (rETRmax=10.8±0.7, Ek=29.8±2.0)
and experimental (rETRmax=12.0±0.7,Ek=30.9±0.7).
However, these parameters differed by a greater amount by month than among plants from the enclosures and the plot. rETRmax values were substantially higher in May (22.1±1.4) than in July (10.9±0.8), September (7.2±0.6), and October (7.5±0.8). Overall,Ek was obviously greater
in May (50.2±2.2) than in July (23.1±2.6), September (24.5±2.1), and October (28.1±2.5).
The parameters of the PE curves of leaves collected from the experimental and control enclosures also did not greatly differ (Fig. 5).α,Pg max, and R were greater for leaves
mea-sured in September than November.
The mean total concentration of chlorophyll in leaves did not greatly differ among enclosures. It was 0.36±0.04, 0.38±0.04 mg Chl cm−2in the experimental and control en-closures, respectively. It was greater in November than in September (0.46±0.03 vs. 0.28±0.04 mg Chl cm−2). The
Chla:b ratio of leaves from the control and experimental
enclosures did not obviously differ, with an overall Chla:b
ratio of 0.64.
3.5 Growth and biomass
Leaf production and plastochrone interval of shoots in the reference plot and in the enclosures appeared to differ (Fig. 6). Differences are most congruent with an effect caused by the structure of enclosures and not from the low-ered pH. The shoots in the reference plot were able to pro-duce more leaf material than in the experimental and con-trol enclosures. From July to September, reference shoots grew new leaf material at a mean rate of 0.89 (±0.06) cm d−1 compared to the reference plot and control enclosure, which both produced 0.66 (±0.05 to 0.06) cm d−1. Furthermore, reference shoots produced a new leaf in a fewer number of days than shoots in the experimental and control enclo-sures. From August to September, it took 11 days to pro-duce a new leaf in the reference plot while it took between 23 and 29 days for shoots that grew in the experimental and control enclosures, respectively. Overall, leaf production (the growth of all leaves per shoot) was also seasonal. It was greater per day from September to October (1 cm d−1)than during the periods July–August (0.5 cm d−1) and August– September (0.6 cm d−1).
At the end of the experiment, the above- and below-ground biomass was highly variable (Fig. 6). The above- and below-ground biomass ranged from 318 to 1484 and from 348 to 1584 g FW m−2, respectively. The control and experiment enclosures tended to have less above-ground biomass (630 and 530 g FW m−2)than the two external plots (reference: 850 and extra ambient plot: 870 g FW m−2).
4 Discussion
No overwhelming impact was observed on macrophyte abun-dance,P. oceanicaleaf biometrics, biomass, and photosyn-thesis after 4 months of elevatedpCO2. Leaf thickness may
change in response to lowered pH but requires further testing. Many of the leaf biometrics and physiology parameters var-ied seasonally with the varying temperature and irradiance.
Posidonia oceanicaabundance did not substantially change
ele-Figure 4.Photosynthetic rapid light curves (RLCs,a–d), dark-adapted quantum yield(e), and the derived RLC parameters(f–h)measured
on 2nd rank leaves in enclosures and reference plot before (May) and during (July, September, and October) the acidification period. Symbols represent the mean (±SE) relative electron transport rate (rETR) at each mean photosynthetic active radiation (PAR) value. Curved lines
represent the Jassby and Platt (1976) regression based on mean values. The dashed outline encloses the acidification period.
Figure 5.Photosynthesis vs. irradiance (PE) curves produced from laboratory incubations ofP. oceanicaleaf segments collected from
the enclosures after two (September, a) and four (November,b) months of acidification. The derived parameters from the curves are shown in(c)–(g).
vatedpCO2, no other benthic macrophyte or epiphyte prolif-erated or decreased to alter the macro-community structure. The similarity in leaf biometrics, photosynthesis, biomass and growth between enclosures support the conclusion of limited stimulation forP. oceanicaunder future ocean
acid-ification. However, due to tradeoffs related to experimental design, there were limitations to our conclusions.
Thickness and toughness are two structural factors related to mechanical strain (Harder et al., 2006; Littler and Littler, 1980; Padilla, 1985) and both traits were altered. Flexibility and strength are needed in environments with strong wave forces (de los Santos et al., 2013). InCymodocea nodosa, an-other Mediterranean seagrass, leaf cross-sectional area varies with hydrodynamical forces (de los Santos et al., 2013). Therefore, observed differences in leaf toughness for plants maintained in the enclosures support the notion that mechan-ical abrasion was less than in ambient. This finding is an arti-fact of the structure that could not be avoided. InP. oceanica, thickness changes along the leaf axis and leaves are thinner with depth (Colombo et al., 1983). Given that the experiment was conducted at the same depth and leaves were measured at their center, it is interesting to note that leaf thickness was greatest for the shoots collected from the experimental enclo-sure and that this effect was driven by meaenclo-sures in November. An increase in seagrass leaf thickness would be an opposing effect to those observed for the upright calcified alga,
Acetab-ularia acetabulum, which lost skeletal support under ocean
acidification conditions (Newcomb et al., 2015). There are several possible interpretations of these results. First, leaves at the lower pH may have increased their carbon content as observed for below-ground plant structure of the seagrass
Thalassia testudinumunder elevated pCO2 (Campbell and
enclo-Figure 6.Growth asP. oceanicaleaf production(a)and leaf plas-tochrone interval(b)during the acidification period. After 4 months
of acidification, biomass (above-ground,c; below-ground,d) was determined from replicate cores collected from enclosures and the reference plot. A fourth nearby ambient area was additionally sam-pled to better account for spatial variation.
sure had a tendency towards relatively greater leaf length and maintenance of number of leaves in November. A prolonged leaf life-span could allow plants to scavenge nutrients from senescing leaves to maintain C/N ratio (Gobert et al., 2002).
However, photosynthesis measures were not elevated by the lowered pH and thus there would be no need for increased nutrients. Additionally, increased pCO2 and high light in-creased leaf shedding for the seagrassAmphibolis antarctica (Burnell et al., 2014). The response was linked to prolifer-ation of filamentous epiphytes, which did not occur in this study. Alternately, increased leaf thickness could be the re-sult of chance. The plausible relationship warrants further in-vestigation in field experiments with prolonged duration and increased replication.
If indeed leaf thickness increases with ocean acidification, it is unclear how this would impact herbivore feeding. The main herbivores, the fish, Sarpa salpa, and the sea urchin
Paracentrotus lividus, feed preferentially on the adult and
thicker leaves (Peirano et al., 2001). These herbivores were prevented from grazing in enclosures. Arnold et al. (2012) have reported increased rates of fish grazing on the plant at a proximity of a CO2vent, presumably due to the significant decreases in the production of phenolics. To date, very few studies have focused on plant-herbivore interactions under elevated pCO2 levels (Asnaghi et al., 2013; Campbell and Fourqurean, 2014; Poore et al., 2013) and as plant-herbivore
interactions were not the focus of this study, it is not known how this would have impacted the results.
To our knowledge, this is the first in situ study to repeat-edly and over several months (6) measureP. oceanica fluo-rescence to find that the second rank leaves showed a typi-cal seasonal pattern of plant acclimation (Boardman, 1977). Leaves were more sun-adapted (relatively higher rETRmax andEk)in periods with elevated irradiance and more
shade-adapted when irradiance and photoperiod were reduced. The relatively loweredFυ/Fmin May and July compared to
Oc-tober indicates a down-regulation of PSII activity (Campbell et al., 2003; Henley, 1993) that corresponds with elevated ir-radiance in warmer months. Findings are in agreement with Figueroa (2002) where ETR andEkwere higher in
Septem-ber than in February. Although there have been some con-cerns on the ability of fluorescence techniques to indicate seagrass carbon stimulation (see Cox et al. (2015); Jiang et al., 2010),P. oceanicaproductivity as a function of increas-ing irradiance was in agreement with fluorescence results.
The results of the present study add to the growing evi-dence that the pH change predicted over the next century may result in limited production stimulation forP. oceanica. The relationship between pH andP. oceanicaphotosynthesis was established over a wide range of pHTfrom 9.0 to 7.9 (scale unknown, Invers et al., 1997), or with more extreme low lev-els (6.98 pHT, Hall-Spencer et al., 2008; 7.5 scale unknown, Invers et al., 2002). Within the range of 7.9 to 9.0, the slope of the pH-photosynthesis relationship was significant but, the two variables were moderately related (Invers et al., 1997). Along CO2vents, there was no indication of photosynthetic stimulation at stations with a pH range of 6.98 to 8.17 but, shoot density was 30 % greater than nearby areas at the low-est mean pH station (Hall-Spencer et al., 2008). In a labora-tory incubation ofP. oceanicashoots with their attached epi-phytes, at a similar pHTas this study (∼7.7–7.8), there was also a limited stimulation of productivity (Cox et al., 2015). Similarly, modeled outcomes from laboratory studies of leaf segments by Invers et al. (1997, 2001) predicted that elevat-ingpCO2by the amount used in this experiment would in-crease productivity by only 10 %. This first in situ experiment confirms previous results obtained on isolated plants or leaf segments in the laboratory and is interpreted as in agreement with observations at CO2vents.
Posidonia oceanicahas a shoot lifespan estimated up to
carbon storage as occurred forT. testudinumunder elevated pCO2 (Campbell and Fourqurean, 2013a). Carbohydrates
can be translocated to other ramets (Marbà et al., 2002) which can lessen observed effects but, in this case, enclosure area captured the 20 cm maximum translocation distance de-tected by Marbà and Duarte (1998) and edges severed (de-signed to penetrate ∼8 cm) several outside to inside shoot connections. The most productive period for above-ground growth occurred from April to August; a pattern consistent with increased growth induced from the greater availability of both light and nutrients in early spring and increased stor-age in July to August (Alcoverro et al., 1995, 1998, 2001; Bay, 1984; Duarte, 1989; Ott, 1980). Therefore it is possi-ble that if the experiment were initiated earlier, in a period more conducive for biomass production, or prolonged to cap-ture any lagging effects the outcome may have been different. Only two of six studies support a pulsed seasonal-pH inter-action that could result in long-term gains yet, these were found at pH < 7.7 (see Hall-Spencer et al., (2008); Invers et al., 2002).
We caution that conclusions should not be applied to other seagrasses and that outcomes may vary with differences in community composition and environment. Presumably due to differences in their evolutionary past, some species are comparatively more responsive to lowered pH (Campbell and Fourqurean, 2013b; Invers et al., 2001; Koch et al., 2013).
Posidonia oceanica is less sensitive to pCO2 and can rely
heavily on bicarbonate compared to two other Pacific sea-grass species (Invers et al., 2001). In addition, at CO2seeps in Papua New Guinea, two seagrass species (Cymodocea
ser-rulataandHalophila ovalis) occur in mixed stands and while
both species had increased productivity along the lowered pH gradient, it was onlyC. serrulatawith dense below-ground biomass that had increased abundance (Russell et al., 2013); demonstrating that outcomes may be species specific, related to the plant physiology and structure, and vary with compe-tition. Biological communities and environmental conditions are variable both within (e.g. depth) and among meadows (Hemminga and Duarte, 2000). For example, epiphyte cover-age and thus level of competition were reported to be greater along control stations at Ischia, Italy (Martin et al., 2008) than in our study site, however, differences in methodology prevent direct coverage comparisons. Nutrient concentration can also alter the response of seagrass to CO2additions (Bur-nell et al., 2014; Martínez-Crego et al., 2014). Clearly our un-derstanding of meadow dynamics under ocean acidification conditions could benefit from repeated in situ studies that ad-dress issues such as species differences, more prolonged du-rations, herbivore–plant interactions, and temporal and spa-tial effects.
Performing this experiment in situ, over several months, is an advancement for understanding the response ofP. ocean-icato ocean acidification. The eFOCE design has advantages to other mesocosm systems such as its large size which al-lows for measuring processes at the scale of a meadow, its
ability to monitor the environment in real-time, and its abil-ity to maintain pH as an offset. Though replicated enclosures would have been preferred and are recommended for future use, their implementation was not feasible at this stage. How-ever, several steps were taken to eliminate possible erroneous conclusions including the following: (1) the environment was continuously monitored to ensure comparisons were valid; (2) repeated measurements were made at the same location through time both before and after acidification; (3) compar-isons from the pH manipulated enclosure were made to at least two different spatial locations, and (4) results obtained in laboratory and natural experiments were compared and are in general agreement. The duration of this study was longer than any previous pH perturbation carried out onP. oceanica and it was performed in the most natural conditions possible. This study addresses a need for manipulative experiments done in situ for longer durations to make best predictions of future marine ecology (see Gattuso et al., 2014).
Our findings have implications for the function of future meadows. Seagrasses through their metabolic activity alter the chemical properties of the meadow. In daylight, sea-grasses draw down the available dissolved inorganic carbon and at night their respiration has the opposite effect (Hen-driks et al., 2014a). The daily change in pH has been shown to be up to 0.24 pH units and to be related to the density and length of leaves (Hendriks et al., 2014a). In the current study, the decline in leaf length and 3◦C difference in tempera-ture likely contributed to the decline of ambient pHT from 8.10 to 8.01 from May to November. Hendriks et al. (2014b) has suggested that (1) organisms within the meadow may not be as vulnerable to ocean acidification because they are adapted to large diel pH changes; (2) the productivity of
Posidonia during the day may buffer the impacts of ocean
acidification, particularly for calcifiers by providing a daily window of maximum calcium carbonate saturation where calcification can be more efficient, and (3) ocean acidifica-tion could stimulate seagrass productivity and thus increase buffering capacity, which was not supported by the results of this present study. Considering the two previous proposed hypotheses, the median diel pH variation for the meadow in this study was∼0.1 and also appeared to be driven by plant metabolism. However, the median diel pH range in the exper-imental enclosure was two to three times larger than the con-trol (0.09 to 0.29 pH units) and exhibited greater variability; a finding that would be missed in typical experiments which lower pH and maintain it at a constant future level(s). The variation in diel pH cannot solely be explained by O2fluxes. The increased diel pH fluctuation could largely be the result of the reduced buffering capacity of seawater at lowered pH (Shaw et al., 2013). The lowered and larger diel pH variation and lack of productivity stimulation casts doubt on the adapt-ability of organisms to future pH change and the adapt-ability of a
P. oceanicameadow to serve as a future refuge.
of P. oceanica meadows by the year 2049 (Jordà et al., 2012). The speculation that increased CO2availability would enhance seagrass production and help to alleviate thermal stress (Zimmerman et al., 2015) was not supported. Jordà et al. (2012) also draw attention to the continuing decline ofP.
oceanicameadows from 1990 despite the increase in CO2as
a demonstration of the limited capacity of ocean acidifica-tion to buffer seagrass vulnerability to disturbances. It con-firms observations after an explosive episode at a CO2vent which resulted in an extreme lowering of pH (4.7 to 5.4) and elevated temperatures (28–30◦C, 3 to 5◦C above am-bient). Along this vent,P. oceanicaexperienced a decrease in growth that persisted for 3 years (Vizzini et al., 2010). The extreme nature of the vent activity, confounding biological differences found at vent sites (e.g. Vizzini et al., 2013), and the possible change in physiology under combined stressors make it difficult to predict future meadow ecology. It under-scores the need to investigate stressors concurrently and in situ. The FOCE systems are tools that can be used to investi-gate these types of impacts.
4.1 Summary, caveats, and perspectives
Any benefit from ocean acidification, over the next century,
onPosidoniaphysiology and growth appears minimal. This
conclusion is supported by the similarity of measures be-tween enclosures and in context of results from other studies. We have cautioned that the eFOCE study, like all studies, has limitations. There may be small gains in plant productivity which are masked by an enclosure effect or difficult to iden-tify without replication or more prolonged duration. We rec-ommend that future in situ manipulative efforts use FOCE systems to control pH as an offset, as we did, and increase replication. The field of ocean acidification and future sea-grass ecology could benefit from further in situ experiments that focus on combined stressors, extended experiment du-ration, and differences which occur over varying spatial and temporal scales (eg. within a season promoting above-ground biomass).
The Supplement related to this article is available online at doi:10.5194/bg-13-2179-2016-supplement.
Author contributions. All authors contributed to the research in
this manuscript. Jean-Pierre Gattuso and Frédéric Gazeau were co-principle investigators that had the idea, oversaw the project, and were involved in data collection. Paul Mahacek was responsible for eFOCE system design. Arnaud Le Fur ensured the system func-tioned with assistance from Samir Alliouane, T. Erin Cox, Jean-Pierre Gattuso, and Frédéric Gazeau. T. Erin Cox was responsible for the seagrass protocol and data collection with assistance from Samir Alliouane and advice given by Iris E. Hendriks who con-tributed to fluorescence measures. T. Erin Cox wrote the manuscript
with Jean-Pierre Gattuso and Frédéric Gazeau and all other authors contributed editorial comments.
Acknowledgements. We would like to acknowledge the following
people who assisted in the laboratory, in the field, or with system engineering or maintenance: E. Beck Acain, J. Acain, J. Delille, L. van der Heijden, M. Maillot, F. Moullec, S. Schenone, L. Urbini, K. Walzy´nska. We also thank J.-J. Pangrazi, R. Patrix, and E. Tanguy for aide in construction of the enclosures. Éric Béraud, G. de Liege, D. Luquet, L. Mangialajo, S. Reynaud, and D. Robin kindly assisted in diving activities. We are grateful to C. Ferrier-Pagès and her research team for use of their PAM fluorometer. We also thank B. Kirkwood at Monterey Bay Aquarium Research Institute who advised in system design. We thank the Service d’Observation Rade de Villefranche and the Service d’Observation en Milieu Littoral for their kind permission to use Point B data. We also thank the Service National d’Analyse des Paramètres Océaniques du CO2 for performing the determination of AT at Point B. This work was funded by the “European Free Ocean Carbon Enrichment” (eFOCE; BNP Paribas Foundation), the European Commission through the project “Mediterranean Sea Acidification in a changing climate” (MedSeA; grant agreement 265103) and the MISTRALS-MERMEX (INSU, CNRS) program.
Edited by: G. Herndl
References
Alcoverro, T., Duarte, C., and Romero, J.: Annual growth dynam-ics ofPosidonia oceanica: contribution of large-scale versus
lo-cal factors to seasonality, Mar. Ecol.-Prog. Ser., 120, 203–210, doi:10.3354/meps120203, 1995.
Alcoverro, T., Manzanera, M., and Romero, J.: Seasonal and age-dependent variability ofPosidonia oceanica(L.) Delile
photo-synthetic parameters, J. Exp. Mar. Biol. Ecol., 230, 1–13, 1998. Alcoverro, T., Manzanera, M., and Romero, J.: Annual metabolic
carbon balance of the seagrassPosidonia oceanica: the
impor-tance of carbohydrate reserves, Mar. Ecol.-Prog. Ser., 211, 105– 116, 2001.
Apostolaki, E. T., Holmer, M., Marba, N., and Karakassis, I.: Metabolic imbalance in coastal vegetated (Posidonia oceanica)
and unvegetated benthic ecosystems, Ecosystems, 13, 459–471, 2010.
Arnold, T., Mealey, C., Leahey, H., Miller, A. W., Hall-Spencer, J. M., Milazzo, M., and Maers, K.: Ocean acidification and the loss of phenolic substances in marine plants, PLoS ONE, 7, e35107, doi:10.1371/journal.pone.0035107, 2012.
Asnaghi, V., Chiantore, M., Mangialajo, L., Gazeau, F., Francour, P., Alliouane, S., and Gattuso, J.-P.: Cascading effects of ocean acidification in a rocky subtidal community, PLoS ONE, 8, e61978, doi:10.1371/journal.pone.0061978, 2013.
Bay, D.: A field stuy of the growth dynamics and productivity of
Posidonia oceanica(L.) Delile in Calvi Bay, Corsica, Aquat.
Bot., 20, 43–64, doi:10.1016/0304-3770(84)90026-3, 1984. Beer, S. and Björk, M.: Measuring rates of photosynthesis of two
Boardman, N. K.: Comparative photosynthesis of sun and shade plants, Annu. Rev. Plant Physio., 28, 355–377, doi:10.1146/annurev.pp.28.060177.002035, 1977.
Borowitzka, M. A., Lavery, P. S., and van Keulen, M.: Epiphytes of seagrasses, in Seagrasses: Biology, Ecology and Conservation, edited by: Larkum, A. W. D., Orth, R. J., and Duarte, C. M., Springer, Dordrecht, the Netherlands, 441–461, 2006.
Burnell, O., Russell, B., Irving, A., and Connell, S.: Seagrass re-sponse to CO2contingent on epiphytic algae: indirect effects can overwhelm direct effects, Oecologia, 176, 871–882, 2014. Campbell, J. E. and Fourqurean, J. W.: Novel methodology forin
situcarbon dioxide enrichment of benthic ecosystems, Limnol. Oceanogr.-Meth., 9, 97–109, doi:10.4319/lom.2011.9.97, 2011. Campbell, J. E. and Fourqurean, J. W.: Effects ofin situCO2
en-richment on the structural and chemical characteristics of the sea-grassThalassia testudinum, Mar. Biol., 160, 1465–1475, 2013a.
Campbell, J. E. and Fourqurean, J. W.: Mechanisms of bicarbon-ate use influence the photosynthetic carbon dioxide sensitivity of tropical seagrasses, Limnol. Oceanogr., 58, 839–848, 2013b. Campbell, J. E. and Fourqurean, J. W.: Ocean acidification
out-weighs nutrient effects in structuring seagrass epiphyte com-munities, J. Ecol., 102, 730–737, doi:10.1111/1365-2745.12233, 2014.
Campbell, S., Miller, C., Steven, A., and Stephens, A.: Photosyn-thetic responses of two temperate seagrasses across a water qual-ity gradient using chlorophyll fluorescence, J. Exp. Mar. Biol. Ecol., 291, 57–78, doi:10.1016/S0022-0981(03)00090-X, 2003. Cebrián, J., Enríquez, S., Fortes, M. D., Agawin, N., Vermaat, J.
E., and Duarte, C. M.: Epiphyte accrual onPosidonia oceanica
(L.) Delile leaves: implications for light absorption, Bot. Mar., 42, 123–128, doi:10.1515/BOT.1999.015, 1999.
Cherrett, J. M.: A simple penetrometer for measuring leaf tough-ness in insect feeding studies, J. Econ. Entomol., 66, 1736–1738, 1968.
Ciais, P., Sabine, C., Bala, G., Bopp, L., Brovkin, V., Canadell, J., Chhabra, A., DeFries, R., Galloway, J., Heimann, M., Jones, C., Le Quéré, C., Myneni, R. B., Piao, S., and Thornton, P.: Carbon and other biogeochemical cycles, Cambridge University Press, Cambridge, United Kingdom and New York, NY, USA, 2013. Colombo, P. M., Rascio, N., and Cinelli, F.:Posidonia oceanica(L.)
Delile: a structural study of the photosynthetic apparatus, Mar. Ecol., 4, 133–145, doi:10.1111/j.1439-0485.1983.tb00292.x, 1983.
Cox, T. E. and Smith, C. M.: Photosynthetic rapid light curves for
Padina sanctae-crucisvary with irradiance, aerial exposure, and
tides in Hawaii’s micro-intertidal zones, Mar. Biol., 162, 1061– 1076, doi:10.1007/s00227-015-2649-1, 2015.
Cox, T. E., Schenone, S., Delille, J., Díaz-Castañeda, V., Alliouane, S., Gattuso, J. P., and Gazeau, F.: Effects of ocean acidification on
Posidonia oceanicaepiphytic community and shoot productivity,
J. Ecol., 103, 1594–1609, doi:10.1111/1365-2745.12477, 2015. Dickson, A. G., Sabine, C. L., and Christian, J. R.: Guide to best
practices for ocean CO2measurements, PICES Special Publica-tion 3, British Columbia, Canada, 2007.
Duarte, C. M.: Temporal biomass variability and produc-tion/biomass relationships of seagrass communities, Mar. Ecol.-Prog. Ser., 51, 269–276, doi:10.3354/meps051269, 1989. Duarte, C. M. and Chiscano, C. L.: Seagrass biomass and
produc-tion: a reassessment, Aquat. Bot., 65, 159–174, 1999.
Duarte, C. M., Marba, N., Gacia, E., Fourqurean, J. W., Beggins, J., Barron, C., and Apostolaki, E. T.: Seagrass community metabolism: Assessing the carbon sink capac-ity of seagrass meadows., Global Biogeochem. Cy., 24, 1–9, doi:10.1029/2010GB003793, 2010.
Figueroa, F. L., Jiménez, C., Viñegla, B., Pérez-Rodríguez, E., Aguilera, J., Flores-Moya, A., Altamirano, M., Lebert, M., and Häder, D. P.: Effects of solar UV radiation on photosynthesis of the marine angiospermPosidonia oceanicafrom southern Spain,
Mar. Ecol.-Prog. Ser., 230, 59–70, 2002.
Gattuso, J.-P., Kirkwood, W., Barry, J. P., Cox, E., Gazeau, F., Hans-son, L., Hendriks, I., Kline, D.I., Mahacek, P., Martin, S., McEl-hany, P., Peltzer, E. T., Reeve, J., Roberts, D., Saderne, V., Tait, K., Widdicombe, S., and Brewer, P. G.: Free-ocean CO2 enrich-ment (FOCE) systems: present status and future developenrich-ments, Biogeosciences, 11, 4057–4075, doi:10.5194/bg-11-4057-2014, 2014.
Gattuso, J. P., Epitalon, J. M., and Lavigne, H.: Seacarb: sea-water carbonate chemistry with R., available at: http://CRAN. R-project.org/package=seacarb (last access: (10 April 2016), 2015.
Genty, B., Briantais, J.-M., and Baker, N. R.: The relationship be-tween the quantum yield of photosynthetic electron transport and photochemical quenching of chlorophyll fluorescence, Biochem. Biophys. Acta, 990, 87–92, 1989.
Gobert, S., Laumont, N., and Bouquegneau, J.-M.: Posidonia
oceanicameadow: a low nutrient high chlorophyll (LNHC)
sys-tem?, BMC Ecol., 2, 9–21, doi:10.1186/1472-6785-2-9, 2002. Gobert, S., Cambridge, M. L., Velimirov, B., Pergent, G.,
Lep-oint, G., Bouquegneau, J.-M., Duaby, P., Pergent-Martini, C., and Walker, D. I.: Biology ofPosidonia, in Seagrasses: biology,
ecol-ogy and conservation, edited by: Larkum, A. W. D., Orth, R. J., and Duarte, C. M., Springer, Dordrecht, the Netherlands, 387– 408, 2006.
Hall-Spencer, J. M., Rodolfo-Metalpa, R., Martin, S., Ransome, E., Fine, M., Turner, S. M., Rowley, S. J., Tedesco, D., and Buia, M. C.: Volcanic carbon dioxide vents show ecosystem effects of ocean acidification, Nature, 454, 96–99, 2008.
Harder, D. L., Hurd, C. L., and Speck, T.: Comparison of mechani-cal properties of four large, wave-exposed seaweeds, Am. J. Bot., 93, 1426–1432, doi:10.3732/ajb.93.10.1426, 2006.
Hemminga, M. A. and Duarte, C. M.: Seagrass ecology, Univer-sity of Cambridge, Cambridge UniverUniver-sity Press, United King-dom, ISBN 0-521-66184-6, 2000.
Hendriks, I. E., Olsen, Y. S., Ramajo, L., Basso, L., Steckbauer, A., Moore, T. S., Howard, J., and Duarte, C. M.: Photosynthetic ac-tivity buffers ocean acidification in seagrass meadows, Biogeo-sciences, 11, 333–346, doi:10.5194/bg-11-333-2014, 2014a. Hendriks, I. E., Duarte, C. M., Olsen, Y. S., Steckbauer, A.,
Ra-majo, L., Moore, T. S., Trotter, J. A., and McCulloch, M.: Bi-ological mechanisms supporting adaptation to ocean acidifica-tion in coastal ecosystems, Estuar. Coast. Shelf S., 152, 1–8, doi:10.1016/j.ecss.2014.07.019, 2014b.
Henley, W. J.: Measurement and interpretation of photosynthetic light-response curves in algae in the context of photoinhibition and diel changes, J. Phycol., 29, 729–739, doi:10.1111/j.0022-3646.1993.00729.x, 1993.