ISSN 1553-345X
© 2006 Science Publications
Corresponding Author: Bujang B.K. Huat, Department of Civil Engineering, Faculty of Engineering, University Putra Malaysia, 43400 UPM Serdang Selangor, Malaysia,
Tel: 603-89466368, Fax: 603-86567129
Stability Analysis and Stability Chart for Unsaturated Residual Soil Slope
1
Bujang B.K. Huat,
2Faisal Hj. Ali, and
2R.S.K. Rajoo
1Department of Civil Engineering, University Putra Malaysia
2Department of Civil Engineering, University of Malaya
Abstract: In tropical residual soils most hill slope failures are caused by rainfall. It is therefore important to consider dynamic hydrological conditions when attempting to analyze the stability of residual soil slopes. This paper describes a coupled hydrology/stability model that has been developed to overcome the limitations of the standard method of analysis used to investigate stability of tropical soil slopes. A computational hydrology – limit equilibrium stability analysis model is outlined and examples are provided of the model output capabilities in terms of design charts. Although nowadays most realistic problem should be analyzed by computer and stability charts are mainly used to analyze simple slopes, they can be useful for preliminary analysis and enable the designer to quickly assess the sensitivity of a problem to changes in different input parameters.
Keywords: Matric suction, unsaturated residual soil, slope stability
INTRODUCTION
Tropical residual soils have some unique characteristics related to their composition and the environment under which they develop. Their strength and permeability are likely to be greater than those of temperate zone soils with comparable liquid limits. Most classical concepts related to soil properties and soil behavior have been developed for temperate zone soils, and there has been difficulty in accurately modeling procedures and conditions to which residual soils are subjected[1,2]. There is the need for reliable engineering design associated with residual soils[3]. When the degree of saturation of a soil is greater than about 85%, saturated soil mechanics principles can be applied. However, when the degree of saturation is less than 85%, it becomes necessary to apply unsaturated soil mechanics principles[4]. The transfer of theory from saturated soil mechanics to unsaturated soil mechanics and vice versa is possible through the use of stress state variables, which are net normal stress (σ − ua) and
matric suction (ua −uw),[5]. Where σ is the total stress,
ua is the pore-air pressure and uw is the pore-water
pressure.
Inhabited areas with steep slopes consisting of residual soils are sometimes the sites of catastrophic landslides that claimed many lives[6,7,8]. Globally, landslides cause billions of dollars in damage and thousands of deaths and injuries each year. In the tropical regions, the soils involved are often residual soils and have deep water tables. The surface soils have negative pore water pressures that play a significant role in the stability of the slope. However, heavy, continuous rainfall can result in decreased in matric suction and even increased in pore-water pressures to a
significant depth, induced a cycles of wetting and drying and resulting in the instability of the slope [7,9].
Standard approaches to stability analysis usually simplify consideration of the hydrological condition to that of a static, fixed groundwater level. Stability analysis procedures are than used to determine the factor of safety for the slope, given the distribution of positive pressures along the slip surfaces. Soil suctions are generally ignored in such analyze, being assumed zero. However, many slope failures in tropical residual soils are attributed to complex dynamic hydrological conditions. There is therefore a need to consider a system that is dynamic, with the water table and soil suction responding to the effect of rainfall.
Anderson[10,11] describes a coupled slope hydrology/stability model that has been developed to overcome the limitations of the standard methods of analysis used to investigate stability of tropical soil slopes. However his model takes into account the effect of increase in water table due to infiltration and not the effect of increase in soil strength due to suction. Other methods are to consider the probabilistic or reliability approach[12,13], or nueral network[14].
In this study, as similar scheme was simulated of the dynamic hydrological condition as it changed in response to rainfall and coupled the generated pore pressures (positive and negative) to stability analysis procedure. A finite element hydrology – limit equilibrium stability analysis model is outlined and examples are provided of the model output capabilities in terms of design charts.
Extended Mohr Coulomb failure criterion was used to define three shear strength parameters for unsaturated soils[15], i.e. c’ (apparent cohesion), φ’ (effective angle of friction) and φb
f x b a b w
m w N
R u u N R c F Σ − Σ − − − + Σ = ' tan ' tan tan 1 ' tan tan ' φ φ φ β φ φ β β (1) α α φ φ φ β φ φ β α β sin cos ' tan ' tan tan 1 ' tan tan cos ' N u u N c F b a b w f Σ − − − + Σ
= (2)
{ − } + = α α φ β α β sin N ] cos ' tan u N cos ' c [
Ff w
(3)
Where,
Fm = factor of safety with respect to moment equilibrium
Ff= factor of safety with respect to force equilibrium
R = radius of slip surface or moment arm associated with mobilized shear force on the base of each slice W = total weight of slice
N = total normal force on base of slice
α = angle between the tangent to center of base of each slice and horizontal
β = sloping distance cross base of a slice
x = horizontal distance from centerline of each slice to center of rotation or moment
f = perpendicular offset of normal force from center of rotation or moment.
The factors of safety obtained from analysis incorporating the matric suction were higher than the factor of safety obtained from the conventional slope stability analysis without matric suction. The differences in factor of safety by incorporating matric suction ranged from 12% to 35% higher as compared to the conventional slope stability analysis [16].
DETERMINATION OF CRITICAL CONDITIONS
Before a slope stability chart was produced, a study was made of the different rainfall intensity and conductivity function, for which the critical case was to be found. The following parameters as shown in Table 1 were identified as these values represented the common values for tropical residual soils of Malaysia[17].
In view of the need to consider the short term over-storm hydrological response in the analysis of slope stability, couple slope hydrology/stability models developed by the Geo-slope International Ltd., Canada, namely the Seep/W and Slope/W programs were used. This allowed analysis of the effect of storm events on the slope hydrology (both the saturated and unsaturated
Table 1: Common values for tropical residual soils
Rainfall intensity, qs 1 x 10⁻⁸, 1 x 10⁻⁷, 1 x 10⁻⁶ m/s
for a duration of 24 hour Saturated permeability, ks 1 x 10⁻⁸, 1 x 10⁻⁷, 1 x 10⁻⁶ m/s
Slope height, H 20, 30, 40, 50 meters Slope inclination, tan 1 : 1, 1.5 : 1, 2 : 1
Cohesion, c’ 10kPa
Effective angle of friction, φ ’ 30o
φb/φ ’ 0.25
Bulk density, b 18 kN/m3
A homogeneous slope model was developed with the respected parameters using the Seep/W program and the various infiltration/rainfall intensities were used as input to run the transient condition. The groundwater table was fixed at 10 meters perpendicular distance from the toe of the slope. A maximum suction value of 100 kPa was fixed to simulate the site condition.
A transient analysis was carried out and the respective profile change in the suction was then observed. This output model was later used as input to Slope/W program for stability analysis, using the modified Mohr-Coulomb failure criterion.
As soil moisture conditions changed through time in response to infiltration, so the minimum slip surface position could be expected to change. Within the stability analysis, a search procedure for the minimum factor of safety slip surface was incorporated by specifying a grid of slip surface circle centers and a circle radius in an increasing procedure. This allowed analysis of a whole suite of potential slip surface and the minimum slip surface obtained being assumed to be the overall minimum condition for that time period. A maximum radius of 5 meters parallel to the inclination of the slope was fixed with the varying grid points to find the lowest factor of safety. The maximum radius from the inclined surface was chosen due to the common occurrence of shallow slides of 3 to 4 meters. This depth occurs in residual soils (Grade V and VI) mantles which is parallel to the slope face[18]. The factors of safety were then compared with the various rainfalls, permeability, heights and angle of slopes. The results obtained are discussed as follows. Fig. 1 shows examples of the common rotational slides in the tropical residual soil mantles of Malaysia.
(a) Shallow slide
(b) Deep seated slide
Fig. 1: Common types of slope failures in residual soils of Malaysia
Fig. 2: Factor of safety for various saturated
permeability and slope height (rainfall intensity, q = 1 x 10⁻⁶ m/s)
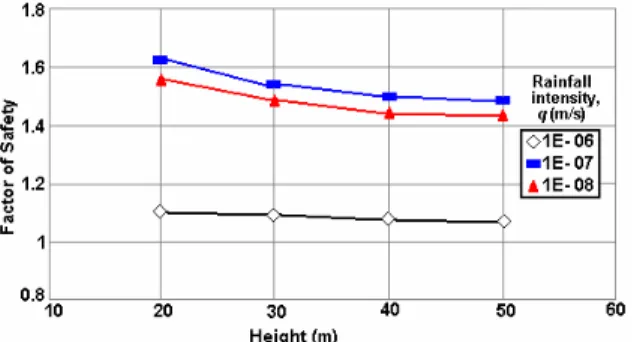
Factor of Safety for Various Rainfall Intensity (qs) For given saturated permeability of the soil, ks = 1 x 10
-6
m/s (Fig. 3), the factor of safety seemed to decrease with increasing slope heights. When the rainfall intensity was close or equal to the saturated permeability, the lowest factor of safety was achieved, whereas there was not much changes in factor of safety when the rainfall intensity (qs) was 1 x10⁻⁷ m/s or 1 x10
-8
m/s. However when ks = 1 x 10⁻⁸ m/s, the factor of safety due to various rainfall intensities tended to be close to one another (Fig. 4). The soil could only infiltrated the maximum value of qs = ks, the excess water would then became the surface runoff.
Fig. 3: Factor of safety for various rainfall intensities (ks = 1 x 10⁻⁶ m/s)
Fig. 4: Factor of safety for various rainfall intensities (saturated permeability, ks = 1 x 10⁻⁸ m/s)
Factor of Safety Various Slope Angle (tan )
For a fixed rainfall intensity (qs = 1 x 10⁻⁶ m/s) and height (H = 50 meters) as in Fig. 5, the factor of safety tended to decrease with increase in slope angle and saturated permeability.
Fig. 5: Factor of safety for various slope angles (rainfall intensity, q = 1 x 10⁻⁶ m/s)
DEVELOPMENT OF THE STABILITY CHART
In the computation of data for the development of stability charts, it had been assumed that the slope was homogeneous and made of a single material with effective shear strength parameters c’ and φ’, and change in shear strength with change in suction, φ b
For all combinations in the range of shear strength parameters chosen, the minimum factor of safety for each slope was determined. Calculations were carried out using the available SLOPE/W (Geoslope Int. ltd) program incorporating the Bishop’s method of analysis. Dimensionless Number c’/ H
For a given value of the dimensionless number c’/ H, the factor of safety depended only on the geometry of the section, expressed as tan , on the pore-pressure given by SEEP/W and on the angle of friction, φ’ and change in shear strength with change in suction, φb,
for unsaturated residual soils.
The use of a dimensionless number for expressing the influence of cohesion on stability has been used by Taylor[19] as an important simplification in total stress analysis and further improved by Janbu[20].
To reduce the amount of computation only three values of c’/ H had been used that is 0.0, 0.015, 0.03. Considering that the cohesion intercept in terms of effective stress was gradually somewhat lower than the cohesion intercept in total stress, these values had been selected as representing the range commonly encountered in effective stress analysis and also a range within which a linear interpolation could be used without significant errors. The intermediate values for c’/ H could be interpolated for a particular slope angle and strength value. It should however be remembered that for cross sections of natural slopes or wide embankments, some errors might be incurred due to the neglect of tension cracks whose effect on stability became more pronounced at higher values c’/ H. For these problems, a modified analysis is generally required.
Factor of Safety (F) as a Function of φb
For a simple soil profile and specified shear strength parameters, it had been found that to a closer approximation, the factor of safety, (F) varied linearly with the magnitude of the tan φb
(dimensionless value of rate of change in shear strength with respect to suction, ua - uw)
Linear relationship between F and tan φ b for a given value of c’/ H, φ ’, tan can be described in terms of two parameters, f and s where geometrically, f is the intersection with factor of safety (F) axis of line describing the relationship between F and tan φ b
and correspond to the value of the factor of safety for zero suction value (φb
= 0), and s was the slope of this line. Since the slope of this line was always positive[21], the
These two parameters f and s were determined from the fitting curve passing through all or near all the respective points where φ b/φ’
= 0.0, 0.25, 0.50, 0.75, 1.00 for various φ’ values process using the Microsoft EXCEL program with an average standard error, R2 value of 0.9.
The value of the stability coefficients f and s were then plotted against tan , the tangent of the slope angle, for values of φ’ of 20, 25, 30, 35 and 40 degrees, and c’/ H of 0, 0.015 and 0.013, for three different heights ranging from H = 0 – 20m, 21 – 40m and 41 – 60m, as shown in Fig. 6 – 14.
Fig.6: Variation of stability coefficients f and s with respect to slope angle for c’/ H = 0, H = 0 – 20 m.
Fig.7: Variation of stability coefficients f and s with respect to slope angle for c’/ H = 0, H = 21 – 40 m
Fig.9: Variation of stability coefficients f and s with respect to slope angle for c’/ H = 0.015, H = 0 – 20 m.
Fig.10: Variation of stability coefficients f and s with respect to slope angle for c’/ H = 0.015, H = 21 – 40 m.
Fig.11: Variation of stability coefficients f and s with respect to slope angle for c’/ H = 0.015, H = 41 – 60 m.
Fig.12: Variation of stability coefficients f and s with respect to slope angle for c’/ H = 0.03, H = 0 – 20 m.
Fig.13: Variation of stability coefficients f and s with respect to slope angle for c’/ H = 0.03, H = 21 – 40 m.
Fig.14. Variation of stability coefficients f and s with respect to slope angle for c’/ H = 0.03, H = 41 – 60 m. To calculate the factor of safety of a section whose c’/ H lied within the range covered by these figures, it was necessary only to apply the equation (4) to determine the factor of safety of the two nearest values of c’/ H and then performed a linear interpolation between these values for the specified c’/ H as the factor of safety (F) was also linearly increasing with dimensionless value c’/ H.
Example 1
Example 1 illustrates the used of the stability chart, for a given height of slope (H) of 30 m and slope angle 1.5 V:1 H and having the effective shear strength parameters c’ = 0 kPa, φ ’ = 30 degrees and φb
= 20, b = 18 kN/m3, and permeability of soil (ks) = 1 x 10
-6
m/s with rainfall intensity (qs) = 1 x 10⁻⁶ m/s for 24 hours.
c’/ H = 0 tan = 1.5V: 1H φ ’ = 30 φb = 20° From Fig. 7, f = 0.40
s = 1.03 From Eqn. 4, F = f + s. tanφb
= 0.40 + (1.03) x tan 20° = 0.78
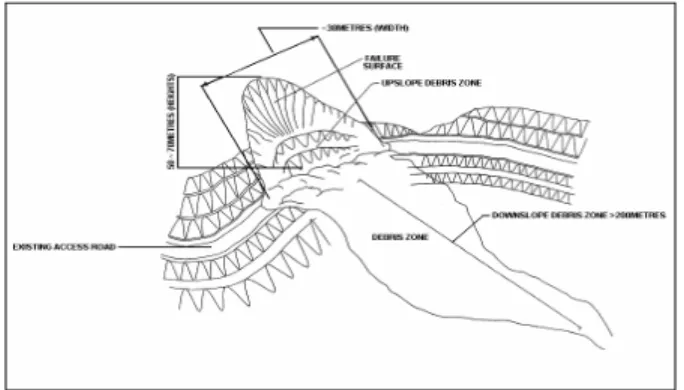
Example 2
Example 2 illustrates an actual slope failure at along a road at the Island of Langkawi, Malaysia. Fig. 15 shows a schematic of the failed slope. The slope was about 60 m high with an angle of about 56o (1.5V:1H). Average shear parameters obtained from laboratory test as follows, c’ = 11 kN/m2, φ ’= 25o and γ= 20.97 kN/m3. This particular slope failed on 14th November 2003, after a period of prolonged and heavy rainfall.
Assuming φb
= 18° as being typical value for granitic residual soil.
c’/ H = 11/(20.97 x 60) = 0.009
For c’/ H = 0, the values of f and s from Fig. 8 were respectively 0.34 and 0.84.
From Eqn. 4, F = f + s. tanφb=
0.34 + 0.84 tan 18o = 0.61
Fig. 15: Schematic of the slope failure at KM 5.95 of the Langkawi – Gunung Raya road, Langkawi island, Malaysia
CONCLUSION
In practice, it is often necessary to form a rapid assessment of stability conditions for a particular slope (or large number of slopes), making direct application of the model impractical. Consequently, the combined model has been applied to range of slope conditions (both slope from and antecedent conditions), with varying characteristics (soil strength and hydrological properties), and the results summarized in the form of design charts. Such charts provide a quick reference data source that allows rapid assessment of the minimum factor of safety in response to rainfall event for a range of potential slope conditions.
From this study it could be concluded that the critical case was obtained when the rainfall intensity was equal to the conductivity function saturated permeability, (i.e. qs = ks).
The factor of safety seems to be linearly increasing with dimensionless number tan φb
. A linear relationship had been obtained as follows,
F = f + s tanφb
Where F is the factor of safety, f and s are stability coefficients, and tan φb
is the rate of change in shear strength with respect to suction (ua – uw).
REFERENCES
1. Fredlund, D.G. and Rahardjo, H. 1985. Theoretical context for understanding unsaturated residual soils behavior. Proceeding 1st International conference Geomech. In tropical laterite and saprolitic soils, Sao Paolo Brazil : 295-306.
2. Fredlund, D.G. and Rahardjo, H. 1993. Soil mechanics for unsaturated soils. New York: John Wiley & Sons Inc.
3. Ali, F.H. and Rahardjo, H. 2004. Unsaturated residual soil. Chapter 4 in Tropical Residual Soils Engineering. Huat et al (editors). Leiden. Balkema. 57-71.
Geotechnical Engineering Division, ASCE. 103: 447−466.
6. Brand, E.W. 1984. Landslide in Southeast Asia. Proceedings of 4th International Conference on Landslide. State of the art report. Toronto. 1: 17-59 7. Brand, D.W. 1985. Predicting the performance of
residual soil slopes. Proceedings of International Conference on Soil Mechanics and Foundation Engineering. San Francisco, 2541-2578.
8. Shaw-Shong, L. 2004. Slope failures in tropical residual soil. Chapter 5 in Tropical Residual Soils
Engineering. Huat et al (ed). Leiden. Balkema. 71-102.
9. Ng, C.W.W., Pang, Y.W. and Chung, S.S. 2000. Influence of drying and wetting history on the stability of unsaturated soil slopes. Landslides in Research, Theory and Practise. Thomas Telford, London. 1093-1098.
10. Anderson, M.G. 1985. Prediction of soil suction for slope in Hong Kong. Geotechnical Control Office, Hong Kong. GCO Publication.
11. Anderson, M.G. 1991. Hydrology, slope stability and cut slope design. IEM/JKR 1991.
12. El-Ramly, H., Morgenstern, N.R. and Cruden, D.M. 2002. Probabilistic slope stability analysis for practice. Canadian Geotechnical Journal. 39: 665-683.
13. Liang, R.Y., Nusier, O.K. and Malkawi, A.B., 1999. A realiability based approach for evaluating the slope stability of embankment dams. Engineering Geology 54: 271-285.
14. Wang, H.B., Xu, W.Y. and Xu, R.C. 2005. Slope stability evaluation using back propagation nueral networks. Engineering Geology. 80: 302-315. 15. Fredlund, D.G., Morgenstern, N.R. and Widger,
R.A. 1978. The shear strengths of unsaturated soil. Canadian Geotechnical Journal. 15: 313-321. 16. Huat, B.B.K., Ali, F. & Mariappan, S. (2005).
Effect of Surface Cover on Water Infiltration Rate and Stability of Cut Slopes in Residual Soils. Electronic Journal of Geotechnical Engineering,
USA: OK (www.ejge.com). Vol 10, 2005. Bundle G.
17. Othman, M.A. 1990. Highway cut slopes instability problems in West Malaysia. PhD thesis. University of Bristol. Unpublished.
18. Ting, W.H. 1984. Stability of slopes in Malaysia. Proceedings Symposium on Geotechnical Aspects of Mass and Material Transportation. Bangkok. 119-128.
19. Taylor, D.W. 1948. Fundamental soil mechanics. John Wiley & Sons, New York.
20. Janbu, N. 1954. Application of composite slip surface for stability analysis. Proceedings of European Conference on Stability of Earth Slopes. Stockholm 3:43-49.