www.nat-hazards-earth-syst-sci.net/13/3063/2013/ doi:10.5194/nhess-13-3063-2013
© Author(s) 2013. CC Attribution 3.0 License.
Natural Hazards
and Earth System
Sciences
Adaptability and transferability of flood loss functions in
residential areas
H. Cammerer1, A. H. Thieken2, and J. Lammel3,*
1Institute of Geography, University of Innsbruck, Innrain 52f, 6020 Innsbruck, Austria
2Institute of Earth and Environmental Science, University of Potsdam, Karl-Liebknecht-Str. 24–25, 14476 Potsdam, Germany 3alpS GmbH, Grabenweg 68, 6020 Innsbruck, Austria
*now at: TIWAG-Tiroler Wasserkraft AG, Eduard-Wallnöfer-Platz 2, 6020 Innsbruck, Austria
Correspondence to:H. Cammerer ([email protected])
Received: 11 July 2013 – Published in Nat. Hazards Earth Syst. Sci. Discuss.: 25 July 2013 Revised: 21 October 2013 – Accepted: 31 October 2013 – Published: 29 November 2013
Abstract. Flood loss modeling is an important component within flood risk assessments. Traditionally, stage-damage functions are used for the estimation of direct monetary dam-age to buildings. Although it is known that such functions are governed by large uncertainties, they are commonly applied – even in different geographical regions – without further val-idation, mainly due to the lack of real damage data. Until now, little research has been done to investigate the applica-bility and transferaapplica-bility of such damage models to other re-gions. In this study, the last severe flood event in the Austrian Lech Valley in 2005 was simulated to test the performance of various damage functions from different geographical re-gions in Central Europe for the residential sector. In addition to common stage-damage curves, new functions were de-rived from empirical flood loss data collected in the aftermath of recent flood events in neighboring Germany. Furthermore, a multi-parameter flood loss model for the residential sector was adapted to the study area and also evaluated with offi-cial damage data. The analysis reveals that flood loss func-tions derived from related and more similar regions perform considerably better than those from more heterogeneous data sets of different regions and flood events. While former loss functions estimate the observed damage well, the latter over-estimate the reported loss clearly. To illustrate the effect of model choice on the resulting uncertainty of damage esti-mates, the current flood risk for residential areas was calcu-lated. In the case of extreme events like the 300 yr flood, for example, the range of losses to residential buildings between the highest and the lowest estimates amounts to a factor of 18, in contrast to properly validated models with a factor of
2.3. Even if the risk analysis is only performed for residential areas, our results reveal evidently that a carefree model trans-fer in other geographical regions might be critical. Therefore, we conclude that loss models should at least be selected or derived from related regions with similar flood and building characteristics, as far as no model validation is possible. To further increase the general reliability of flood loss assess-ment in the future, more loss data and more comprehensive loss data for model development and validation are needed.
1 Introduction
member states has until recently only few or no flood risk maps that include information on the consequences of poten-tial floods (de Moel et al., 2009).
Flood consequences are generally measured by the posure of elements at risk and their vulnerability, often ex-pressed in monetary terms (Thywissen, 2006). Mostly, only the hazard side is depicted, i.e., the flood extent or the po-tential flood depths (de Moel et al., 2009), which reflects the continuous stronger attention of the hazard side in flood risk analysis (Freni et al., 2010; Merz et al., 2010; de Moel et al., 2012). While much effort is done to improve the hazard es-timation leading to more accurate and more reliable models, the estimation of flood damage is still crude and affected by large uncertainties (Merz et al., 2004; Egorova et al., 2008; Freni et al., 2010; de Moel and Aerts, 2011; Meyer et al., 2013).
Until now, there is no standard procedure to determine the flood impact (Oliveri and Santoro, 2000; Nicholas et al., 2001; Luino et al., 2009) resulting in a wide range of flood damage models with substantial differences in their underly-ing approaches (Merz et al., 2010; Papathoma-Köhle et al., 2011; Jongman et al., 2012; Meyer et al., 2013).
Generally, flood damage can be classified in direct and in-direct damage (Smith and Ward, 1998; Merz et al., 2010). Direct damage like loss of life or devastation of buildings and infrastructure comprise those which are caused by the direct physical contact of the flood water with economic assets, hu-mans or any other object (Smith and Ward, 1998). Indirect costs like production loss or cost of emergency service, in contrast, occur inside or outside of the inundated area and often with a time lag, but are induced by the direct impact of the flood event (Cochrane, 2004; Meyer et al., 2013). Both types can be further differentiated in tangible and intangible damage (Smith and Ward, 1998). While tangible damage can be easily expressed in monetary terms, the monetarization of intangible damage, such as impacts on the environment or health, requires different valuation methods since they are not traded on a market (Meyer et al., 2013). More recently, also losses due to business interruption, occurring in areas di-rectly affected by the flood as well as costs of risk mitigation are included as a separate sub-category within loss assess-ments of natural hazards (for a comprehensive overview see Meyer et al., 2013).
However, the quantification of indirect losses by means of Input-Ouput models or Computable General Equilibrium Analysis, for instance, is still problematic (Cochrane, 2004; Meyer et al., 2013). As stated by Meyer et al. (2013) ex-isting models operate only on an aggregated scale and fail to better reflect the interaction between the economic dy-namics and the external shocks by natural disasters in a re-gion. Thus, usually only direct tangible losses are estimated as they are easier to quantify (Merz et al., 2010). For direct losses, susceptibility functions are commonly applied, which relate hazard parameter(s) like water depth with the result-ing economic damage of a certain object at risk, for example,
residential buildings (Merz et al., 2010; Papathoma-Köhle et al., 2011; Meyer et al., 2013). These susceptibility functions vary nevertheless, when different economic sectors like resi-dential properties, commercial units or agriculture are taken into account. But even by attributing elements at risk to the same economic sector with comparable susceptibility char-acteristics, flood damage data still contain a large variabil-ity (e.g., Merz et al., 2004; Kang et al., 2005; Freni et al., 2010; Pistrika and Jonkman, 2010). As outlined by Thieken et al. (2005) flood damage is controlled by a variety of in-fluencing factors which can generally be differentiated into impact parameters (e.g., water depth, flood duration, flow ve-locity, contamination) and resistance parameters (e.g., build-ing characteristics includbuild-ing buildbuild-ing size and asset value, private precaution, emergency measures).
Although it is known that different processes and char-acteristics of a flood event govern flood damage (e.g., Kel-man and Spence, 2004; Schwarz et al., 2005; Thieken et al., 2005; Merz et al., 2010), the majority of damage estimations apply simple depth-damage functions (Luino et al., 2009; Merz et al., 2010; Meyer et al., 2013) as it is internation-ally accepted as standard approach for assessing direct urban damage (Smith, 1994). According to Papathoma-Köhle et al. (2011) the usage of stage-damage functions can be dated back to the seminal paper of White (1945), who linked the water level to relative (i.e., the loss ratio) or total (i.e., in monetary values) damage. Since then, flood damage assess-ment methods were developed in many countries with differ-ent complexity and purposes like the “manual of assessmdiffer-ent techniques” published by Penning-Rowsell and Chatterton (1977) as the first application in Europe. Currently, most damage models still use inundation depth as the main impact parameter (see e.g., Merz et al., 2010; Jongman et al., 2012 for an overview), but some models also integrate additional parameters like flow velocity (e.g., Schwarz and Maiwald, 2007; Kreibich et al., 2009; Pistrika and Jonkman, 2010), contamination (e.g., Kreibich and Thieken, 2008; Thieken et al., 2008; Prettenthaler et al., 2010), the duration of flood-ing (e.g., Dutta et al., 2003; Pennflood-ing-Rowsell et al., 2005) or the recurrence interval (e.g., Elmer et al., 2010). With regard to the consideration of different resistance parameters, the majority of damage models differentiates between the use or type of building (e.g., Oliveri and Santoro, 2000; Dutta et al., 2003; Kang et al., 2005; Büchele et al., 2006; Schwarz and Maiwald, 2007; Kreibich and Thieken, 2008; Thieken et al., 2008). Few models also take additional parameters, such as precautionary behavior (e.g., Büchele et al., 2006; Kreibich and Thieken, 2008; Thieken et al., 2008) or the early warning time (e.g., Penning-Rowsell et al., 2005), into account. Only recently, data mining approaches have been successfully ap-plied to derive more sophisticated damage models (e.g., Merz et al., 2013).
al. (2008) and Prettenthaler et al. (2010), or derived synthet-ically by “what-if-analyses” (e.g., Penning-Rowsell et al., 2005). Another aspect is the division in relative and absolute damage functions. While absolute functions (e.g., Penning-Rowsell et al., 2005 or Prettenthaler et al., 2010) do not re-quire asset values for the estimation of monetary damage since the asset values are incorporated in the damage func-tion, relative functions (like Schwarz and Maiwald, 2007 or Thieken et al., 2008) express the damage as percentage of the asset value of the respective element at risk. In this case, in-formation on the asset values of the elements at risk is needed in addition. Depending on the purpose of the loss estimation, the cost assessment of asset values can be done by replace-ment costs (i.e., the estimated new value of the damaged ob-ject), which are often used for purposes of (re-)insurers, or by depreciated costs (i.e., the estimated present value of the object at the time when the damage actually occurs), which have to be considered in economic studies or project ap-praisals (van der Veen and Logtmeijer, 2005; Merz et al., 2010). A comprehensive overview of different flood damage models regarding the differentiation by all these aspects can be found in Merz et al. (2010) and Jongman et al. (2012), for example.
In general, most of the stage-damage curves are assumed to be restricted to floods with low flow velocities where wa-ter depth is the dominating factor as a faswa-ter flow is ex-pected to increase the probability of higher structural dam-age due to the dynamic load (Kelman and Spence, 2004; Kreibich et al., 2009; Papathoma-Köhle et al., 2011). BWW et al. (1997) suggest categorizing flooding into a static or dynamic type. While static floods occur predominantly in the lowland with rather low flow velocities and slowly ris-ing water levels, dynamic floods occur often in mountainous regions and are characterized by high velocities and inten-sive erosion processes (BWW et al., 1997). Since the ma-jority of the stage-damage functions were derived for low-land regions with slowly rising floods, such as for the lower Rhine (MURL, 2000) or the German Lippe catchment (Hy-drotec, 2002), their applicability is mainly directed towards static river flooding. In contrast, damage estimation studies that address the dynamical character of flooding by consid-ering flood velocity, for example, are rare (e.g., Schwarz and Maiwald, 2007; Kreibich et al., 2009; Pistrika and Jonkman, 2010). Even if the general consideration of flow velocity in flood damage modeling on buildings cannot be necessarily recommended (Kreibich et al., 2009), the dynamic load of flooding seems to be fundamental for the damage pattern on buildings particularly for mountainous regions like the Eu-ropean Alps (e.g., Totschnig and Fuchs, 2013). In case of torrent processes, such as fluvial sediment transport (e.g., Totschnig et al., 2011) or debris flows (e.g., Fuchs et al., 2007), debris actions, such as the deposition of the accu-mulated sediment material, influence the relation on building losses remarkably (Totschnig and Fuchs, 2013).
Nevertheless, for larger mountain rivers like the Aus-trian Lech River no study analyzed the general applicabil-ity of flood damage models so far as previous investigations aimed mainly on dynamic floods of steep torrent streams (see Totschnig and Fuchs, 2013 for an overview). Hence, it is still an open question to which extent depth-damage func-tions which are mainly developed for lowland areas can be applied in mountainous regions where floods are character-ized by a more dynamical impact. In more general terms, the overall applicability and transferability of flood models to other geographical regions is scarcely investigated and thus still compose a major gap in current flood damage modeling research (Thieken et al., 2008; Merz et al., 2010; Jongman et al., 2012; Meyer et al., 2013). What most damage models have in common is that they have been derived for a certain study area with specific regional building characteristics and further specific relationships between losses to buildings and flood impact factors; reliable model application is assumed to be restricted to its region of origin (Oliveri and Santoro, 2000; Kang et al., 2005; Luino et al., 2009; Merz et al., 2010; Papathoma-Köhle et al., 2011). Thus, these models cannot be easily transferred to other regions without any model adap-tation and validation (Merz et al., 2010; Papathoma-Köhle et al., 2011; Meyer et al., 2013) as building types, their asset values and their quality differ in other parts of the world. The evaluation of the flood loss model performance is, however, hardly investigated due to the lack of reliable real damage data (Thieken et al., 2008; Merz et al., 2010; Jongman et al., 2012; Meyer et al., 2013).
This study therefore aims at investigating and evaluating the transferability of various flood damage models to an Aus-trian region located in the Eastern European Alps. Thereby commonly applied stage-damage functions of previous stud-ies in lowland areas, such as MURL (2000), ICPR (2001) and Hydrotec (2002), as well as newly derived depth-damage functions (linear, square root and polynomial approach) for the residential sector are used to estimate direct structural damage to buildings that was observed during the latest flood event in August 2005. Additionally, the multi-parameter flood loss model FLEMO (Thieken et al., 2008) is adapted to this study area to test its applicability and transferability to another geographical region. In contrast to recent studies (e.g., de Moel and Aerts, 2011 and Jongman et al., 2012) identical, site-specific asset values (but also accounting for intrinsic uncertainty) are used for all relative loss functions to single out the sole impact of damage model selection. To illustrate the effect of model choice on the resulting uncer-tainty of damage estimates, the current flood risk for resi-dential areas is assessed. Thereby all 57 specific model com-binations (including also the uncertainty bound of the site-specific asset values) are studied to explore the range of plau-sible, i.e., successfully validated, and all model combinations (including the not successfully validated models).
The test protocol in regard to the spatial model transfer-ability followed the assumption that damage estimates are more reliable if the basic data from which the damage func-tion/model are derived, are more similar (in the sense of more similar building and flood characteristics) to the region un-der study. For this, two data sets – a heterogeneous data set from Germany and a more homogeneous data set from the adjacent German federal state of Bavaria – were used to de-rive new damage models apart from the three applied stan-dard stage-damage functions. The performance of the vari-ous damage estimates was judged by means of official loss data from the government and hydraulic simulations of the flood event in 2005.
2 Data and methods
2.1 Study area and flood event in 2005
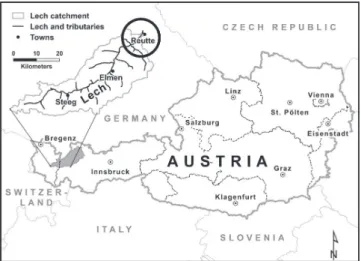
The study area is the Alpine Lech catchment in the north-western part of Austria, mainly located in the federal state of Tyrol (Fig. 1) (i.e., nearly 90 % of the Austrian catchment area up to the to the district capital Reutte). This watershed in the Eastern European Alps has a size of 1000 km2(Dobler et al., 2010) up to that city (gauge Lechaschau/Reutte) which is on the boarder to Germany. In the mountain basin of Reutte the flat valley bottom has its largest extent within the Aus-trian Lech catchment. There, most of the workplaces are pro-vided in the service sector and in the industrial sector, as the agricultural sector decreased remarkably in the last decades (Amt der Tiroler Landesregierung, 2008). Residential areas
Fig. 1. Geographical overview of the study area in Austria.
have expanded strongly (e.g., by 60 % between 1971 and 2006) mainly at the expense of intensively used grassland (Cammerer and Thieken, 2013). In the same period, the pop-ulation in the seven investigated riparian municipalities of the Lech River grew intensively, i.e., by 62 % in the municipality of Pflach (for more details see Cammerer et al., 2013). This study is also limited to the analysis of these seven municipal-ities in the mountain basin of Reutte.
the Adriatic Sea in the northeast direction accompanied by large amounts of rainfall (van Bebber, 1898; Mudelsee et al., 2004; Seibert et al., 2007). In August 2005, several catch-ments in western Austria where affected by torrent processes with its associated sediment transport or geomorpholocial processes such as landslides (BMLFUW, 2006). But larger mountain rivers, such as Inn or Lech, were also character-ized by intensive bed load transport in the headwaters with large destruction on the river channel and infrastructure as a consequence (BMLFUW, 2006). In downstream parts, such as in the lower Lech Valley, however, the sediment trans-port was particularly reduced due the widening and renat-uration of the Lech River (BMLFUW, 2006) in frame of the EU project LIFE (http://www.naturparktiroler-lech.at). Therefore, the flood type can be regarded as an interaction of static and dynamic flooding in this area than a pure dynamic flooding such as in the upper Lech Valley.
2.2 Simulation of the flood event in 2005
In order to investigate the applicability and transferability of different loss functions to the Austrian study area the flood event and observed structural damage in 2005 in the resi-dential sector was simulated. For that, a variety of relative damage functions, which are further explained in Sect. 2.3.2, were applied based on site-specific asset values for residen-tial areas and additional information like level of contamina-tion for the extended models (Sect. 2.2.3) as well as the sim-ulated maximum water depths of the event in August 2005 (Sect. 2.2.1). The outcome of each loss function is finally val-idated by means of official flood loss data from the Tyrolean government (Sect. 2.2.2).
2.2.1 Flood hazard information
Besides the determination of residential properties relative damage functions also require information about the flood hazards to relate damage to property with the characteris-tics of inundation. For the simulation of the maximum wa-ter depths of the flood event in August 2005 we performed a hydrodynamic-numeric modeling by means of the two-dimensional model Hydro_AS-2D (Nujic, 2003). Originally developed for dike breach and flood wave propagation the model is increasingly used for river flood analysis (Noack and Yörük, 2008) and is applied as a standard system for flood routing in the neighboring federal state of Bavaria (Germany). While the spatial discretization is based on the finite-volume method, the temporal discretization is solved by the Runge–Kutta method (for details see Nujic, 2003). The model has the advantage that linear triangular and quad-rangular elements can be used with different spatial resolu-tion in order to consider discharge relevant structures like dikes, streets, etc. (e.g., Noack and Yörük, 2008). The mesh with a length of ca. 10 km consists of a river channel model integrating 40 cross section profiles and a flood plain model
based on laser scanning data with a spatial resolution of 1 m. Hydraulic relevant structures like bridges or structural flood protection measures (e.g., the flood wall that protects the mu-nicipality of Lechaschau) were also considered in the terrain model. The simulation of the flood event in 2005 was car-ried out by adapting the structural protection measures to the situation before the flood in 2005. The hydrologic bound-ary conditions were adjusted for the inlet discharge accord-ing to the discharge at the gauge Lechaschau. Finally, the two-dimensional simulations were performed with the flood wave observed in August 2005.
In order to assess the model performance, the simu-lated water depths were compared with observed water marks acquired from the engineering office “DonauConsult” (http://www.donauconsult.at) recorded one month after the flood by means of leveling of flood level marked stones, bridges or buildings (DonauConsult, personal communica-tion, June 2011). In addition to the water marks, the flood extent was compared with the flood extent mapped by Ebner et al. (2007) in the southern part of the study area, which is based on oblique aerial photos taken by the Austrian Armed Force during the flood event in August 2005. While the model validation was performed by means of the simulated water levels (in m a.s.l.) on a 1 m×1 m grid, the correspond-ing water depths (in m above ground surface) were aggre-gated on a cell size of 10 m by using the mean of the input cells for the intersection with the asset values (10 m cell size) in frame of the damage modeling.
For the flood event in 2005 two hydraulic-simulation runs were considered. Since in 2005 levee failures occurred in the community of Pflach (Kröll, 2007), the dikes were artificially opened at two breach locations in the simulation run “23a”. In the simulation run “22a”, in contrast, the same terrain model is used but no dike breach location was included. In addition to the two simulation runs for the 2005-flood, further hydrodynamic simulations were carried out for discharges that represent the current statistical flood return period of 30, 100, 200 and 300 yr. In these simulations, the recent improve-ments of the structural protection measures were already con-sidered (e.g., heightening of the levees at the community of Pflach).
2.2.2 Official flood loss data of 2005
As the responsibility of the financial support in frame of the disaster fund is assigned to the single federal states, differ-ent approaches exist for loss compensation and loss record-ing (Habersack et al., 2004). In some federal states, losses are not explicitly documented with regard to the damaging process (flood, debris flow etc.), the object at risk (e.g., res-idential building or industry), or the damage to building and household contents, for instance (Habersack et al., 2004). Likewise, each federal state has its own guidelines which determine the extent and content of the financial assistance (Habersack et al., 2004). In Tyrol, for example, an average loss compensation of 20 % of the total damage to buildings and contents can be received by the affected parties (Haber-sack et al., 2004) as long as no insurance indemnities were paid out which are subtracted before loss is compensated by the disaster fund (Habersack et al., 2004; Holub and Fuchs, 2009).
For this study, anonymized loss data of the national Dis-aster Fund for the seven investigated municipalities in the area of Reutte were provided by the Tyrolean government. At first, these data were shaped to our usage by extracting only the loss reports where damage could be traced back due to a flood and where only residential buildings (and house-hold contents) were affected. However, some flood loss re-ports could not be divided into structural damage to build-ings and damage to household contents since both types were affected and only an aggregated loss was recorded. We as-sumed that in case of such a cumulative damage the share of damage to household contents amounted to 30 % of the to-tal loss. This value was taken from the loss documentation guidelines of the federal state of Lower Austria (Amt der NÖ Landesregierung, 2012).
To compare the observed structural damage to residen-tial buildings (EUR 1.9 m;n=70 cases) with the flood loss model estimates using building values of the year 2006 (Sect. 2.2.3) the anonymized and separated building loss data of the national Disaster Fund were indexed to the ref-erence year 2006 by means of the construction cost index of Statistics Austria (2013a). Lastly, a resampling of all build-ing loss records was carried out by means of bootstrappbuild-ing with 10 000 simulated random samples which were drawn by replacement from the structural loss records. The 2.5th and 97.5th percentile of the total building loss as well as the mean (and median) total damage of these samples were used to obtain a 95 % confidence interval of the observed struc-tural losses. Following the work of Thieken et al. (2008), loss estimates that fall within the 95 % interval of the resampled data were assumed to be acceptable, whereas others can be rejected. By this approach it is possible to evaluate the per-formance and transferability of the applied damage models for the estimation of structural damage in residential areas.
2.2.3 Asset values and additional data for the extended models
Asset values are an important prerequisite when flood losses are calculated on the basis of relative damage functions (Wuensch et al., 2009; Merz et al., 2010). Depending on the scale of investigation, single object values (microscale) or aggregated information (meso- and macroscale), such as on municipality level, are required (Wuensch et al., 2009). To bridge the gap between explicit hazard data, such as wa-ter depths and coarse information of the asset values (e.g., municipality or district level), a disaggregation has to be per-formed (e.g., Thieken et al., 2006; Wuensch et al., 2009). Therefore, ancillary information with a higher resolution, such as land use data, are commonly applied to transfer the aggregated (municipal) values to a higher spatial resolution (Merz et al., 2010). Object-based studies, on the other hand, evaluate each element at risk by assigning average economic values to buildings using the volume and type of building (e.g., Keiler et al., 2006; Fuchs et al., 2007) or the build-ing size and number of storeys (e.g., Totschnig et al., 2011; Totschnig and Fuchs, 2013).
similar to the specific values (building fabric) for residential areas of the Rhine Atlas (ICPR, 2001) for different neigh-boring countries. Additionally, the minimum (EUR 224) and maximum (EUR 353) specific replacement value was used to account for uncertainty in sense of valid parallel models (Merz and Thieken, 2009). These threshold values represent the lower and upper boundary of the different specific as-set values between the single municipalities when no average value is used for the whole study area. A comparison of this range of asset values with other studies carried out in Aus-tria is not possible without further ado. The work of Keiler et al. (2006) or Totschnig et al. (2011), for instance, indi-cate only object-based values for dwellings (e.g., EUR 1670 per m2 of the building size; Totschnig et al., 2011) which, however, need to be converted to area-specific values (e.g., Jongman et al., 2012) to make these values comparable.
2.3 Derivation and adaptation of the flood loss models to the study area
2.3.1 Data basis for the flood loss functions
Since more detailed flood loss data of past events have hardly been collected in Austria or do not contain the relevant in-formation to relate the flood losses to a certain water depth (Habersack et al., 2004), we used a comprehensive flood loss database from Germany as a basis for the derivation of various flood loss functions and the multi-parameter loss model. These loss data were collected in the aftermath of flood events in Central Europe in 2002, 2005 and 2006 affect-ing the catchments of the rivers Elbe and Danube. Thereby two surveys with computer-aided telephone interviews were carried out in flood-affected private households in Germany. In the first campaign in 2003, 1697 private households in the German federal states of Bavaria, Saxony and Saxony-Anhalt, which were affected by flooding in August 2002, were interviewed. This data set contains not only loss in-formation from the Elbe River where the floodwater raised slowly (static flood type) but also from its tributaries in the Erzgebirge (Ore Mountains) characterized by flash floods (dynamic flood type) and from the Danube catchment where both flood types occurred (Kreibich et al., 2005; Thieken et al., 2007). Apart from flood losses on residential buildings and household contents, potential flood damage influencing factors like water level, flood duration, contamination, pre-cautionary and emergency measures were recorded in frame of this survey (for a more detailed description of this cam-paign see Thieken et al., 2005, 2007). At the end of 2006, a similar campaign was conducted among 461 private house-holds which were hit by floods in Bavaria in August 2005 or along the Elbe in March/April 2006 (for more details see Kreibich and Thieken, 2009 and Kreibich et al., 2011a). The majority of the interviews (∼70 %) in the second survey were conducted in Bavaria which was affected stronger in financial terms than the Elbe catchment in the following year (Kreibich et al., 2011a).
From this merged database with a total ofn=2158 cases, we first calculated the building loss ratios (i.e., the relative damage). For this, the absolute financial damage to build-ings was indexed to the reference year 2006. In addition, the indexed total value of buildings (replacement costs) was cal-culated as described in detail by Thieken et al. (2005) and Elmer et al. (2010). As not all interviews contained sufficient information for the calculation of the loss ratio for residen-tial buildings these relative losses were only available for 1121 cases. From this data set we considered two subsets which were further used for the model development: the first German-wide data set comprises all cases from both surveys, in which damage ratios were available; this heterogeneous subset contained 1121 cases from different regions in Ger-many. The second data set is constrained to the cases from the federal state of Bavaria, further called Bavarian sample, re-sulting in 415 flood affected households with loss ratios. Re-garding the flood impact (i.e., the exceedance probabilities) in the first survey, the flood event in 2002 was more severe in the Saxon Elbe catchment (T >100) than in the Bavar-ian Danube catchment (T < 100) (see Thieken et al., 2007 and Thieken et al., 2010 for more details). In the second sur-vey, in contrast, the Bavarian part was faced with a stronger flood impact (T =50–100) in 2005 than Saxony in 2006 with T =10–20 (Thieken et al., 2010). Thus, the mean absolute building damage of both surveys is considerably higher in Saxony than in Bavaria, presumably due to the more extreme flood event character in 2002 (Thieken et al., 2010).
Nevertheless, due to the adjacent location of Bavaria to our study area, we hypothesize that the derived loss functions of the Bavarian subset may yield more reliable estimates be-cause, assumably, building and flood event characteristics are more similar to related damage patterns than functions de-rived from data of more dissimilar and different geographical regions. This assumption is supported by findings from, for example, Oliveri and Santoro (2000), Dutta et al. (2003) and Kang et al. (2005).
2.3.2 Derivation of the flood loss models
Since relative stage-damage curves have the advantage of a better transferability in space and time (Oliveri and San-toro, 2000; Merz et al., 2010), we follow a relative (empir-ical) approach in this study. Apart from the application and derivation of different simpler stage-damage functions, a fur-ther goal of this study was also the adaptation of a multi-parameter model to this investigation area as they tend to im-prove the reliability of flood damage modeling (Meyer et al., 2013).
y the loss ratio (MURL, 2000). In case of water levels higher than 5 m, the damage ratio is set to 10 % (MURL, 2000). This model was derived for the Lower Rhine area in Germany using loss data from the German flood damage database HOWAS (Merz et al., 2004) and evaluates relative building losses independently from losses to inventory. The HOWAS database contains object-specific loss data (replace-ment costs) of 4000 buildings (i.e., private households, man-ufacturing, service sector etc.), caused by nine flood events between 1978 and 1994 in different regions (but mainly in the southern part) of Germany (Merz et al., 2004; Thieken et al., 2010). This database was also used to derive the func-tion of Hydrotec (2002), applied in frame of the flood acfunc-tion plan for the German Lippe catchment. Thereby a square root function withy=(27√x)/100 is used to estimate the rel-ative loss on residential buildings. In contrast to these both approaches, the second model (ICPR, 2001) uses addition-ally some synthetical what-if data derived by experts (e.g., engineers) to describe the resulting loss ratio by the func-tiony=(2x2+2x)/100. This model was developed for the Rhine Atlas where flood damage was assessed for different land use types in the whole Rhine catchment (ICPR, 2001). All three loss models have in common that they were de-rived for lowland regions which implies that the water level as main determinant for flood damage is rather slowly rising. On the other hand, we used newly derived damage func-tions in accordance to our test protocol assuming that loss es-timates perform better if the underlying models are derived from related and geographical more adjacent areas. Like in the previous functions, we also used a linear, a square root as well as a polynomial stage-damage curve which are of-ten suggested in flood loss estimation (e.g., Büchele et al., 2006; Kreibich and Thieken, 2008; Elmer et al., 2010). As contamination seems to affect flood losses decisively (e.g., Nicholas et al., 2001; Kelman and Spence, 2004; Kreibich et al., 2005; Penning-Rowsell et al., 2005; Thieken et al., 2005, 2007; Kreibich and Thieken, 2008) and its consider-ation yields in more accurate loss estimconsider-ations (e.g., Thieken et al., 2008; Prettenthaler et al., 2010), we separated these functions regarding the contamination of flood water in an additional stage. As a data basis for the derivation of the six stage-damage functions (with and without consideration of contamination) we used the whole data set from different re-gions in Germany and the Bavarian subset that were intro-duced in Sect. 2.3.1. In contrast to the three standard func-tions above, focusing on lowland rivers like the lower Rhine etc. the underlying data for the newly derived functions were partly collected in mountainous regions like the Erzgebirge (Ore Mountains) or in the Bavarian Danube catchment (see Sect. 2.3.1), where also dynamic flooding with higher flow velocities occurred. Consequently, these new functions may not only be applicable for static flooding, but may also be us-able for mixed flood types like in the mountainous region of Reutte.
Lastly, the multi-factorial flood loss model FLEMO (Thieken et al., 2008) was adapted to the Austrian study area. This empirical model was originally developed on the ba-sis of collected flood loss data in the aftermath of the flood event in 2002 in Germany. In its basic stage, it assesses the direct monetary damage to residential buildings by differen-tiating between five classes of water depth, three residen-tial building types and two building qualities (Büchele et al., 2006; Thieken et al., 2008). In an extended model stage (FLEMO+)three classes of contamination and three classes of private precaution are additionally included. The model is applicable on the microscale, i.e., on the object level, as well as on the mesoscale, i.e., on homogeneous land use units. For both scales it was successfully validated (Thieken et al., 2008) and applied or modified in different studies (e.g., Kreibich and Thieken, 2008; Apel et al., 2009; Merz and Thieken, 2009; Wuensch et al., 2009; Elmer et al., 2010; Kreibich et al., 2011b; Merz et al., 2013).
In this study, FLEMO is applied on the mesoscale by modifying the required input parameters to the Austrian study area. This adapted model is called FLEMOAT and FLEMOAT+ in what follows. In Austria, the building type is not classifiable in one-family, (semi-)detached or multi-family house a priori, when referring to the official statisti-cal data (Statistics Austria, 2013b). There, residential build-ings are only differentiated by the number of included apart-ments per building, e.g., buildings with 1–2 apartapart-ments, 3– 10 apartments etc. Nevertheless, by means of some aux-iliary calculations it was possible to introduce an almost similar classification scheme for the adapted model version. Thereby the building type is differentiated between one-family houses, two-one-family houses (which may include some (semi-)detached houses, but also multi-story houses with two apartments) and multi-family houses (i.e., more than two families/apartments within one building).
The building quality in Austria is differentiated in four classes (Statistics Austria, 2013b) and is adapted to the two different classes applied in Germany, i.e., low/medium qual-ity and high qualqual-ity, by assigning the lower three building quality categories (Ausstattungskategorie der Wohnungen B– D) to low/medium quality and the highest category ( Ausstat-tungskategorie der Wohnungen A) to high building quality.
The level of private precaution and contamination for
example) before the flood event since these two building pre-cautionary measures turned out to be very effective (for de-tails see Kreibich et al., 2005; Cammerer and Thieken, 2011). However, in this context it has to be stated that these both measures may not necessarily be as effective in the study area as in the lowland rivers where the flood impact is more static. According to Holub et al. (2012) other structural protection measures like reinforcement of the outer walls or elimina-tion of building openings at ground surface level may be more promising in mountain environments particularly for fluvial sediment transport related to torrents with dynamic flow conditions and high sediment concentrations. Neverthe-less, since the mountain basin of Reutte is very flat and the flood impact in 2005 was not characterized by large mate-rial deposits in this area (BMLFUW, 2006), we assume that these two precautionary measures are also valuable in this mountain region since its benefit was also tested with loss data from the Erzgebirge (Ore Mountains) (e.g., Kreibich et al., 2005). The derivation of the loss functions (basic model stage) and the scaling factors (Büchele et al., 2006) (for the extended model stage) are finally performed for both subsets separately (i.e., the German data set and the Bavarian sam-ple). Like in case of the newly derived functions both un-derlying subsets contain loss reports from regions where not only static but also dynamic flooding occurred as observed in the study area of Reutte.
For the extended damage functions (consideration of con-tamination) as well as for the adapted model FLEMOAT+ in-formation about contamination and private precaution was gathered by means of the study of Raschky et al. (2009) since the loss reports of the Disaster Fund give no hint about the share of contamination/precaution in the study area. Thereby 218 interviews in private households in the Austrian federal states of Tyrol and Vorarlberg were carried out in the after-math of the flood event in 2005 in order to compare different risk transfer systems of three Alpine regions being affected of this large flood event (Grisons (Switzerland), Tyrol (Aus-tria) and Bavaria (Germany)). Among various questions, also the level of private precaution and contamination (similar to the two campaigns of Sect. 2.3.1) was questioned. While all interviewed households did respond to questions concern-ing their precautionary behavior, less people provided infor-mation on the level of contamination, since only 72 of all surveyed households were actually affected by the flood in 2005 (Raschky et al., 2009). Nevertheless, this information enabled us to determine contamination occurrence and pre-caution in private households in the district of Reutte.
An important prerequisite for the derivation of the loss functions is that the building loss ratios between the single subclasses, for example between both contamination types, differ significantly. Statistical differences between two in-dependent subclasses were tested by the Mann–WhitneyU
test and by the Kruskal–WallisH test for three subclasses and more. In case that the subclasses differ significantly (p <0.05) the corresponding loss ratios are derived for each
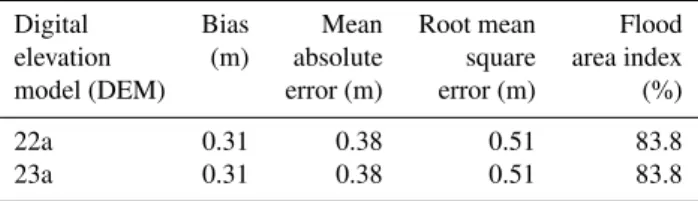
Table 1.Error statistics for two simulation runs of the flood event in 2005. Note: the “flood area index” was only calculated for the southern part of the study area (DEM “22a”: dike heights as in 2005; DEM “23a”: dike heights as in 2005 but artificially opened at two breach locations at the municipality of Pflach as described by Kröll, 2007).
Digital Bias Mean Root mean Flood elevation (m) absolute square area index model (DEM) error (m) error (m) (%) 22a 0.31 0.38 0.51 83.8 23a 0.31 0.38 0.51 83.8
subclass. Otherwise, this variable is not considered as input parameter in the extended/adapted flood loss model. Further-more, all stage-damage curves were calculated based on the water level above ground surface by setting water levels be-low ground surface (cases where only the basement was af-fected) to zero.
The final damage estimation is done on a grid basis. First, the asset map is intersected with the hydraulic scenario which results in the potentially affected assets. Then the loss ratio is determined per grid cell and finally multiplied with the as-set value of the corresponding grid cell to obtain the absolute structural monetary damage to residential buildings. Grid es-timates are summarized per municipality and finally for the whole event.
3 Results
3.1 Validation of the hydraulic simulations
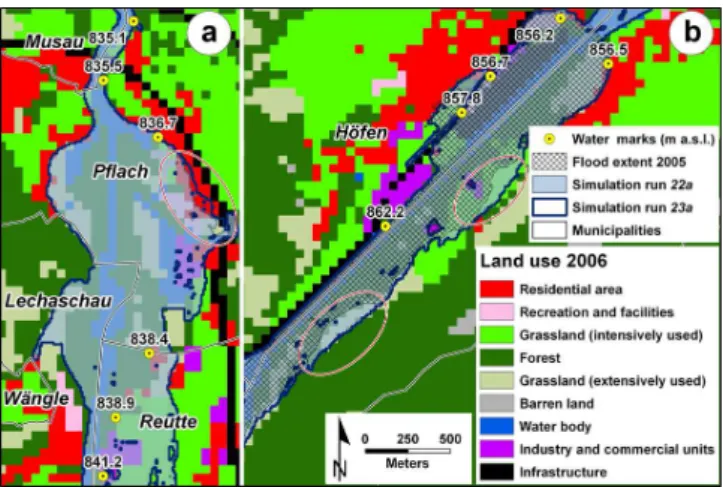
Fig. 2.Comparison of the recorded water marks and the mapped flood extent of the flood event in 2005 with the two hydraulic-simulation runs “22a” (dike heights as in 2005) and “23a” (dike heights as in 2005 but considering dike breaches) in the northern
(a)and in the southern part(b)of the study area. The red circle in figure(a)illustrates the location of the difference in the flood ex-tents at the community of Pflach between both runs. The red circles in figure(b)display the differences between the observed and mod-eled flood extents in the southern study area.
As a quality measure for the modeled flood extent, we cal-culated the “Flood Area Index” (Table 1), which is one of the most recommended measures in the literature (e.g., Apel et al., 2009; Dung et al., 2011). Since the aerial photos were recorded two days after the peak discharge and were not available for the northern part of the study area (Fig. 2a), where the largest inundation occurred, the mapped extent has, however, some shortcomings as quality criterion and therefore serves only as a rough estimate. Thus, the rather low value of 84 % (Table 1) which seems to be insufficient can be refuted due to the shortcomings of the mapping pro-cedure outlined by Ebner et al. (2007). Nevertheless, this in-dex gives a rough estimate that both simulation runs may hit the observed flood extent sufficiently with little differences in the outlines of the flood extent (Fig. 2b, red circles). Al-though it was not possible to compare both simulation runs quantitatively in the northern part at the community of Pflach where the two runs differ distinctly (Fig. 2a, red circle), we conclude that simulation run “23a” is more plausible due to the consideration of the observed dike breaches. Neverthe-less, we use both simulation runs for the further analysis as the quantitative validation results are equal.
Regarding the distributions of the inundation depths within residential areas (Fig. 3), the two simulation runs differ par-ticularly in the range of lower (0.5–0.8 m) and higher (2.2– 3.0 m) water depths. The larger share of higher water depths in simulation “23a” results from the dike breach locations where larger parts of residential area were flooded (Fig. 2a) in contrast to run “22a” where only overtopping effects oc-curred in this area. Therefore the distribution of run “22a”
Fig. 3. Relative frequencies of the water depths (within a 10 cm interval) in August 2005, simulated by the two hydraulic-simulation runs “22a” (dike heights as in 2005) and “23a” (dike heights as in 2005 but considering dike breaches). Note: only inundated grid cells within residential areas are analyzed in this histogram.
shifts to a higher share of lower water depths which will con-sequently affect the damage estimates of both runs.
3.2 Statistical analysis of the flood losses and the derived loss functions
The statistical analysis of the two data sets derived from the surveys in large parts of Germany and in the federal state of Bavaria reveals that, in general, the variation and the mean average of the loss ratios in private households of the mixed subset is larger compared to the Bavarian sample (Table 2). This may be explained by the larger heterogeneity of the German-wide data set, collected in different geographical re-gions and from various flood events with different impacts and process characteristics. As pointed out by Thieken et al. (2005) specific building characteristics, for instance, may affect the specific relationships between losses to buildings and flood impact factors leading to a large variation of dam-age data in more heterogeneous regions (Luino et al., 2009; Merz et al., 2010). This assumption is also supported by our results.
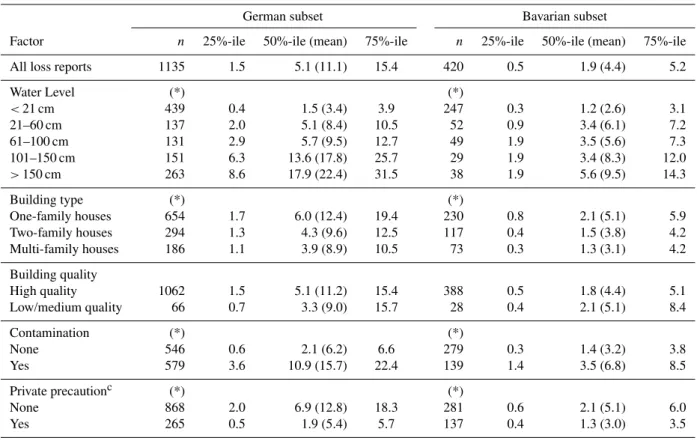
Table 2.Statistical characteristics of the flood damage ratios of the German-wide subsetaand the Bavarian subsetb, differentiated between the factors considered in the extended/adapted flood loss functions.
German subset Bavarian subset
Factor n 25%-ile 50%-ile (mean) 75%-ile n 25%-ile 50%-ile (mean) 75%-ile All loss reports 1135 1.5 5.1 (11.1) 15.4 420 0.5 1.9 (4.4) 5.2
Water Level (*) (*)
<21 cm 439 0.4 1.5 (3.4) 3.9 247 0.3 1.2 (2.6) 3.1 21–60 cm 137 2.0 5.1 (8.4) 10.5 52 0.9 3.4 (6.1) 7.2 61–100 cm 131 2.9 5.7 (9.5) 12.7 49 1.9 3.5 (5.6) 7.3 101–150 cm 151 6.3 13.6 (17.8) 25.7 29 1.9 3.4 (8.3) 12.0
>150 cm 263 8.6 17.9 (22.4) 31.5 38 1.9 5.6 (9.5) 14.3
Building type (*) (*)
One-family houses 654 1.7 6.0 (12.4) 19.4 230 0.8 2.1 (5.1) 5.9 Two-family houses 294 1.3 4.3 (9.6) 12.5 117 0.4 1.5 (3.8) 4.2 Multi-family houses 186 1.1 3.9 (8.9) 10.5 73 0.3 1.3 (3.1) 4.2 Building quality
High quality 1062 1.5 5.1 (11.2) 15.4 388 0.5 1.8 (4.4) 5.1 Low/medium quality 66 0.7 3.3 (9.0) 15.7 28 0.4 2.1 (5.1) 8.4
Contamination (*) (*)
None 546 0.6 2.1 (6.2) 6.6 279 0.3 1.4 (3.2) 3.8 Yes 579 3.6 10.9 (15.7) 22.4 139 1.4 3.5 (6.8) 8.5
Private precautionc (*) (*)
None 868 2.0 6.9 (12.8) 18.3 281 0.6 2.1 (5.1) 6.0 Yes 265 0.5 1.9 (5.4) 5.7 137 0.4 1.3 (3.0) 3.5
aSubset comprises all cases from both surveys carried out in Germany.bSubset is constrained to the interviews collected in the federal state of Bavaria.cPrecaution
is the fact when households implemented “flood adapted building use” and/or “flood adapted interior fitting”. Note: (*) differences in the subsets are significant on a 0.05 level.
quality, in contrast, shows no significant differences in the loss ratios of both subsets. Consequently, this input parame-ter is discarded in the adapted model FLEMOAT.
The loss characteristics differentiated by contamination underpins the importance of considering the effect of con-tamination to building damage in flood loss modeling (e.g., Nicholas et al., 2001; Kelman and Spence, 2004). Both sub-sets show that in case of contamination flood loss differs sig-nificantly and are therefore considered in the simpler stage-damage functions as an additional influencing factor. The benefit of private precaution is also illustrated in Table 2. When one or both of the mitigation measures “flood adapted building use” and/or “flood adapted interior fitting” is imple-mented, the loss ratios of buildings are significantly lower in both subsets justifying once more the great influence of building precautionary behavior. Even in mountain environ-ments local structural protection measures are able to prevent a considerable proportion of the average structural damage per building, particularly in case of low-magnitude but high-frequency torrent processes (Holub et al., 2012). Thus the mitigation effect of private precaution should also be taken into account for the mountainous region of Reutte.
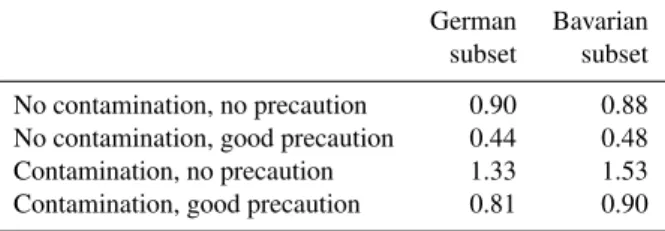
Table 3.Derived scaling factors for building losses due to private precaution and contamination. Factors for the extended loss model FLEMOAT+ are differentiated between the two subsets from Ger-many and Bavaria.
German Bavarian subset subset No contamination, no precaution 0.90 0.88 No contamination, good precaution 0.44 0.48 Contamination, no precaution 1.33 1.53 Contamination, good precaution 0.81 0.90
The different loss functions derived from both subsets as well as the three standard functions are shown in Fig. 4. This figure illustrates the range of the damage functions, partic-ularly for the German-wide data set (Fig. 4a and c). How-ever, even in such a heterogeneous data set the newly de-rived functions lie in closer proximity than the three common stage-damage functions of MURL (2000), ICPR (2001) and Hydrotec (2002), which were derived from the more com-prehensive HOWAS flood loss database and expert judgment (Merz et al., 2004). From the newly derived functions the polynomial functions increase strongest in both data sets, while the remaining functions lie close together, especially in the Bavarian subset. Figure 4c and d show furthermore the impact of contamination as all functions increase steeper when this factor is included.
In order to account for the local characteristics of contam-ination and precaution in the study area the proportion of these influencing factors were derived from the Tyrolean sur-vey. The analysis reveals that most of the households (71 %) in the district of Reutte were not affected by contamination which is slightly higher than in the whole federal state of Ty-rol (68 %) in 2005. The share of households which did not perform one or both of the very effective building precau-tionary measures adapted building use” and/or “flood-adapted interior fitting” amounts to 80 %, but is a little bit lower than in the whole federal state (85 %). The propor-tion of contaminapropor-tion is finally considered for weighting the extended functions to calculate the total damage on resi-dential buildings in the study area. For the extended model FLEMOAT+, the proportions of precaution within the con-tamination classes were used to multiply the total loss of FLEMOATwith the derived scaling factors (Table 3).
3.3 Comparison of the modeled flood damage with the observed loss
The overall reported flood loss to buildings (damage to the building fabric) in the residential sector in 2005 (indexed to 2006) in the area of Reutte amounted to EUR 1.904 m and EUR 1.885 m (mean and median of the 10 000 bootstrap samples), respectively, whereby the 95 % confidence interval ranges from EUR 1.429 m (2.5th percentile) to EUR 2.662 m
Fig. 4.Common stage-damage functions and newly derived ones from the mixed German subset left(a, c)and from the Bavarian subset right
(b, d). FLEMOATcurves in the upper figures are shown for one-family (OFH), two-family (TFH) and multi-family (MFH) houses. Functions
differentiating between contamination (“co.”) and no contamination (“no co.”) are shown in the lower figures(c, d)of the corresponding
subset.
of 2). When contamination and the precautionary behavior are taken into account (FLEMOAT+), the estimates are even marginally better (overestimation factor of∼1.7) for this run and the lowest specific asset values.
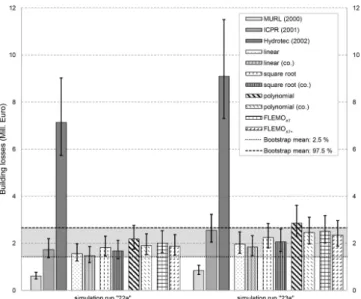
From Table 4 it is further apparent that those loss functions which are derived from the Bavarian subset achieve clearly better results than those from the larger, but mixed German data set. Both for simulation run “22a” and for run “23a” almost all derived functions estimate the reported loss well (i.e., the model estimates lie within the 95 % interval) except for the polynomial function in case of run “23a” (Table 4, Fig 5). In fact, the latter is outside the confidence interval, but is only∼1.4 times higher than the reported loss and therefore more precise than the “best” function of the German-wide data set (linear function considering contamination and min-imum asset values, see above) in this run. However, when the full range of the asset values are applied (Fig. 5), this func-tion is also within this range when assuming the minimum asset values as input data. From Fig. 5 it can further be seen that three functions (linear, linear (co.), square root (co.)) are completely in the validation range independent of the applied asset values in the simulation run “23a”. For the simulation run “22a” even the half of the derived functions (i.e., square root (co.), polynomial (co.) and both FLEMO models) lies
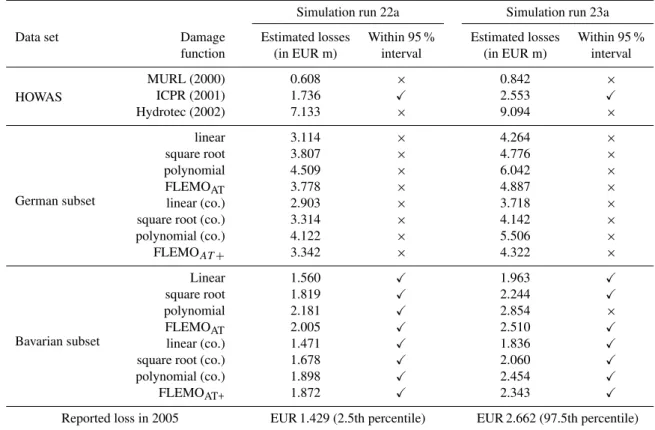
Table 4.Comparison of different loss estimates with the observed flood damage (95 % confidence interval) on residential buildings for the flood event of August 2005 (Xand×means that estimate lies within or outside the confidence interval). Note: for all loss estimates only
mean specific asset values are taken into account here.
Simulation run 22a Simulation run 23a Data set Damage Estimated losses Within 95 % Estimated losses Within 95 %
function (in EUR m) interval (in EUR m) interval
HOWAS
MURL (2000) 0.608 × 0.842 ×
ICPR (2001) 1.736 X 2.553 X
Hydrotec (2002) 7.133 × 9.094 ×
German subset
linear 3.114 × 4.264 ×
square root 3.807 × 4.776 ×
polynomial 4.509 × 6.042 ×
FLEMOAT 3.778 × 4.887 ×
linear (co.) 2.903 × 3.718 ×
square root (co.) 3.314 × 4.142 × polynomial (co.) 4.122 × 5.506 ×
FLEMOAT+ 3.342 × 4.322 ×
Bavarian subset
Linear 1.560 X 1.963 X
square root 1.819 X 2.244 X
polynomial 2.181 X 2.854 ×
FLEMOAT 2.005 X 2.510 X
linear (co.) 1.471 X 1.836 X
square root (co.) 1.678 X 2.060 X
polynomial (co.) 1.898 X 2.454 X
FLEMOAT+ 1.872 X 2.343 X
Reported loss in 2005 EUR 1.429 (2.5th percentile) EUR 2.662 (97.5th percentile)
Note: functions with “co.” in parentheses differentiate further between contamination and no contamination of the flood water, respectively.
site and can therefore be recommended for further loss esti-mations in this area even it was developed for the Rhine. The derivation of new stage-damage functions and the adaptation of the multi-factorial loss model shows that loss data where these models are based on and which are collected in a neigh-boring and also mountainous region with assumable similar building and flood event characteristics and further loss fig-ures yields remarkably better results than (more) loss data from spatially different regions and dissimilar flood events with, for example, higher process intensities. This is in line with prior statements (e.g., Oliveri and Santoro, 2000; Kang et al., 2005; Luino et al., 2009) that loss functions should only be applied in related regions with similar depth-damage relationships particularly when water depth is the only fac-tor considered. But even when other loss decisive parameters like contamination are additionally taken into account, no re-liable loss estimates could be produced when the underlying loss data originate from various geographical regions like the German-wide data set. Also the application of a multi-factorial model which was expected to produce more precise loss estimates failed as far as the basic data are not derived from a more similar and related region like Bavaria. Then, most of the employed loss models work well emphasizing the importance of the spatial aspect of the data basis.
Nevertheless, also the uncertainty of the underlying as-set values has to be taken into account when loss esti-mates are evaluated (e.g., Egorova et al., 2008; de Moel and Aerts, 2011). In fact, most of the damage functions worked well with the mean specific asset values, but some of them achieved only good results with the full range (minimum and maximum specific values) of the site-specific asset values. Therefore, we recommend the usage of not only one (mean) property value as also this important component is associ-ated with uncertainty (Egorova et al., 2008; de Moel and Aerts, 2011). In this context, it has also to be noticed that stage-damage curves which just miss the confidence interval should not generally be discarded as also the reported loss may be affected by uncertainties, even if we aggregated the observed damage to the whole study areas as recommended by Downton and Pielke (2005).
3.4 Current flood risk estimates for residential areas
Fig. 5.Flood loss model estimations with error bars (due to the range of underlying asset values) for the flood event in August 2005 for the two hydraulic-simulation runs “22a” (dike heights as in 2005) and “23a” (dike heights as in 2005 but considering dike breaches) by means of the loss functions derived from the Bavar-ian subset. Loss estimates of the three standard functions (MURL, 2000; ICPR, 2001; Hydrotec, 2002) are also plotted here. The 95 % confidence interval that was derived from reported losses by boot-strapping is highlighted in light grey.
erected in the aftermath of 2005. However, these simulations do not comprise dike breach scenarios as it is assumed that the latest improvements of the levees in the municipality of Pflach, for example, allow no more failures in future. Thus the potential inundation areas are smaller (data not shown) leading to presumably lower potential damage on residential buildings for the 300 yr flood in comparison to the flood of 2005.
To demonstrate the wide range of flood risk curves ob-tained from different damage functions and the intrinsic un-certainty of asset values all possible model combinations are shown in Fig. 6. Thereby each of the 19 damage functions (see Table 4) is combined with the full range of asset val-ues (minimum, mean and maximum specific asset value) resulting in 57 specific model combinations. However, as shown before, a large part of the functions is not plausible for this study area. Particularly the common stage-damage curves (except the function of ICPR, 2001) and the major-ity of the functions derived from the mixed German-wide data set are hardly applicable, independent of the underly-ing asset value and simulation run. In sum, 28 non-plausible model combinations can therefore be discarded contributing to a large uncertainty in the flood risk estimates (Fig. 6). For the 300 yr flood, for example, the range differs by EUR 5.9 m, which corresponds to a factor of∼18 between the highest and the lowest estimate. In contrast, the uncertainty is con-siderably reduced when only plausible model combinations,
Fig. 6.Current risk curve for residential areas with associated un-certainty bounds based on the range of 29 plausible model combi-nations (i.e., successfully validated models), and based on the range of 28 additional, non-plausible loss model combinations. The most accurate functions (i.e., the smallest deviation to the observed loss) in case of the hydraulic-simulation runs “22a” and “23a” for 2005 are shown in dotted lines.
which were successfully validated for the 2005 event in the study area, are employed. A majority of these models is de-rived from the Bavarian subset where the simulated loss lies within the confidence interval (Fig. 5) except for the poly-nomial function when the maximum asset value is applied. The range of these remaining 29 model combinations is then reduced to only EUR 1.0 m corresponding to a factor of 2.3 between the estimates of the highest and the lowest plausible models for this return period.
The best estimated risk curves are also shown in Fig. 6, derived from the most accurate model combinations of the two hydraulic-simulation runs (i.e., FLEMOATand the lin-ear function for run “22a” and the polynomial function con-sidering contamination for run “23a”). The maximum range of these specific combinations is only EUR 0.3 m (factor of 1.3) and illustrates the remaining deviation between the most accurate models as far as two hydraulic-simulation runs are applied for the flood loss model validation. However, for a complete assessment of the associated uncertainty for flood risk curves also the uncertainty of the flood frequency esti-mates has to be taken into account (e.g., Merz and Thieken, 2009).
instance, when different flood loss models and asset values are applied in frame of flood risk estimations. However, de Moel and Aerts (2011) did not show to which extent this range could be reduced by proper model validation before as their focus aimed on the relative comparison of different uncertainty sources like land use data, etc. in frame of flood risk analysis. Furthermore, the effect of different loss models in their study is distorted due to the different underlying asset values of each model. We used instead identical asset, site-specific asset values (but also accounting for intrinsic uncer-tainty) for all relative damage functions to isolate the single effect of model choice. Future research should consequently be aware of the associated uncertainty in case of loss estima-tions which cannot be validated in the corresponding study areas due to the lack of real damage data. In case that no real loss data are available for the flood loss model evaluation, loss functions should at least be selected or derived from re-lated regions with similar building and flood event character-istics.
4 Conclusions
Depth-damage functions are the international standard to as-sess direct flood losses in urban areas. Besides the simplicity of stage-damage functions neglecting other important dam-age influencing parameters, such functions are often used in different geographical regions without evaluating their per-formance, mostly due to the lack of real damage data from the study area. This study aimed therefore at investigating the applicability and transferability of different flood loss func-tions to other geographical regions.
The data basis from which the empirical loss models were derived was split in two subsets with all loss data from dif-ferent regions in Germany, on the one hand. The second subset, on the other hand, comprises only loss data which were collected in a more related region, such as the federal state of Bavaria, Germany, which is very close to the Aus-trian study area. In addition, three common stage-damage functions were used derived from a large but different Ger-man flood loss database and applied in previous studies for lowland rivers before. In accordance with the hypothesis that more similar and related regions (in the sense of more similar building and flood event characteristics) might have quite identical relationships between flood losses and impact parameters this study clearly showed that those loss func-tions performed significantly better than those which are de-rived from a very heterogeneous sample of more dissimi-lar regions and different flood events. Although the well-performing functions are also connected with marginal un-certainties, their range could be reduced remarkably in con-trast to the functions from the German-wide data set or even from another flood loss database with more but mixed loss reports (i.e., the standard functions). The substantial devia-tions of the applied funcdevia-tions demonstrate (1) the need to
de-rive functions from more similar regions that better reflect the characteristics of the region under study and (2) the impor-tance to include more factors than only water level explaining flood damage. We suppose that apart from similar building characteristics also the flood characteristics/processes of the single events play an important role for the flood loss rela-tionship. Since the mean flood losses on buildings in Saxony were considerably higher it is expected that also the extreme event character of the flood (in the year 2002) lead to dif-ferent damage figures, apart from differences in the building characteristics. Future works should therefore also investi-gate the potential variability of flood losses due to different process characteristics of the single flood events.
All in all, the importance of the uncertainty caused by dif-ferent loss functions and based on loss data of difdif-ferent geo-graphical regions becomes apparent when a flood risk analy-sis was carried out. There, the estimates of the non-plausible model combinations (i.e., unsuccessfully validated models by means of the flood event in 2005) differ by a factor of 18 between the highest and lowest loss calculation in case of a 300 yr flood. In contrast, the uncertainty range of the success-fully validated model combinations is reduced to a factor of 2.3 for this return period. Even if the risk was only estimated for residential areas it should become more evident how large uncertainties of single methodological steps like the damage modeling within risk analysis might be. Previous studies al-ready indicated that the largest impact on damage estimation is caused by the shape of the applied depth-damage curve as well as the associated asset values, while the accuracy of the hydraulic input is of minor importance. The validation proce-dure performed in this study underlined, however, to which extent this uncertainty can be reduced in case of flood risk analysis.
Due to these findings, we encourage future research not only to be aware of the problematic applicability and trans-ferability of flood loss models in different geographical re-gions. Instead, more systematic flood loss data collection is needed to adapt and validate flood loss models in other study areas since they are often used in risk analysis, regardless of their associated uncertainties. In case of missing data for model calibration and validation, loss models should at least be selected from related and more similar regions to improve the reliability of such estimates.
The service charges for this open access publication have been covered by the University of Innsbruck and the “Tiroler Wissenschaftsfonds” (TWF).
Edited by: P. Bubeck
Reviewed by: B. Jongman, V. Meyer, and one anonymous referee
References
Amt der NÖ Landesregierung: Standardisiertes Bewertungsver-fahren für Hochwasserschäden bei Wohngebäuden und zuge-hörigen Nebengebäuden einschliesslich Zentralheizung, Inven-tar und Aussenanlagen. Richtwerte 2012/13, St.Pölten, avail-able at: http://www.noe.gv.at/bilder/d63/Katastrophenschaeden_ Technikerbehelf_2012.pdf?25222 (last access: May 2013), Amt der NÖ Landesregierung – Gruppe Baudirektion, St. Pölten, 2012.
Amt der Tiroler Landesregierung: Hydrologische Übersicht August 2005, Landesbaudirektion – Hydrographie, Innsbruck, 2005. Amt der Tiroler Landesregierung: Rechnungsabschluss 2005 des
Landes Tirol, Landesrechnungshof, Innsbruck, 2006.
Amt der Tiroler Landesregierung: Regionalwirtschaftliches Pro-gramm für die Region Naturschutzgebiet-Naturpark Tiroler Lech, Abteilung Raumordnung – Statistik, Innsbruck, 2008. Apel, H., Aronica, G., Kreibich, H., and Thieken, A.: Flood risk
analyses – how detailed do we need to be?, Nat. Hazards, 49, 79–98, doi:10.1007/s11069-008-9277-8, 2009.
BMLFUW: Hochwasser 2005 – Ereignisdokumentation der Bun-deswasserbauverwaltung, des Forsttechnischen Dienstes für Wildbach- und Lawinenverbauung und des Hydrographischen Dienstes, Bundesministerium für Land- und Forstwirtschaft, Umwelt- und Wasserwirtschaft - Sektion Wasser, Vienna, 2006. Bubeck, P., de Moel, H., Bouwer, L. M., and Aerts, J. C. J. H.: How
reliable are projections of future flood damage?, Nat. Hazards Earth Syst. Sci., 11, 3293–3306, doi:10.5194/nhess-11-3293-2011, 2011.
Büchele, B., Kreibich, H., Kron, A., Thieken, A., Ihringer, J., Oberle, P., Merz, B., and Nestmann, F.: Flood-risk mapping: contributions towards an enhanced assessment of extreme events and associated risks, Nat. Hazards Earth Syst. Sci., 6, 485–503, doi:10.5194/nhess-6-485-2006, 2006.
BWW, BRP, BUWAL: Berücksichtigung der Hochwasserge-fahren bei raumwirksamen Tätigkeiten, Bundesamt für Wasser-wirtschaft, Bundesamt für Raumplanung, Bundesamt für Umwelt, Wald und Landschaft, Bern und Biel, 1997.
Cammerer, H. and Thieken, A. H.: Flood Loss Reduction due to Private Precaution, in: Urban Flood Risk Management – Ap-proaches to enhance resilience of communities, Proceedings of the International Symposium UFRIM, Graz, Austria, 21–23 September 2011, 381–386, 2011.
Cammerer, H. and Thieken, A.: Historical development and future outlook of the flood damage potential of residential areas in the Alpine Lech Valley (Austria) between 1971 and 2030, Regional Environ. Change, 13, 999–1012, doi:10.1007/s10113-013-0407-9, 2013.
Cammerer, H., Thieken, A., and Verburg, P.: Spatio-temporal dy-namics in the flood exposure due to land use changes in the Alpine Lech Valley in Tyrol (Austria), Nat. Hazards, 68, 1243– 1270, doi:10.1007/s11069-012-0280-8, 2013.
Chang, L.-F., Lin, C.-H., and Su, M.-D.: Application of geographic weighted regression to establish flood-damage functions reflect-ing spatial variation, Water SA, 34, 209–215, 2008.
Cochrane, H.: Economic loss: myth and measurement, Disaster Pre-vent. Manage., 13, 290–296, doi:10.1108/09653560410556500, 2004.
de Moel, H. and Aerts, J.: Effect of uncertainty in land use, damage models and inundation depth on flood damage estimates, Nat. Hazards, 58, 407–425, doi:10.1007/s11069-010-9675-6, 2011. de Moel, H., van Alphen, J., and Aerts, J. C. J. H.: Flood maps in
Europe – methods, availability and use, Nat. Hazards Earth Syst. Sci., 9, 289–301, doi:10.5194/nhess-9-289-2009, 2009. de Moel, H., Asselman, N. E. M., and Aerts, J. C. J. H.: Uncertainty
and sensitivity analysis of coastal flood damage estimates in the west of the Netherlands, Nat. Hazards Earth Syst. Sci., 12, 1045– 1058, doi:10.5194/nhess-12-1045-2012, 2012.
Dobler, C., Stötter, J., and Schöberl, F.: Assessment of cli-mate change impacts on the hydrology of the Lech Val-ley in northern Alps, J. Water Climate Change, 1, 207–218, doi:10.2166/wcc.2010.122, 2010.
Downton, M. and Pielke, R.: How Accurate are Disaster Loss Data? The Case of U.S. Flood Damage, Nat. Hazards, 35, 211–228, doi:10.1007/s11069-004-4808-4, 2005.
Dung, N. V., Merz, B., Bárdossy, A., Thang, T. D., and Apel, H.: Multi-objective automatic calibration of hydrodynamic models utilizing inundation maps and gauge data, Hydrol. Earth Syst. Sci., 15, 1339–1354, doi:10.5194/hess-15-1339-2011, 2011. Dutta, D., Herath, S., and Musiake, K.: A mathematical
model for flood loss estimation, J. Hydrol., 277, 24–49, doi:10.1016/S0022-1694(03)00084-2, 2003.
Ebner, V., Fritzmann, P., Gstaiger, V., Kelterer, M., Maurer, D., and Nieland, S.: Rekonstruktion der Hochwasseranschlagslinien an Gebäuden vom Augusthochwasser 2005 und Vergleich der Ergebnisse mit den HORA-Modellierungen, Abschlussbericht Projektmodul 2006/07, Institut für Geographie, Innsbruck, 2007. EC (European Commission): A new EU Floods Directive 2007/60/EC, available at: http://ec.europa.eu/environment/water/ flood_risk/ (last access: May 2013), 2007.
Egorova, R., van Noortwijk, J. M., and Holterman, S. R.: Uncer-tainty in flood damage estimation, Int. J. River Basin Manage., 6, 139–148, doi:10.1080/15715124.2008.9635343, 2008. Elmer, F., Thieken, A. H., Pech, I., and Kreibich, H.: Influence
of flood frequency on residential building losses, Nat. Hazards Earth Syst. Sci., 10, 2145–2159, doi:10.5194/nhess-10-2145-2010, 2010.
Freni, G., La Loggia, G., and Notaro, V.: Uncertainty in urban flood damage assessment due to urban drainage modelling and depth-damage curve estimation, Water Sci. Technol., 61, 2979–2993, 2010.
Fuchs, S., Heiss, K., and Hübl, J.: Towards an empirical vulner-ability function for use in debris flow risk assessment, Nat. Hazards Earth Syst. Sci., 7, 495–506, doi:10.5194/nhess-7-495-2007, 2007.
Habersack, H., Bügel, J., and Petrascheck, A.: Analyse der Hochwasserereignisse vom August 2002 – FloodRisk, Synthe-sebericht, Bundesministerium für Land- und Forstwirtschaft, Umwelt und Wasserwirtschaft, Wien, 2004.