www.hydrol-earth-syst-sci.net/14/99/2010/ © Author(s) 2010. This work is distributed under the Creative Commons Attribution 3.0 License.
Earth System
Sciences
Multi-model comparison of a major flood in the groundwater-fed
basin of the Somme River (France)
F. Habets1,2, S. Gascoin2, S. Korkmaz3, D. Thi´ery4, M. Zribi5, N. Amraoui4, M. Carli2, A. Ducharne2, E. Leblois6, E. Ledoux3, E. Martin1, J. Noilhan1, C. Ottl´e5,7, and P. Viennot3
1GAME/CNRM (M´et´eo-France/CNRS), URA 1357, Toulouse, France 2UMR-Sisyphe, UMR 7619, Sisyphe, CNRS UPMC, Paris, France 3Centre de G´eosciences/Mines-Paristech, Fontainebleau, France 4BRGM, Orl´eans, France
5CETP, V´elizy, France 6CEMAGREF, Lyon, France 7LSCE, Gif-sur-Yvette, France
Received: 4 September 2009 – Published in Hydrol. Earth Syst. Sci. Discuss.: 28 September 2009 Revised: 24 December 2009 – Accepted: 6 January 2010 – Published: 18 January 2010
Abstract. The Somme River Basin is located above a chalk aquifer and the discharge of the somme River is highly in-fluenced by groundwater inflow (90% of river discharge is baseflow). In 2001, the Somme River Basin suffered from a major flood causing damages estimated to 100 million euro (Deneux and Martin, 2001). The purpose of the present re-search is to evaluate the ability of four hydrologic models to reproduce flood events in the Somme River Basin over an 18-year period, by comparison with observed river discharge and piezometric level as well as satellite-derived extents of flooded area. The models used differ in their computation of surface water budget and in their representation of saturated and unsaturated zones. One model needed structural mod-ification to be able to accurately simulate the riverflows of the Somme river. The models obtained fair to good simula-tions of the observed piezometric levels, but they all overes-timate the piezometric level after flooding, possibly because of a simplistic representation of deep unsaturated flow. Mod-els differ in their annual partition of the infiltration of water within the root zone (mostly driven by simulated evapotran-spiration), but these differences are attenuated by water trans-fers within the saturated and unsaturated zone. As a conse-quence, the inter-model dispersion of the computed annual baseflow is reduced. The aquifer overflow areas simulated during flooding compare well with local data and satellite images. The models showed that this overflow occurs al-most every year in the same areas (in floodplain), and that
Correspondence to:F. Habets [email protected]
the flooding of 2001 was characterized by an increase in the quantity of the overflow and not much by a spreading of the overflow areas. Inconsistencies between river discharge and piezometric levels suggest that further investigation are needed to estimate the relative influence of unsaturated and saturated zones on the hydrodynamics of the Somme River Basin.
1 Introduction
In 2001, the flooding of Abbeville, a town located by the Somme River in Northern France struck public attention. The flood lasted for several months, required more than 1100 people to be evacuated and caused 100 million Euro of esti-mated damage (Deneux and Martin, 2001). The flood oc-curred in a basin located above a widespread chalk aquifer which usually smoothly reacts to rainfall events. In 2001, however, a rapid increase of 10 m in the piezometric level was locally observed in a few weeks only. As pointed out by Pointet et al. (2003), such a reaction may be due to the acti-vation of fissure flows in the unsaturated zone (possible when the UZ is getting close to the saturation, when the matrix po-tential is close to−50 cm according to Mahmood-ul-Hassan and Gregory (2002) and Jackson et al. (2006)), leading to a fast rise in the water table.
more frequently due to climate change (Pinault et al., 2005). A long-term experiment FLOOD1 (Amraoui et al., 2009; Thi´ery et al., 2008) was also set up to observe and under-stand how the unsaturated and saturated zones of the chalk aquifer of the Somme basin vary, and to compare this site to other experimental sites in the UK (Price et al., 2000; Lee et al., 2006; Ireson et al., 2006; Goody et al., 2006).
The present article aims at answering the following questions:
1. Are the unsaturated and saturated zones well repre-sented by the models, even particularly during the floods?
2. Is there an advantage to use complex land surface schemes instead of simple ones?
3. Can remote sensing observation from space be used to assess the flooding simulations in hydrologic models? We addressed these questions using a long-term model in-tercomparison. The article is organized as follows: first, a description of the characteristics of the Somme basin is pre-sented. Then, the four models used in this study and their cal-ibration are briefly described. Next, the results of the models are compared, with a special focus on the 2001 flooding. Fi-nally the impact of the spatial resolution and the role of the unsaturated zone are discussed.
2 Description of the Somme basin
The Somme River catchment has an area of 6433 km2 (Fig. 1). The river flows 245 km before reaching the English Channel. It has a very gradual slope, slow waters and regu-lar flow, and is continuously sustained by the Chalk aquifer. The river runs in wide valleys, with many ponds and marshes, and steep hillsides to dry plateaus, as water infiltrates easily into the chalk and the covering silt deposits. In the upstream basin, there are several dry valleys, but some non-perennial sources can appear depending on the aquifer level. The chalk is characterized by the presence of fissures due to chalk dis-solution. These fissures are more developed in the valleys than in the plateaus (Crampon et al., 1993) and lead to a dual porosity of the chalk, resulting from interstitial porosity and fracture porosity (Lee et al., 2006). Consequently, the basin has a highly non-linear response to rainfall, depending on its initial state, and the unsaturated zone plays an important role in the hydrodynamic of the river (Pinault et al., 2005). The thickness of the aquifer varies from 20 to 200 m, while the thickness of the unsaturated zone varies from 1 m in the wet valleys to more than 50 m under the plateaus.
From a meteorological point of view, the mean annual rainfall (about 800 mm/year) is very close to the mean annual potential evapotranspiration (PET). There is a low precipita-tion gradient between the upstream and downstream areas, with more rain closer to the sea.
The Somme hydrograph is typical of rivers closely con-nected to a chalk aquifer for a pluvial oceanic regime: there is not that much difference between low and high flows and the peaks are quite smooth. Thus, the fast component of the flow (that closely follows rainfall) is quite reduced, owing to the relative absence of surface runoff (Headworth, 1972).
Detailed analyses of the observed data were made to un-derstand the 2001 flooding (Hubert, 2001; Pointet et al., 2003; N´egrel and P´etelet-Giraud, 2005). This flooding was the consequence of several years with larger precipitation than average, aggravated by a winter with strong precipita-tion. The lower part of the basin has been affected by floods with return periods over 100 years, while the upper basin has been less affected, with return periods of about 20 years.
3 Presentation of the models 3.1 Short description of the models
To simulate the long-term water budget of the Somme Basin as well as the flooding period, four models are used. Two of them are finite differences hydrogeological mod-els: MARTHE (Thi´ery, 1990) and MODCOU (Ledoux et al., 1989). Other two models are the combination of a land surface model (LSM) with a hydrogeological model: the Catchement LSM or CLSM (Koster et al., 2000; Ducharne et al., 2000), and SIM (Habets et al., 2008).
The CLSM is a semi-distributed model, which couples the energy fluxes parameterizations of the Mosaic LSM (Koster and Suarez, 1992) to the concepts of TOPMODEL (Beven and Kirkby, 1979) to generate runoff and soil moisture pat-terns. SIM is the association of the ISBA LSM (Noilhan and Planton, 1989; Boone et al., 1999) with the MODCOU hy-drogeological model. Thus, MODCOU and SIM differ only by the way the surface water budget is computed: MODCOU uses a simple reservoirs scheme that solves daily water bud-get, while SIM uses a LSM developed for weather forecast model that solves sub-daily water and energy budgets.
MARTHE is the hydrogeological model from the BRGM, the French public institution involved in the Earth Science field. It was the first model applied on the Somme basin shortly after the flooding (Amraoui et al., 2002).
HA LLU
E
L’AVRE LA
SO MME
LA SELLE LA NIEVRE
L’ A
V R
E
LA SO
M M
E
LA SO
MM E
LA SOMME
CLSM
MODCOU and SIM MARTHE
river gages SOMME HALLUE NIEVRE AVRE SELLE
altitude (m)
0 - 50 51 - 100 101 - 150 151 - 200 201 - 250
40 30 20 10 0Kilometers
Fig. 1.Domains simulated by the four models: the domain used by CLSM corresponds to the surface topographic catchment upstream from Abbeville. MARTHE and MODCOU simulate a wider domain, as explained in the text. SIM uses the same domain as MODCOU.
These four models present several important differences: – MARTHE and MODCOU solve a daily water budget,
with the input data of daily precipitation and poten-tial evapotranspiration (PET), while the CLSM and SIM compute the diurnal cycle of both water and energy bud-gets, using hourly precipitations, incoming solar and at-mospheric radiations, 2 m air temperature and humidity, and 10 m wind speed;
– the deep unsaturated zone is not taken into account by the CLSM and it is represented with a simple percola-tion funcpercola-tion in MARTHE, and with a simple concep-tual model in MODCOU and SIM;
– the saturated flows are computed by a 2-D finite differ-ence model to solve the hydrodynamic equation based on the Darcy’s law and mass conservation in MARTHE, MODCOU and SIM, while it is represented by a con-ceptual linear model in the CLSM (Gascoin et al., 2009).
3.2 Model implementation and calibration
Two datasets were made available for each one of the mod-eling groups: the 18-year period (from 1 August 1985 to 31 July 2003) atmospheric forcing from the SAFRAN analy-sis (Durand et al., 1993; Quintana-Segu`ı et al., 2008) and the
ECOCLIMAP database (Masson et al., 2003) that gives soil and vegetation maps and associated parameters.
For the implementation and calibration of the models, the choice was made not to impose any conditions on the model-ers, in order to allow them to express their skills without any constraint. The drawback of this position is that the results can be difficult to analyze.
The period used for the calibration as well as the atmo-spheric data used for the calibration, varies across the mod-els. Indeed, MARTHE was applied to the basin before this intercomparison project, using a coarse network of observed atmospheric stations to derive the atmospheric forcing for its calibration. After this first step, it used the SAFRAN dataset that was available at a finer resolution and over a longer du-ration. The periods of calibration and validation cannot be really distinguished for each model. However, the calibra-tion of the models was realized over long periods, without concentrating on a given event.
3.2.1 Implementation of MARTHE
the surface topographic basin (5560 km2), MARTHE extends its modeling domain to the Bresle and Authie rivers as natu-ral boundary conditions in the South and North (Fig. 1), but in the East, instead of reaching the Oise river, in order to limit the simulated aquifer domain, MARTHE uses the crest of the piezometric level.
The calibration of the distributed model was based on the trial/errors method on the period 1995–2002, and consisted in two main steps: first, a calibration of the surface water budget, using a distributed application of the GARDENIA model, and then, a calibration of the storage coefficient and the transmissivity. To account for the time delay of the flow in the unsaturated zone, MARTHE uses a simple percola-tion funcpercola-tion, with a spatial average time constant of about 3 months. The distributed model was first calibrated on the period 1995–2002 by Amraoui et al. (2002) and then the grid was refined in 2006 and 2007 (Amraoui et al., 2007). Now, MARTHE uses a 500 m resolution in plateaus and a finer 100 m one in the valleys.
To account for different quality of the atmospheric forcing data used in the calibration phase and in the present study, a correction factor calibrated on the local PET estimation was applied to the SAFRAN PET. This correction factor is 0.8, which means that the PET was reduced by 20%. Such cor-rection may seem important, but the impact of such reduction for the estimation of the actual evapotranspiration (AET) is sensitive mainly in winter, when the PET is low. Moreover, the difference between the SAFRAN PET and the observa-tion is about 10% on an annual basis (Benatya, 2004). 3.2.2 Implementation of MODCOU
The extension of the MODCOU model differs from the one of MARTHE, since in the East, the natural limit was set to the Oise River. Thus, the simulated domain is larger (8205 km2, Fig. 1). The hydrographic network was derived using the HYDRODEM software (Leblois, 1993; Leblois and Sauquet, 2000), and the final spatial resolution varied from 125 m to 1 km, with higher resolution being associated with the river and sub-basin limits.
The calibration of the MODCOU model is also based on the trial/errors approach on the period 1995–2003, and is ex-plained in detail in korkmaz et al. (2009). First guess pa-rameters were derived from existing simulations: i) from the Seine application for the surface water budget and unsatu-rated flow transfer parameters, and ii) from the MARTHE application for the groundwater parameters. Then, the pa-rameters related with the simulation of the surface water bud-get were adjusted, as well as the groundwater parameters in a steady state. The steady state piezometric level was used to derive the depth of the unsaturated zone, which is sup-posed to be constant in time. The unsaturated zone transfer model used in MODCOU is based on a conceptual Nash cas-cade model (Nash, 1960). The other parameters of the Nash cascade were derived from the Seine basin application: the
depth of each reservoir was set to 5 m, and the drainage co-efficients vary according to the geological map. Then, there were successive iteration to calibrate those parameters (kork-maz et al., 2009).
3.2.3 Implementation of SIM
The SIM model is used by M´et´eo-France in an operational mode over France to monitor the water budget on the national scale using a 8 km grid (Habets et al., 2008). In this study, the unsaturated and saturated flows parameters calibrated by MODCOU were used in SIM. Although SIM results from the coupling between a LSM and a groundwater model, it is not fully coupled, and especially, there is not yet a feedback be-tween the depth of the unconfined aquifer and the soil mois-ture simulated by the LSM, as in Yeh and Elathir (2005) or Miguez-Macho et al. (2007). Thus, the surface water budget was not affected by the introduction of the aquifer. How-ever, in this application, the 8 km resolution used in SIM-France seemed too coarse to discriminate the valleys from the plateaus, hence, a 1 km resolution was used. Therefore, the surface water budget is different in the SIM-France ap-plication and in this apap-plication. The impact of such refine-ment is discussed in Sect. 6. As stated before, MODCOU and SIM differ only by the way their surface water budgets are computed. In SIM, it is computed by the ISBA LSM. Most of the ISBA parameters are derived according to soil and vegetation types (Masson et al., 2003). Only a few pa-rameters are subject to calibration. For this application, only one ISBA parameter was modified: the subgrid runoff co-efficient which allows some surface runoff to be generated before the complete saturation of the cell. A default value is used in the SIM-France application in order to generate some surface runoff. However, since the fast component of the Somme riverflows is very weak, it was decided to set this coefficient to a low value (b=0.01), in order to limit surface runoff to a minimum.
3.2.4 Implementation of the CLSM
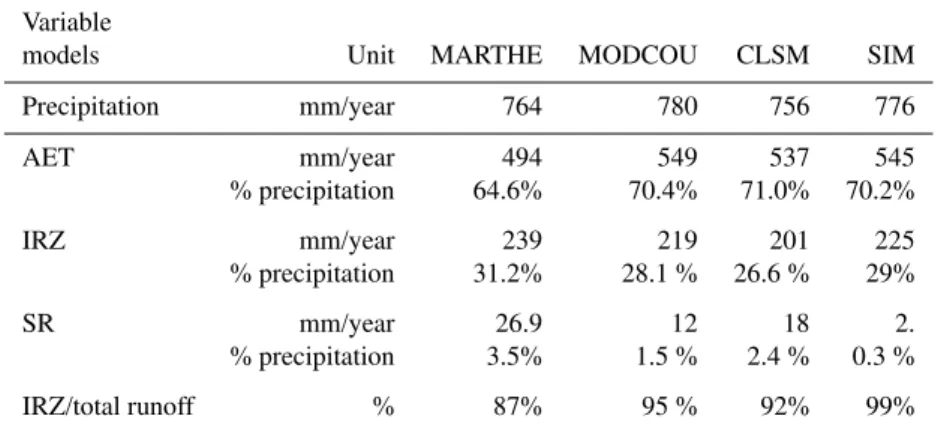
Table 1.Annual Water Budget simulated by each model on average over its domain of simulation. The fluxes are given both in mm/year and as a percentage of the total precipitation. The differences in the value of the precipitation (used as an input) are due to the differences in the simulated domain.
Variable
models Unit MARTHE MODCOU CLSM SIM
Precipitation mm/year 764 780 756 776
AET mm/year 494 549 537 545
% precipitation 64.6% 70.4% 71.0% 70.2%
IRZ mm/year 239 219 201 225
% precipitation 31.2% 28.1 % 26.6 % 29%
SR mm/year 26.9 12 18 2.
% precipitation 3.5% 1.5 % 2.4 % 0.3 %
IRZ/total runoff % 87% 95 % 92% 99%
AET = Actual evapotranspiration (PET = 810 mm; PET MARTHE = 648 mm); IRZ = Infiltration from the root zone, SR = Surface runoff
variations of runoff, with low flows close to zero and high flows strongly overestimated.
Calibration proved insufficient to achieve a satisfactory simulation of riverflow (Carli, 2005). Therefore, an addi-tional reservoir was developed and added to CLSM, which allows the model to store more water and release it as slow flow (Gascoin et al., 2009). Water is diverted from the soil moisture reservoir during the wet season (when soil mois-ture is greater than a calibrated threshold) to recharge a lin-ear reservoir designed to approximate the groundwater flow from the thick Chalk aquifer. Note that this reservoir pro-vides a lumped representation of the transfer and storage in both the deep unsaturated and saturated zones and its water content is not comparable to a piezometric level.
In this study, the CLSM model was used as a lumped model over the entire Somme basin upstream from Abbeville (5566 km2). There was no other spatial heterogeneity than the soil moisture patterns derived from the topographic in-dex distribution, and riverflow can only be simulated at Abbeville. A detailed presentation of the model and its cali-bration on the period 1985–2003 in the Somme basin can be found in Gascoin et al. (2009). In particular, the calibrated transfer time through the additional linear reservoir is 700 days, in the range of the values found by Milly and Wether-ald (2002) for a similar parametrization in many major river basins.
4 Analysis of the long term simulation of the Somme basin
In this section, the comparison of the 18-year simulations of the Somme basin by the four models is presented. In a first step, the mean annual water budgets are compared, then, the simulation of the riverflows and piezometric levels are compared with the observations.
4.1 Analysis of the water budgets 4.1.1 Evaporation
The water budget computed by each model is quite similar (Table 1): the actual evapotranspiration (AET) represents ap-proximately 70% of the precipitation for the CLSM, MOD-COU and SIM, and 65% for MARTHE. The lower evapo-ration rate in MARTHE is partly explained by the fact that MARTHE used a correcting factor on the provided PET. The soil infiltration corresponding to the flux at the bottom of the soil reservoir (or root zone) represents about 30% of the pre-cipitation, while the remaining part of the precipitation gen-erates surface runoff. For all models, all the soil infiltration flux reaches the water table and then the river. Thus, it can be said that about 90% of the riverflows are provided by the aquifer outflows, which is coherent with the isotopic tracer study by N´egrel and P´etelet-Giraud (2005), and with the ab-sence of surface runoff in the chalk catchment (Headworth, 1972).
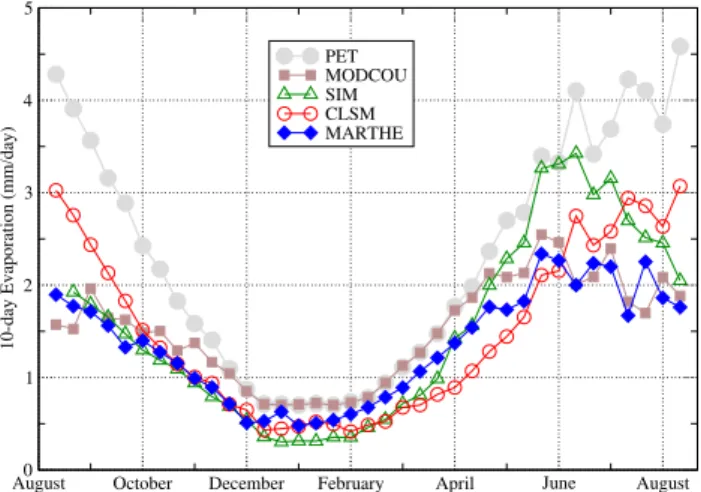
August0 October December February April June August 1
2 3 4 5
10-day Evaporation (mm/day)
PET MODCOU SIM CLSM MARTHE
Fig. 2. Mean annual evolution of the 10-day evolution of the po-tential evapotranspiration (PET, black plain circle) and the actual evapotranspiration simulated by MODCOU (square), SIM (trian-gle), CLSM (circle) and MARTHE (diamonds), in mm/day.
provided there is enough available water in the reservoir. As the reservoir is filled by winter rainfall, the AET can reach the potential value in winter. On the other hand, the two LSMs SIM and the CLSM compute the diurnal variation of the coupled water and energy budgets, and in particular, the soil moisture and soil temperature at several depths in the soil. Thus, they better take into account the various param-eters influencing the evaporation flux: the atmospheric de-mand, the available energy, the soil water stress, and the state of the surface, including the actual development of the veg-etation. For these land surface models, the computed AET is the combination of several fluxes: i) the bare soil evapo-ration, ii) the plant transpievapo-ration, iii) the interception of pre-cipitation by the vegetation, and iv) the evaporation from the snow cover (negligible in the Somme basin). To do so, they use as input the hourly values of seven atmospheric variables (Sect. 3), as well as a description of the annual cycle of the vegetation. In the Somme basin, the vegetation presents a clear annual cycle: on average on the domain, the vegetation fraction ranges from 33% of the surface in winter to 90% in summer, and the leaf area index ranges from 0.6 m2m−2 to 3.8 m2m−2in summer. Thus, in SIM and CLSM, both plant transpiration and interception loss become negligible in win-ter and only bare soil evaporation occurs, but at a rate close to only 50% of the PET.
Although the AET simulated by the CLSM and SIM are closer to each other than those simulated by the hydroge-ological models, they present some differences. In spring, the AET from SIM rises at a higher rate than that from the CLSM, while in autumn, the AET decreases faster for SIM than for the CLSM. This is due to the fact that at the begin-ning of the dry period, the soil moisture in the CLSM can be fed by the shallow water table (see below and Fig. 3), thus limiting the soil water stress.
4.1.2 Soil water fluxes
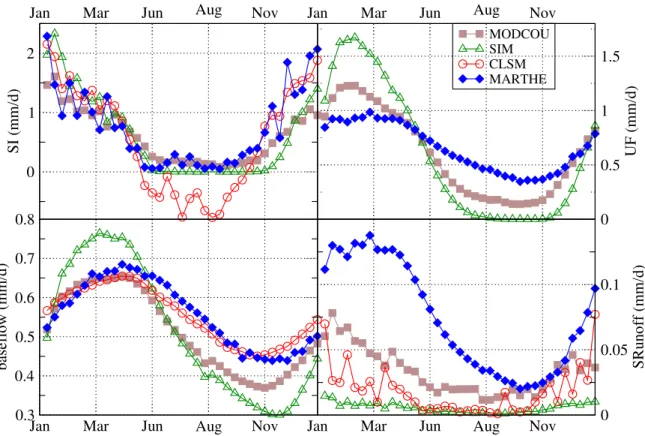
Figure 3 shows the annual cycle of four soil water fluxes: the soil infiltration (SI) corresponds to the flux at the bottom of the soil reservoir or root zone, the flux from the unsaturated zone (UF), the baseflow from the aquifer (BF), and the sur-face runoff.
The surface runoff is rather weak (less than 0.1 mm day−1), but is sensitively larger for MARTHE than for the other models.
The SI flux is the more scattered flux. In summer time, MODCOU and MARTHE have a low positive flux (0.1 mm day−1), while it is close to zero for SIM, and neg-ative for the CLSM. A negneg-ative flux means that some water from the saturated zone feeds the root zone. Such process is not surprising in the valleys where the aquifer is close to the surface. The 10-day evolution of the SI flux is nois-ier in MARTHE than in the other models, which shows that MARTHE reacts faster to the precipitation signal than the other models. As expected from the comparison of the an-nual cycles of the AET, the SI fluxes simulated by SIM and MODCOU are quite different, SIM having a larger annual variation of this flux than MODCOU.
MARTHE, MODCOU and SIM take into account an un-saturated zone depth ranging from 1 to 104 m, with an av-erage value of 32 m (the deep unsaturated zone is not rep-resented in CLSM). For these three models, the transfer throughout the unsaturated zone smoothes and add a delay to the SI flux. The unsaturated flow (UF) has an average per-colation rate ranging from 0.5 to 1 m day−1. The impact of the unsaturated zone (Fig. 3) is greater in MARTHE (reduc-tion of the amplitude by 70% and peak delayed by 60-day) than in MODCOU and SIM (approximately 27% reduction of the amplitude and peak delayed by about 30-day).
However, these three representations of transfers in an un-saturated chalk are quite different from the description of the Pang-Lambourn chalky basin in the UK. Jackson et al. (2006) and Mathias et al. (2006) argue that the transfer in the unsat-urated flow has a unique impact: to add a time delay. This time delay is associated with an average apparent percola-tion rate of 3.1 m day−1(Ireson et al., 2006), which is in the range of the values derived from the observation of 12 bore-holes by Headworth (1972) (from 1.5 to 6.7 m day−1). Thus, in the Somme basin, MARTHE, MODCOU and SIM use a lower percolation rates than in similar basins, and assume a smoothing effect to the chalk unsaturated zone.
Jan Mar Jun Aug Nov
0 1 2
SI (mm/d)
MODCOU SIM CLSM MARTHE
Jan Mar Jun Aug Nov
0 0.5 1 1.5
UF (mm/d)
Jan Mar Jun Aug Nov
0.3 0.4 0.5 0.6 0.7 0.8
baseflow (mm/d)
Jan Mar Jun Aug Nov 0
0.05 0.1
SRunoff (mm/d)
Fig. 3. Mean annual evolution of the soil water cycle simulated by MODCOU (square), SIM (triangle), CLSM (circle) and MARTHE (diamonds) in mm/day. The plots show a 10-day evolution of Soil Infiltration (SI), Unsaturated Flow (UF), Base Flow (BF) and Surface Runoff (SRunoff).
than 70% for MODCOU and SIM and by 62% for MARTHE. Thus, it can be said that the impact of the groundwater mod-els to smooth the recharge flow is comparable between these three models. However, for MODCOU and SIM, most of the attenuation of the amplitude of the flow is due to the transfer in the groundwater, while in MARTHE, both the saturated and unsaturated zones have a comparable effect. For the CLSM, the baseflow is dominated by the outflow from the groundwater linear reservoir, the original baseflow from the shallow aquifer being only 27% of the total (not shown). The time constant of 700 days in the linear reservoir allows ob-taining an amplitude of the baseflow very similar to the other models. The mean-annual baseflows simulated by MARTHE and the CLSM are similar. This is surprising since the soil in-filtration and evaporation flux simulated by these models are fairly different. Indeed, only the SIM model presents a dif-ferent behavior, with an annual amplitude almost twice larger than in the other models. SIM is also the only model for which the unsaturated and saturated flows parameters were not calibrated using its simulated surface water budget.
Thus, for the Somme basin, it can be said that the calibra-tion of the hydrological transfers in the saturated and unsatu-rated zones erases the temporal differences in the estimation of the surface water budget on a mean annual basis. From this result, it appears that the sole comparison of groundwater
recharge models as presented by Bradford (2002) may not be sufficient to estimate the best modeling approach. It therefore appears that hydrogeological modeling should be considered as a whole, from the surface water budget to the groundwater flow.
4.2 Riverflows
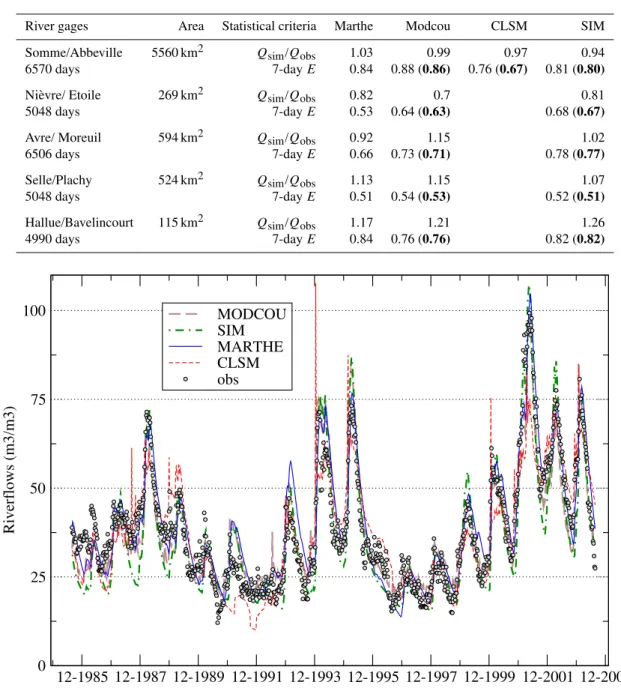
The riverflows are observed at fives gages in the Somme basin. The four models are able to simulate the daily river-flows, but, for the CLSM, the flow is not routed, and thus, the comparison with the observed riverflow is only possible at a lower frequency (7-day averaged). Moreover, the CLSM computes the riverflow only at the outlet of the basin. Ta-ble 2 gives for each gage and each model the coefficient of efficiencyE(Nash and Sutcliffe, 1970) and the water balance ratio (Qsim/Qobs).
Table 2. Statistical results obtained for the comparison of the observed and simulated riverflows over the 18-year period: discharge error
ratio (Qsim/Qobs) and 7-day efficiency (E). Daily efficiency is given in bold for the models that compute daily riverflows.
River gages Area Statistical criteria Marthe Modcou CLSM SIM
Somme/Abbeville 5560 km2 Qsim/Qobs 1.03 0.99 0.97 0.94
6570 days 7-dayE 0.84 0.88 (0.86) 0.76 (0.67) 0.81 (0.80)
Ni`evre/ Etoile 269 km2 Qsim/Qobs 0.82 0.7 0.81
5048 days 7-dayE 0.53 0.64 (0.63) 0.68 (0.67)
Avre/ Moreuil 594 km2 Qsim/Qobs 0.92 1.15 1.02
6506 days 7-dayE 0.66 0.73 (0.71) 0.78 (0.77)
Selle/Plachy 524 km2 Qsim/Qobs 1.13 1.15 1.07
5048 days 7-dayE 0.51 0.54 (0.53) 0.52 (0.51)
Hallue/Bavelincourt 115 km2 Qsim/Qobs 1.17 1.21 1.26
4990 days 7-dayE 0.84 0.76 (0.76) 0.82 (0.82)
12-1985 12-1987 12-1989 12-1991 12-1993 12-1995 12-1997 12-1999 12-2001 12-2003 0
25 50 75 100
Riverflows (m3/m3)
MODCOU SIM MARTHE CLSM obs
Fig. 4. Comparison of the 7-day riverflows of the Somme at Abbeville observed (plain circles), and simulated by MODCOU (thick dashed), SIM (dot-dashed), MARTHE (continuous) and CLSM (thin dashed).
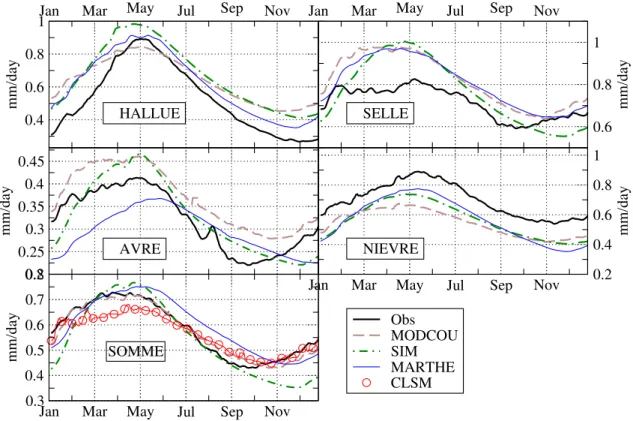
comparison of the simulated and observed average annual cy-cles for the 5 gages is presented in Fig. 5. For the Somme at Abbeville, MODCOU achieves the best agreement with the observed annual cycle, while MARTHE overestimates the recession flow, SIM underestimates the low flows, and the CLSM underestimates the maximum flow on average.
For the tributaries (not simulated by the CLSM), it appears that none of the models is able to accurately represent the observed annual cycles. Table 2 shows that the quality of the
simulations is still statistically fair for the Hallue and Avre rivers (E >0.7), but decreases on the Ni`evre and Selle rivers
(0.5< E <0.7). In general, SIM and MODCOU obtained
better results in terms of riverflows.
Jan Mar May Jul Sep Nov
0.4 0.6 0.8 1
mm/day
HALLUE
Jan Mar May Jul Sep Nov
0.6 0.8 1
mm/day
SELLE
0.2 0.25 0.3 0.35 0.4 0.45
mm/day
AVRE
Jan Mar May Jul Sep Nov 0.2
0.4 0.6 0.8 1
mm/day
NIEVRE
Jan Mar May Jul Sep Nov
0.3 0.4 0.5 0.6 0.7 0.8
mm/day
Obs MODCOU SIM MARTHE CLSM SOMME
Fig. 5.Mean annual cycle of the observed and simulated riverflows on the 5 gages.
are time lagged. Thus the spatial variabilities of the Somme basin is not well captured by all models, which leads to an uneven distribution of the quality of the simulated riverflows. 4.3 Piezometric levels
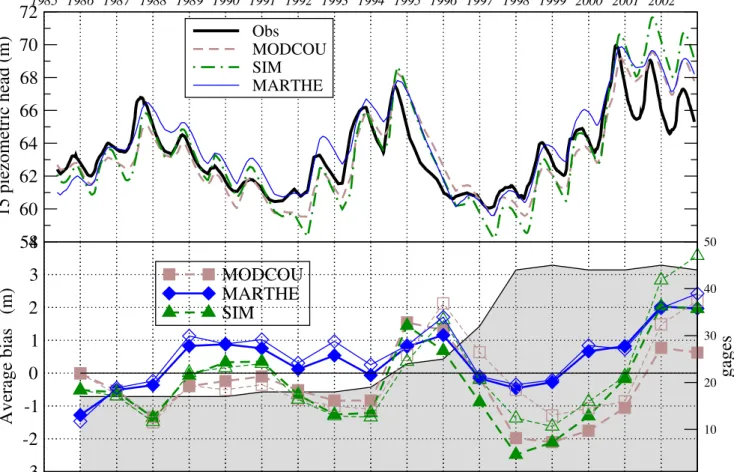
More than fifty piezometers are available at least occa-sionally during the 18 years of interest. Three out of the four models simulate the distributed piezometric level: MARTHE, MODCOU and SIM. Figure 6 presents the daily evolution of the piezometric level averaged over 15 obser-vation wells that are available during the full period. There are two periods of high level in 1994–1995 and 2001–2002 and the recessions in between are well captured by the three models. The simulated annual bias is presented in the bottom panel. MARTHE tends to evenly overestimate the hydraulic level, while SIM and MODCOU have a negative bias with an important variation in time. Thus, it seems that MOD-COU and SIM have some issues for simulating properly the water table dynamic at these 15 observation wells. This is also true during the flood period (2001). The three models however show a positive bias during the recession periods of 1996 and 2002–2003. Thus, it may be that the models are not able to simulate a correct recession after a high flow period, or that they have some difficulties to simulate the peak flows.
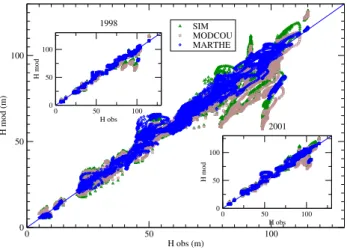
Such result is confirmed looking at the comparison be-tween the full observations (all data available for all observa-tion wells) and the simulaobserva-tions of the three models presented Fig. 7. The results of SIM and MODCOU are more scattered than those of MARTHE. Two included panels present the re-sults for two contrasted years: a dry year 1998 and a wet year 2001. There is a weak evolution of the piezometric level in 1998, but some observation wells are badly represented by SIM and MODCOU (the level is underestimated). In 2001, the piezometric levels display more variations and the errors in SIM and MODCOU tend to be reduced.
The dispersion is more pronounced for the high values of the piezometric level located in the plateaus than for the lower ones. This is due to the fact that in the valleys, the water table is closer to the surface and thus its evolution is limited. But this is also certainly due to some weaknesses in the simulation of the flow in the unsaturated zone.
Table 3.Average piezometric level simulated by the models over the same domain and the entire 18-year period, and statistical comparison
of the observed and simulated piezometric level at the gaging stations. The normalized RMSE (RMSn) is equal to the RMSE divided by the
amplitude of the observed piezometric level (RMSn=RMS/(Hobsmax−Hobsmin)).
MARTHE MODCOU SIM
Average bias on the 45 observation wells (m) 0.88 −0.80 −0.19
Average square correlation on the 45 observation wells 0.71 0.68 0.67
Average RMS on the 45 observation wells (m) 2.69 4.23 4.54
Number of observation wells with a RMSE lower than 3 m 31 23 18
Average normalized RMSE on the 45 observation wells 0.38 0.72 0.80
Number of wells with a normalized RMSE lower than 0.5 36 30 26
Average normalized RMSE 0.74 1.55 1.71
Number of wells with a normalized RMSE lower than 0.5 25 21 13
Average bias on the 15 selected piezometers (m) 0.57 −0.17 −0.08
1985 1986 1987 1988 1989 1990 1991 1992 1993 1994 1995 1996 1997 1998 1999 2000 2001 2002 2003
10 20 30 40 50
gages
1985 1986 1987 1988 1989 1990 1991 1992 1993 1994 1995 1996 1997 1998 1999 2000 2001 2002
58
60
62
64
66
68
70
72
15 piezometric head (m)
Obs
MODCOU
SIM
MARTHE
1985198619871988198919901991199219931994199519961997199819992000200120022003
-3
-2
-1
0
1
2
3
4
Average bias (m)
MODCOU
MARTHE
SIM
0 50 100 H obs (m)
0 50 100
H mod (m)
SIM MODCOU MARTHE
0 50 100
H obs 0
50 100
H mod
1998
0 50 100
H obs 0
50 100
H mod
2001
Fig. 7. Comparison of the simulated versus observed piezometric level for each observation well and the entire period, and for two contrasted years.
5 Analysis of the 2001 flood simulations
As stated before, detailed analysis of the observed data dur-ing the flood have been done by Hubert (2001) and Pinault et al. (2005). Therefore, in this section, the emphasis is put on the comparison of the simulation of the four models with the observations. The models were calibrated over a long time period, and not particularly for the period of the flood. Therefore, a focus on this targeted period can be considered as being a partially independent assessment.
Three kinds of observations are used in this section: the observed riverflows and piezometric levels, and the flooded areas derived from satellite.
5.1 Comparison between observed and simulated riverflows
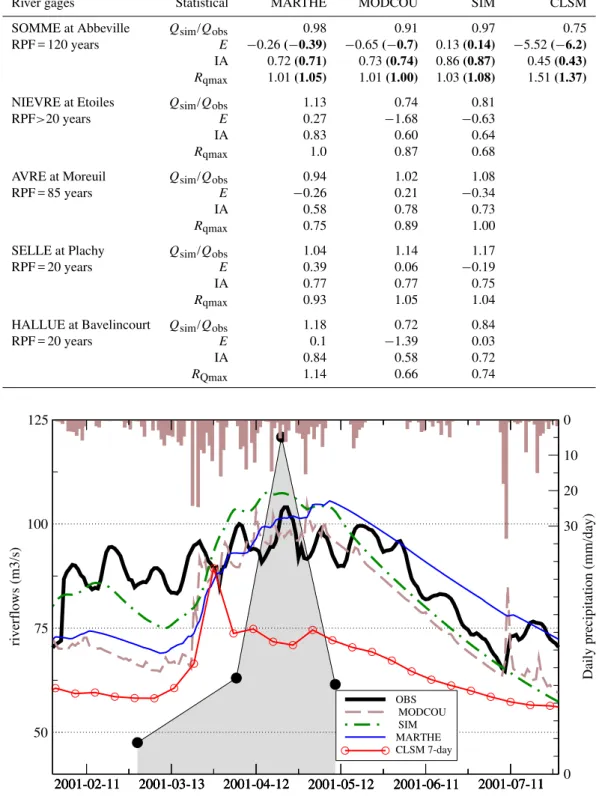
To focus on the flooding, we have selected the period when the observed riverflows of the Somme at Abbeville were above the 10-year return flood, i.e. above 71 m3s−1. This period lasted from 30 January 2001 to 28 July 2001 and cov-ered 180 days. For the Somme at Abbeville (Fig. 8), the ob-served riverflows vary above 90 m3s−1for about 3 months. These variations correspond to a high frequency signal with a period of about 2 weeks that are due to a tidal effect (not shown). Indeed, the connection of the Somme River to the English Channel is controlled by gates in order to prevent the sea water from entering the Somme River during high tides, thus reducing the daily streamflow. As no model takes into account the tide in the routing of the riverflows, it is not surprising that these variations are not reproduced by the models.
SIM better reproduces the observed river high flows during the first 50 days, while MARTHE, MODCOU and the CLSM underestimate the flows by 10 to 30 m3s−1. The results of MARTHE and MODCOU are improved by the large increase
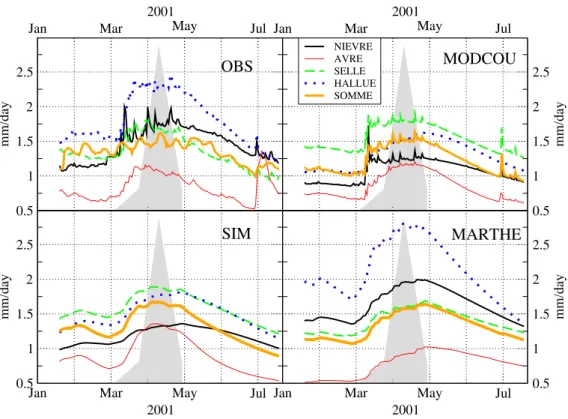
of the simulated flow at the end of March 2001. Such an in-crease is also simulated by SIM (which then tends to overes-timate the riverflow) as well as by the CLSM, at around the same period of time. This increase corresponds to a period of high daily precipitation (Fig. 8). However, there is no such pronounce variation of the observed riverflows at the Somme at Abbeville, although these large precipitations increased the riverflows of the tributaries (Fig. 9). The maximum of the observed flows occurs in mid April and also corresponds to the maximum flooding, as shown by the evolution of the surface computed by using satellite data (cf. Sect. 5.3) plot-ted in grey in Figs. 8 and 9. This maximum is in phase with the maximum riverflows simulated by SIM and MODCOU, and about 15 days earlier than the maximum simulated by MARTHE (except for the Hallue river). This indicates that MARTHE reacts too slowly, which is consistent with the overestimation of the recession flow by this model.
MARTHE is the only model that is able to simulate the dy-namic of the flows of the Hallue river during this period, al-though on the 18-year period, the three models achieved fair results. This probably means that during the high flows, some processes are either not represented or badly represented by SIM and MODCOU.
The performances of the four models during the flood are summarized in Table 4. The efficiencies are rather low and even often negative. There are some errors in the simula-tion of the discharge, but the maximum riverflows are well captured by at least one model for each gage. The CLSM obtained the worst results for the Somme at Abbeville. Over the five gages, MARTHE obtained slightly better results than MODCOU and SIM.
In general, from this section, it can be said that the four models that were calibrated on a long term period encom-passing the flood are not able to reproduce the dynamic of the flood.
5.2 Evolution of the piezometric level
Table 4. Comparison of the observed and simulated riverflows during the flood period: mean discharge ratioQsim/Qobs, daily Efficiency
(E), daily Index of Agreement (IA, Willmot ,1981), Ratio of the simulated over observed maximum riverflow (Rqmax). The return period of
the flood (RPF) is given for each gage. The 7-day statisical results are given in bold for the Somme at Abbeville.
River gages Statistical MARTHE MODCOU SIM CLSM
SOMME at Abbeville Qsim/Qobs 0.98 0.91 0.97 0.75
RPF = 120 years E −0.26(−0.39) −0.65(−0.7) 0.13(0.14) −5.52(−6.2)
IA 0.72(0.71) 0.73(0.74) 0.86(0.87) 0.45(0.43) Rqmax 1.01(1.05) 1.01(1.00) 1.03(1.08) 1.51(1.37)
NIEVRE at Etoiles Qsim/Qobs 1.13 0.74 0.81
RPF>20 years E 0.27 −1.68 −0.63
IA 0.83 0.60 0.64
Rqmax 1.0 0.87 0.68
AVRE at Moreuil Qsim/Qobs 0.94 1.02 1.08
RPF = 85 years E −0.26 0.21 −0.34
IA 0.58 0.78 0.73
Rqmax 0.75 0.89 1.00
SELLE at Plachy Qsim/Qobs 1.04 1.14 1.17
RPF = 20 years E 0.39 0.06 −0.19
IA 0.77 0.77 0.75
Rqmax 0.93 1.05 1.04
HALLUE at Bavelincourt Qsim/Qobs 1.18 0.72 0.84
RPF = 20 years E 0.1 −1.39 0.03
IA 0.84 0.58 0.72
RQmax 1.14 0.66 0.74
2001-02-11 2001-03-13 2001-04-12 2001-05-12 2001-06-11 2001-07-11 2001-02-11 2001-03-13 2001-04-12 2001-05-12 2001-06-11 2001-07-11 0 2001-02-11 2001-03-13 2001-04-12 2001-05-12 2001-06-11 2001-07-11
0 10 20 30
Daily precipitation (mm/day)
2001-02-11 2001-03-13 2001-04-12 2001-05-12 2001-06-11 2001-07-11 50
75 100 125
riverflows (m3/s)
OBS MODCOU SIM MARTHE CLSM 7-day
Jan Mar May Jul 2001
0.5 1 1.5 2 2.5
mm/day
Jan Mar May Jul
2001
0.5 1 1.5 2 2.5
mm/day
NIEVRE AVRE SELLE HALLUE SOMME
Jan Mar May Jul
2001 0.5
1 1.5 2 2.5
mm/day
Jan Mar May Jul
2001
0.5 1 1.5 2 2.5
mm/day
MODCOU
SIM
MARTHE
OBS
Fig. 9. Comparison of the dynamic of the daily riverflow (in mm/day) during the flood period for each gage, observed and simulated by MODCOU, SIM and MARTHE. The flooding area based on satellite images is plotted in grey (cf. Fig. 10 to see the range).
2000-08-052000-08-252000-09-142000-10-042000-10-242000-11-132000-12-032000-12-232001-01-122001-02-012001-02-212001-03-132001-04-022001-04-222001-05-122001-06-012001-06-212001-07-112001-07-312001-08-202001-09-092001-09-292001-10-190
2 4 6 8 10
Flooded area (km^2 )
Average piezometric head on 42 gages
2000-Aug-01 2000-Oct-1458 2001-Jan-12 2001-Apr-12 2001-Jul-11 2001-Oct-09
60 62 64 66 68
Piezometric head (m)
OBS MODCOU SIM MARTHE
Average piezometric head on 42 gages
Fig. 11. Normalized RMSE of the long term simulated piezo-metric level for each observation well (symbols), plotted over the piezometric level simulated in July 2001 (grey scale and isolines) by MARTHE (top), MODCOU (middle) and SIM (bottom)
Thus, there are inconsistencies between comparisons of the simulations with the observed riverflow of the Somme River at Abbeville, on one hand, and between comparisons of the simulated and observed average piezometric level on the 42 observation wells, on the other hand. Firstly, the maximum riverflow simulated by SIM and MODCOU are in phase with the maximum observed riverflow and the max-imum flooding, while their maxmax-imum piezometric levels are 45 days late. Secondly, MARTHE overestimates the piezo-metric level from January 2001 to April 2001, but then un-derestimates the riverflow. Thirdly, MODCOU and SIM overestimate the piezometric level in the period June 2001 to July 2001, while they simulate a riverflow slightly lower than the observed one (Fig. 8). As the major part of the riverflow during the flood is due to exfiltration from the wa-ter table (N´egrel and P´etelet-Giraud, 2005) one would ex-pect that both the simulated riverflows and piezometric lev-els would share similar qualities and flaws with respect to the
observations. However, this is not the case. This means that the average of the 42 piezometric wells does not represent the evolution of the piezometric level where the groundwater contributes to the riverflow. Thus, it is highly likely that the models reproduce the piezometric level better in the valleys than in the plateaus. This is partly shown in Fig. 11 which presents the maps of the piezometric level in July 2001, as well as the normalized RMSE in the 42 observation wells during the whole period. The larger RMSE are generally found in the border of the basin, where the unsaturated zone is deep. The best agreements between the estimated and ob-served piezometric level are most often located closer to a river.
5.3 Flooded areas
The 2001 flooding is considered to be due to the rise in the aquifer level toward the surface, thereby creating several ex-tended sources. The models may be used to check this as-sumption. Moreover, it is also interesting to try to rebuild the evolution of the flood, in order to estimate which parts of the basin were flooded first, and to check whether the models are able to reproduce these phenomena well.
To do so, data from the European Remote Sensing satel-lite (ERS) were used. The work was carried out with 5 radar ERS/SAR images taken on five different dates: 1 March 2001, 17 March 2001, 5 April 2001, 21 April 2001, 10 May 2001, optical SPOT/HRVI (dates 2 April 2001, 25 May 2001, 27 July 2001) and Digital Elevation Model (DEM) data. Absolute calibration of the ASAR images is done in order to transform radar signals (digital numbers) into backscattering coefficients. Both radar and optical im-ages are geo-referenced and superimposed, with a very slight error (the RMSE control point error is about 20 m). The method developed to detect flooded pixels is based on the large decrease in radar signal when the surface is covered with water. In fact, when soil surfaces evolve from satura-tion to flooded, the radar signal, which is highly scattered for humid soils, is more clearly reflected when the surface is cov-ered with water and is consequently less backscattcov-ered. The detection algorithm is first based on four steps: i) Selection of a reference image just before flooding; ii) Application of frost filter to radar images in order to eliminate speckle noise effects; iii) Identification of image pixels presenting a large difference with the reference image. A threshold of 5 dB is empirically chosen; iv) Segmentation of identified pixels in order to retrieve flooded areas.
Flooded urban area
Water detected from satellite
MODCOU overflow
MARTHE Overflow
CLSM saturated
Amiens Abbeville
Fig. 12. Localization of the flooded areas: dark grey: limits of the municipalities comparing flood damage (the towns of Amiens and Abbeville have thick black contours); red: 1 km grid cells covered by water as detected from the ERS data on 21 April 2001 (the limits of the satellite images are shown in red); areas of aquifer overflow as simulated by MARTHE in green and by MODCOU in blue; saturated area simulated by CLSM in yellow.
Partial validation of the detection of flooded areas based on the ERS/SAR images was made using SPOT/HRVI op-tical data taken at three dates (2 April 2001, 25 May 2001, 27 July 2001), using the NDWI index (Gao, 1996), which is very sensitive to the presence of surface water (Guichaoua, 2005). Only the lower part of the Somme basin is treated here (Fig. 12), which represents about 25% of the whole basin.
Four dates are processed in 2001: 1 March, 5 and 21 April, and 10 May. At these dates in the sub domain under study, the surfaces detected as fully covered by water extended over 0.89, 2.71, 9.51 and 2.53 km2. The evolution of the inun-dated areas compares well with the history of the flooding reported by Deneux and Martin (2001). However, the abso-lute values may be underestimated, since the inundated area for the whole basin (i.e. an area about 4 times larger) was estimated to reach 70 km2 (http://www.nord-pas-de-calais. ecologie.gouv.fr/article.php3?id%20article=700top).
Figure 12 shows the domain covered by water detected us-ing satellite images acquired on 21 April (red areas). It also shows the municipalities having declared flood damage (grey areas), as well as the areas where aquifer overflow is simu-lated by MARTHE (green) and MODCOU (blue). As the semi distributed model CLSM is able to simulate a fully dis-tributed estimation of the soil wetness, due to the Topmodel
algorithm, it is also able to estimate the flooded area. Its re-sults are also presented Fig. 12.
There is a good consistency between the areas detected as flooded by using the ERS data and the municipalities that had declared flood damage. At the scale of the entire Somme basin, there is also good coherence between municipalities with flood damage and the areas of aquifer overflow sim-ulated by the models, although the CLSM simulates many saturated spots over the plateaus. The impacted municipal-ities are located either where some overflow is simulated or downstream from these areas.
it can provide some aquifer overflow during the high water season, as pointed out for instance by Eltahir and Yeh (1999) who then noticed that this generates an unlinear variation of the baseflow. Thus, in the simulations, it is the quantity of aquifer overflow that varies every year more than the local-ization of this flow. However, such a result is highly depen-dent on the exact measurement of the ground altitude and the aquifer level.
A sensitivity analysis to the spatial resolution was per-formed by MARTHE by using a constant 500 m grid by com-parison with the reference simulation that uses a 100 m res-olution along the rivers. As expected, the fluxes between the river and the aquifer are reduced at the finest resolution (due to the fact that the area in contact is reduced), but this is balanced by an increase of the aquifer overflow outside the riverbed. This extended aquifer overflow remained mostly located in the main river stream, in the bottom of the val-ley. Thus, the resolution used by hydrologeological models have a significant impact on the localization and quantity of aquifer overflow (within and outside the riverbed).
The models show that most of the flood occurred in the natural flood plain of the Somme. As a consequence and as already underlined by Hubert (2001); Deneux and Mar-tin (2001) and Pointet et al. (2003), the flood damage would have been reduced if there had been fewer constructions in the main river stream, and the duration of the flood could have been reduced if the drainage in this stream had not been disrupted by human development.
6 Discussion and Conclusion
The above findings raise several issues. The inability of the models to accurately reproduce both the riverflows and the piezometric levels during and after the period of high flow is certainly due to the overall simplicity of the models, so the first question is to know which processes are missing in the models. It was shown that the unsaturated zone plays an im-portant role in the Somme basin (cf. Sects. 2 and 4.2). But the processes in this zone are either not taken into account (CLSM) or represented with simple schemes: a percolation function for MARTHE, and a Nash cascade for MODCOU and SIM. Thus, no model is able to take into account a dy-namic change of the unsaturated zone, which could be at least an evolution of its depth according to the piezometric level. Additionally, as mentioned above, the chalk is charac-terized by a dual porosity: matrix porosity and fissure poros-ity, which may lead to a non-linear response of the unsat-urated zone according to its soil water content (Pinault et al., 2005; Price et al., 2000; Lee et al., 2006; Mathias et al., 2006). As the soil water content in the unsaturated zone in-creases to near saturation, some thresholds may be reached, with most of the water transfer occurring in the fissure at a faster speed, which might explain the very fast increase of the piezometric level in some observation wells (Pinault et al.,
2005). This assumption tends to be confirmed by the results obtained in 2007 at the Flood1 experimental site that was set up to understand the processes occurring in the unsaturated zone during floods (http://www.flood1.info/FloodwebFr/ Web/documents/MLuce Amiens 26 09 2007.pdf). How-ever, the simple UZ schemes used in the hydrological models does not take into account such phenomena. Thus, the prob-lem encountered during the flood is not only due to a poor calibration of the parameters, but to the use of an unsaturated model not adapted to the chalk matrix.
Another question that can be addressed by this multi-model comparison is the interest to use complex land sur-face schemes. It was shown (Fig. 3) that the water budget computed by the two LSMs lead to surface fluxes signifi-cantly different from those computed by the simpler PET, P schemes, especially in terms of temporal evolution.
But, as the temporal evolution of the water fluxes is deeply modified by the transfer in the unsaturated and saturated zone, the impact of the surface schemes is mostly hidden by the calibration of the UZ and groundwater parameters. The only exeception is provided by SIM, for which there was no specific calibration, and which shows a larger amplitude of the simulated baseflow, leading to significant differences in the simulated riverflows and piezometric levels, as summa-rized in Tables 2 to 4 and shown in Figs. 4 to 10.
The CLSM is the only model to take into account an inter-active coupling between the saturated zones and the surface. As the water table rises, the surface soil moisture becomes saturated, and the areas where the precipitation cannot infil-trate and thus generate surface runoff increase. However, the areas where the water table is close to the surface (lower than 2 m depth) represent a small fraction of the overall basin, so the impact on the water budget is not very important. This is partly proven by the smooth observed riverflows, which do not react immediately to precipitation.
Thus in the Somme basin, there is no clear benefit in using a more complex surface scheme.
The present study has shown that:
1. The saturated zone is not well represented during flood-ing, partially due to an inaccurate simulation of the fast transfers in the unsaturated zone. The four models use too simplistic unsaturated zone schemes, with no evolu-tion of the UZ depth, and no representaevolu-tion of the fissure flow.
2. The annual cycles of the surface water fluxes simu-lated by simple and complex land surface schemes vary. However, these differences are dampened by the trans-fers in the unsaturated and saturated zones. Therefore, the use of complex land surface scheme is not a require-ment to represent the hydrology of the Somme river basin. However, to simulate the Somme basin, LSMs should either be coupled to hydrogeological models or include the representation of the transfers in the unsat-urated and satunsat-urated zones. This reinforce the need to include deep hydrology in LSMs which are currently increasingly developed (Yeh and Elathir, 2005; Miguez-Macho et al., 2007; Liang et al., 2003; Maxwell and Kollet, 2008).
3. The remote sensing observations of the flooding areas is both useful and complementary to classical in situ hy-drological measurements.
According to these conclusions, studies aiming at the im-provement in MARTHE and MODCOU of the simulation of the water transfer in the Chalk unsaturated zone are in progress by taking into account the fissure flow (Thi´ery et al., 2008) and by integrating a dynamical unsaturated zone depth (Philippe et al., 2009). The application of these de-velopments in the distributed modelling of the Somme basin should help to improve the modelling of the riverflows and piezometric head during the 2001 flood.
Acknowledgements. The authors would like to thank the EC2CO (Ecosph`ere Continentale et Cˆoti`ere) program of the French institute for the Science of the Universe (INSU) for their financial support. They also thank Christophe Courtier from SOGREAH for his explanations and data on the tidal effect on riverflows, and C´edric David from the Texas University at Austin for his help. The authors are grateful to Rodrigo Rojas, P. Yeh, M. Sivapalan and the 2 anonymous reviewers for their helpful comments and advices.
Edited by: M. Sivapalan
The publication of this article is financed by CNRS-INSU.
References
Amraoui, N., Golaz, C., Mardhel, V., Negrel, Ph., Petit, V., Pin-ault, J. L., and Pointet, T.: Simulation par mod`ele des hautes eaux de la Somme, BRGM/RP-51827-FR, http://www.brgm.fr/ publication.jsp, 184 pp., 83 Figs., 11 Tables, 5 Annexes., 2002. Amraoui, N., Thi´ery, D., Wuilleumier, A., and Feret, M. J.: Mod´ele
affin´e de simulation des Hautes Eaux de la Somme, BRGM Rap-port final, 2007.
Amraoui, N., Machard de Gramont, H., Robelin, C., Wuilleumier, A., Noyer, M. L., and Feret, M. J.: Flow process in the unsat-urated Chalk of the Hallue Basin (France), Submitted to First European conference on Unsaturated Soils, July 2008, Durham, UK, 2008.
Benatya, R.: Valorisation des donn´ees SAFRAN, Rapport de fin d’´etude, ENM, M´et´eo France, Toulouse, France, 74 pp., 2004. Beven, K. J. and Kirkby, M. J.: A Physically Based, Variable
Con-tributing Area Model of Basin Hydrology, Hydrol. Sci. Bull., 24, 43–69, 1979.
Beven, K. J. and Freer, J.: Equifinality, data assimilation, and un-certainty estimation in mechanistic modelling of complex envi-ronmental systems: J. Hydrol., 249, 11–29, 2001.
Bo´e, J.: Changement global et cycle hydrologique: Une ´etude de r´egionalisation sur la France, PhD thesis, Universit´e Toulouse III, 2007.
Boone, A., Calvet, J. C., and Noilhan, J.: Inclusion of a Third Soil Layer in a Land Surface Scheme Using the Force-Restore Method, J. App. Meteorology, 3, 11, 1611–1630, 1999. Bradford, B.: Controls on the discharge of Chalk streams of the
Berkshire Downs, UK. Science Tot. Env., 282–283, 65–80, 2002. Carli, M.: Mod´elisation des crues de la Somme `a l’aide du mod`ele hydrologique CaB, Master report, Universit´e Pierre et Marie Curie, Paris, France, 47 pp., 2005.
Crampon, N., Roux, J. C., and Bracq, P.: Hydrogeology of the chalk of north-west Europe. J. Hydrol., 146, 113–151, 1993.
Deneux, M. and Martin, P.: Les inondations de la Somme, ´etablir les causes et les responsabilit´es de ces crues, ´evaluer les coˆuts et pr´evenir les risques d’inondations, Rapport de commission d’enquˆete (2001–2002), rapport du Senat (http://www.senat.fr/ rap/r01-034-1/r01-034-11.pdf), 2001.
Ducharne, A., Koster, R. D., Suarez, M., Stieglitz, M., and Ku-mar, P.: A catchment-based approach to modeling land surface processes in a GCM – Part 2: Parameter estimation and model demonstration, J. Geophys. Res., 105(D20), 24823–24838, 2000. Ducharne, A., Baubion, C., Beaudoin, N., Benoit, M., and Billen, G., and Brisson, N., Garnier, J., Kieken, H., Lebonvallet, S., Ledoux, E., Mary, B., Mignolet, C., Poux, C. Sauboua, E., Schott, C., Th´ery, S., and Viennot, P.: Long term prospective of the Seine River system: Confronting climatic and direct an-thropogenic changes, Sci. Total Environ., 375(1–3), 292–311, doi:10.1016/j.scitotenv.2006.12.011, 2007.
Durand, Y., Brun, E., M`erindol, L., Guyomarc’h, G., Lesaffre, B. and Martin, E.: A meteorological estimation of relevant parame-ters for snow models, Ann. Glaciol., 18, 65–71, 1993.
Eltahir, E. A. B. and Yeh, P. J.-F.: On the asymmetric response of aquifer water level to droughts and floods in Illinois, Water Resour. Res., 35(4), 1199–1217, 1999.
Gascoin, S., Ducharne, A., Carli, M., Ribstein, P., and Habets, F.: Adaptation of catchment-based land surface model to the hydro-geological setting of the Somme River basin (France), J. Hydrol., 368(1–4), 105–116, doi:10.1016/j.jhydrol.2009.01.039, 2009. Gao, B.: NDWI a normalized difference water index for remote
sensing of vegetation liquid water from space, Remote Sen. En-viron., 58, 257–266, 1996.
Goody, D. C., Darling, W. G., Abesser, C., and Lapworth, D. J.: Us-ing chlorofluorocarbons (CFCs) and sulphur hexafluoride (SF6) to characterise groundwater movement and residence time in a lowland Chalk catchment, J. Hydrol., 330, 44–52, 2006. Guichaoua, M.: Application hydrologique des capteurs “radar;”
ASAR-ENVISAT et SAR-ERS, Master report, 59 pp., 2005 (in French).
Gupta, H. V., Sorooshian, S., and Yapo, P. O.: Towards improved calibration of hydrologic models: multiple and incommensu-rable measures of information, Water Resourc. Res., 34, 751– 763, 1998.
Habets, F., Etchevers, P., Golaz, C., Leblois, E., Ledoux, E., Martin, E., Noilhan, J., and Ottl´e, C: Simulation of the water budget and the river flows of the Rhone basin, J. Geophys. Res., 104, 31145– 31172, 1999.
Habets, F., Boone, A., Champeaux, J. L., Etchevers, P., Fran-chist´eguy, L., Leblois, E. Ledoux, E., Le Moigne, P., Mar-tin, E., Morel, S., Noilhan, J., Quintana-Segui, P.,
Rousset-Regimbeau F., and Viennot, P.: The SIM
hydrometeoro-logical model over France, J. Geoph. Res., 113, D06113, doi:10.1029/2007JD008548, 2008.
Headworth, H. G.: The analysis of natural groundwater level fluc-tuations in the Chalk of Hampshire, J. Inst. Water Eng., 24, 107– 124, 1972.
Hubert, P.: Rapport sur la crue et les inondations de la
vall´ee de la Somme de Mars `a Mai 2001, available at: http://pjy.hubert.free.fr/res/res01-22.pdf, 2001.
Ireson, A. M., Wheater, H. S., Butler, A. P., Mathias, S. A., Finch, J., and Cooper, J. D.: Hydrological processes in the Chalk un-saturated zone. Insights from an intensive field monitoring pro-gramme, J. Hydrol., 330, 29–43, 2006.
Jackson, B. M., Wheater, H. S., Mathias, S. A., McIntyre, N., and Butler, A. P.: A simple model of variable residence time flow and nutrient transport in the chalk, J. Hydrol., 330(1–2), 221– 234, doi:10.1016/j.jhydrol.2006.04.045, 2006.
Korkmaz, S., Ledoux, E., and ¨Onder, H.: Application of the
cou-pled model to the Somme river basin, J. Hydrol., 3661–4, 21–34, doi:10,1016/j.hydrol.2008.12.008, 2009.
Koster, R. D. and Suarez, M.: Modeling the land surface bound-ary in climate models as a composite of independant vegetation stands, J. Geophys. Res., 97(D3), 2697–2715, 1992.
Koster, R. D., Suarez, M., Ducharne, A., Stieglitz, M., and Kumar, P.: A catchment-based approach to modeling land surface pro-cesses in a GCM – Part 1: Model structure, J. Geophys. Res., 105(D20), 24809–24822, 2000.
Leblois E.: De l’hydrologie avec le SIG raster Idrisi. Rapport tech-nique, Ecole Nationale du G´enie Rural des Eaux et Forts, Lyon, 75 pp., 1993.
Leblois, E. and Sauquet, E.: Grid elevation models in hydrology Part 1: Principles and a literature review; Part 2: HydroDem, Users manual. Cemagref, Technical Notes, Lyon, 80 pp., 2000.
Ledoux, E., Girard, G., De Marsily, G., and Deschenes, J.: Spa-tially distributed modeling: Conceptual approach, coupling sur-face water and ground-water, in Unsaturated flow hydrologic modeling: theory and practice, edited by: Morel-Seytoux, H. J., NATO Sciences Service, 435–454, 1989.
Ledoux, E., Gomez, E., Monget, J. M., Viavatt`ene, C., Viennot, P., Ducharne, A., Benoit, M., Mignolet, C., Schott, C., and Mary, B.: Agriculture and groundwater nitrate contamination in the Seine basin. The STICS-MODCOU modelling chain, Science Tot. Env., 375(1–3), 33–47, 2007.
Lee, L. J., Lawrence, D. S. L., and Price, M.: Analysis of water-level response to rainfall and implications for recharge pathways in the Chalk aquifer, SE England, J. Hydrol., 330, 604–620, 2006.
Le H´egarat-Mascle, S., Zribi, M., Alem, F., and Weisse, A.: Soil moisture estimation from ERS/SAR data: Toward an opera-tional methodology, IEEE T. Geosci. Remote, 40(12), 2647– 2658, 2002.
Liang, X., Xie, Z., Huang, M.: A new parameterization for ground-water and surface ground-water interactions and its impact on ground-water budgets with the VIC land surface model, J. Geophys. Res., 108(D16), 8613, doi: 10.1029/2002JD003090, 2003.
Mahmood-ul-Hassan, M. and Gregory, P. J.: Dynamics of water movement on Chalkland, J. Hydrol., 257(1–4), 27–41, 2002. Masson, V., Champeaux, J.-L., Chauvin, F., Meriguet, C., and
La-caze, R: A Global Database of Land Surface Parameters at 1-km Resolution in Meteorological and Climate Models, J. Climate, 16(9), 1261–1282, 2003.
Mathias, S. A., Butler, A. P., Jackson, B. M., and Weather, H. S.: Transient simulations of flow and transport in the Chalk unsatu-rated zone, J. Hydrol., 330, 10–28, 2006.
Maxwell, R. M. and Kollet, S. J.: Interdependence of groundwater dynamics and land-energy feedbacks under climate change, Nat. Geosci., 1, 865–869, 2008.
Milly, P. C. D. and Wetherald, R. T.: Macroscale water fluxes, 3, Ef-fects of land processes on variability of monthly river discharge, Water Resour. Res., 38(11), 1235, doi:10.1029/2001WR000761, 2002.
Miguez-Macho, G., Fan, Y., Weaver, C. P., Walko, R., and Robock, A.: Incorporating water table dynamics in climate modeling: 2. Formulation, validation, and soil moisture simulation, J. Geo-phys. Res., 112, D13108, doi:10.1029/2006JD008112, 2007. Nash, J.: A unit hydrograph study with particular reference to
British catchments, Proc. Inst. Civil. Eng., 17, 249–282, 1960. Nash, J. and Sutcliffe, J.: River forecasting using conceptual
mod-els, 1. A discussion of principles, J. Hydrol., 10(3), 282–290, 1970.
N´egrel, P. and P´etelet-Giraud, E.: Strontium isotopes as tracers of groundwater-induced floods: the Somme case study (France), J. Hydrol., 305(1–4), 99–119, 2005.
Noilhan, J. and Planton, S., A simple parameterization of Land Sur-face Processes for meteorological Models, Mon. Weather Rev., 117, 536–549, 1989.
Pinault, J.-L., Amraoui, N., and Golaz, C.: Groundwater-induced flooding in macropore-dominated hydrological system in the context of climate changes, Water Resour. Res., 41, W05001, doi:10.1029/2004WR003169, 2005.
Philippe. E., Habets. F., Goblet. P, and Ledoux, E.: Improvement of nitrate transfer modelling in a drainage basin: consideration of water table fluctuations in the unsaturated zone, 16th Nitrogen Workshop, Turin, 2009.
Pointet, T., Amraoui, N., Golaz, C., Mardhel, V., N´egrel, P., Pen-nequin, D., Pinault, J-L.: Contribution of groundwaters to the exceptional flood of the Somme River in 2001 Observations, as-sumptions, modelling, La Houille Blanche, 6, 112–122, 2003. Price, M., Low, R. G., and MacCann, C.: Mechanisms of water
storage and flow in the unsaturated zone of the Chalk aquifer, J. Hydrol., 233, 54–71, 2000.
Quintana-Segu`ı, P., LeMoigne, P., Durand, Y., Martin, E., Habets, F., Baillon, M., Franchisteguy, L. , Morel, S., and Noilhan, J.: The SAFRAN atmospheric analysis: Description and validation, J. Appl. Meteorol. Clim., 47, 92–107, 2008.
Rousset, F., Habets, F., Gomez, E., Le Moigne, P., Morel, S., Noilhan, J., and Ledoux, E.: Hydrometeorological modeling of the Seine basin using the SAFRAN-ISBA-MODCOU system, J. Geophys. Res., 109(D14), D14105, doi:10.1029/2003JD004403, 2004.
Thi´ery, D., Amraoui, N., Wuilleumier, A., Chr´etien, P., and Noyer, M. L.: Analysis & modelling of groundwater floods in fractured Chalk following extreme rainfall events. Groundwater and Ex-treme Events meeting, Geological Society, London (UK), 2008.
Thi´ery, D. and Amraoui, N.: Hydrological modelling of the Saone basin. Sensitivity to the soil model. Phys. Chem. Earth. Pt. B, 26(5–6), 467–472, 2001.
Thi´ery, D.: Mod´elisation des aquif`eres complexes - Prise en compte de la zone non satur´ee et de la salinit´e. Calcul des intervalles de confiance. Revue Hydrog´eologie, 4, 325–336, 1993.
Thi´ery, D.: Logiciel MARTHE. Mod´elisation d’Aquif`ere par un maillage Rectangulaire en r´egime Transitoire pour le calcul hydrodynamique des ´ecoulements, version 4.3, BRGM report, 4S/EAU R32210 1990, 1990.
Thi´ery, D.: Logiciel GARD ´ENIA version 6.0 - Guide d’utilisation,
In French (GARD ´ENIA software release 6.0 User’s guide),
BRGM report, RP-52832-FR, 102 pp., 42 Figs., 2003.
Thirel, G., Rousset-Regimbeau, F., Martin, E., and Habets, F.: On the impact of short range meteorological forecasts for Ensemble Streamflow Predictions, J. Hydrometeo, 9, 1301–1317, 2008. Willmot, C. J.: On the validation of models, Phys. Geog., 2, 184–
194, 1981.