www.jped.com.br
ORIGINAL
ARTICLE
Comparison
of
body
composition
and
adipokine
levels
between
thin
and
normal-weight
prepubertal
children
夽
Jadwiga
Ambroszkiewicz
a,∗,
Joanna
Gajewska
a,
Katarzyna
Szamotulska
b,
Gra˙
zyna
Rowicka
c,
Witold
Klemarczyk
c,
Magdalena
Chełchowska
aaInstituteofMotherandChild,ScreeningDepartment,Warsaw,Poland
bInstituteofMotherandChild,DepartmentofEpidemiologyandBiostatistics,Warsaw,Poland cInstituteofMotherandChild,DepartmentofNutrition,Warsaw,Poland
Received24June2016;accepted8November2016 Availableonline1February2017
KEYWORDS
Leptin; Adipomectin; Bodycomposition; Thinness;
Children
Abstract
Objective: Thinness can have substantial consequences for child development and health. Adipokines,includingleptinandadiponectin,playasignificantroleintheregulationof impor-tantmetabolicfunctions.Theaimofthisstudywastoinvestigateassociationsbetweenbody compositionandserumleptinandadiponectinlevelsinthinandnormal-weightchildren.
Methods: Theauthorsexamined100healthyprepubertalchildren,whoweredividedintotwo subgroups:thin(n=50)andnormal-weightchildren (n=50).Body compositionwas assessed bydual-energyX-rayabsorptiometry.Serumconcentrationsofadipokinesweredeterminedby immunoenzymaticassays.
Results: Thinchildrenhadasimilarbodyheightbutsignificantlylower(p<0.0001)bodyweight, bodymassindex,fatmass,leanmass,andbonemineralcontentcomparedwithnormal-weight children.Serumconcentrationsofleptinwereabout2-foldlower(p<0.0001)inthinvs. normal-weightsubjects.Serumlevelsoftotaladiponectin,adiponectinmultimers,andsolubleleptin receptor (sOB-R) were similar in bothgroups. The leptin/soluble leptin receptorratio and leptin/adiponectinratioswerelower(p<0.0001)inthinvs.normal-weightchildren.Inboth groupsofchildren,itwasfoundthatbodycompositionparameterswerepositivelyrelatedwith leptinbutnotwithadiponectinlevels.Additionally,bonemineralcontentwaspositivelyrelated withbodymassindex,fatmass,leanmass,andleptinlevelinthinandnormal-weightchildren.
夽
Pleasecitethisarticleas:AmbroszkiewiczJ,GajewskaJ,SzamotulskaK,RowickaG,KlemarczykW,ChełchowskaM.Comparisonofbody
compositionandadipokinelevelsbetweenthinandnormal-weightprepubertalchildren.JPediatr(RioJ).2017;93:428---35.
∗Correspondingauthor.
E-mail:[email protected](J.Ambroszkiewicz). http://dx.doi.org/10.1016/j.jped.2016.11.004
Conclusions: Prepubertalthinchildren havedisturbancesinbodycompositionandadipokine profile.Earlyrecognitionofthinnessanddeterminationofbodycompositionparametersand adipokinelevelscanbeusefulinmedicalandnutritionalcareofthinchildrenforthe optimiza-tionofbonemineralaccrual.
©2017SociedadeBrasileiradePediatria.PublishedbyElsevierEditoraLtda.Thisisanopen accessarticleundertheCCBY-NC-NDlicense(http://creativecommons.org/licenses/by-nc-nd/ 4.0/).
PALAVRAS-CHAVE
Leptina; Adiponectina; Composic¸ãocorporal; Magreza;
Crianc¸as
Comparac¸ãodacomposic¸ãocorporaledosníveisdeadipocinaentrecrianc¸as
pré-púberesmagrasecompesonormal
Resumo
Objetivo: A magrezapodeterconsequênciassubstanciaisparaodesenvolvimentoeasaúde dascrianc¸as.Asadipocinas,incluindoaleptinaeaadiponectina,desempenhamumpapel sig-nificativonaregulac¸ãodeimportantesfunc¸õesmetabólicas.Oobjetivodoestudofoiinvestigar asassociac¸õesentreacomposic¸ãocorporaleosníveisséricosdeleptinaeadiponectinaem crianc¸asmagrasecompesonormal.
Métodos: Examinamos100crianc¸aspré-púberessaudáveis,queforamdivididasemdois subgru-pos:crianc¸asmagras(n=50)ecompesonormal(n=50).Acomposic¸ãocorporalfoiavaliadapelo métododeabsorciometriadeduplaenergiaderaios-X.Asconcentrac¸õesséricasdasadipocinas foramdeterminadasporensaiosimunoenzimáticos.
Resultados: As crianc¸as magras apresentaram altura semelhante, porém peso corporal (p<0.0001), índice de massa corporal (IMC), massa gorda, massa magra e conteúdo min-eralósseo(CMO)significativamentemenoresemcomparac¸ãoacrianc¸ascompesonormal.As concentrac¸õesséricasdeleptinaforamaproximadamente2vezesmaisbaixas(p<0.0001)em indivíduosmagrosqueemcrianc¸ascompesonormal.Osníveisséricosdeadiponectinatotal, multímerosdeadiponectinaereceptordeleptinasolúvel(sOB-R)foramsemelhantesemambos osgrupos.Osíndicesdeleptina/sOB-Releptina/adiponectinaforaminferiores(p<0.0001)em crianc¸asmagras quecrianc¸as compesonormal. Em ambososgrupos decrianc¸as, descobri-mosqueosparâmetrosdecomposic¸ãocorporalestavampositivamenterelacionadosàleptina, porémnãoaosníveisdeadiponectina.Alémdisso,observamosqueoCMOestavapositivamente relacionadoaoIMC,massagorda,massamagraeaoníveldeleptinaemcrianc¸asmagrasecom pesonormal.
Conclusões: Ascrianc¸aspré-púberesmagraspossuemalterac¸õesnacomposic¸ãocorporaleno perfildeadipocinas.Oreconhecimentoprecocedamagrezaeadeterminac¸ãodosparâmetrosde composic¸ãocorporaledosníveisdeadipocinapodemserúteisnocuidadomédicoenutricional decrianc¸asmagrasparaotimizac¸ãodoacúmulomineralósseo.
©2017SociedadeBrasileiradePediatria.PublicadoporElsevierEditoraLtda.Este ´eumartigo OpenAccesssobumalicenc¸aCCBY-NC-ND(http://creativecommons.org/licenses/by-nc-nd/4. 0/).
Introduction
Itiswidelyrecognizedthatoverweightandobesityin child-hood shouldbeclosely monitored for publichealth policy reasons.1 However, thereis scant researchexamining the prevalenceofthinnessinearlychildhood,despitepotential negativeconsequencesforhealth anddevelopmentacross thecourseoflife.Themostwidelystudiedindexof nutri-tional status in adults has been body mass index (BMI). However, the definition of thinness is dissimilar between adultsandchildren.TheWorldHealthOrganization(WHO) definesthinnessasBMIlessthanthefifthpercentileofthe reference values for normal-weight children. Coleet al.2 proposedanewgraded definitionofthinness inchildhood andadolescence,basedonpooledinternationaldataforBMI andlinkedtotheWHO-recommendedadultcut-offpoints. TheseinternationalBMIcut-offsallowdistinctionsbetween
differentgradesofthinness:grade1(17to<18.5---mild thin-ness),grade2(16to<17---moderatethinness),andgrade3 (<16---severethinness).
Intheliteraturetherearemanystudies presentingthe prevalenceofchildhoodthinness,includingseverethinness, inlow-income countries.3,4 Thinnesswas alsoobserved in about 7---11% ofJapanese childrenand 5---6% of Australian children,witha higherproportionin girls thanboys.5,6 In developedEuropeancountries,thinnesshasbeen reported torangefrom4.8%to11.9%ingirls,andfrom3.1%to9%in boys,butthisprevalencediffersbyage,sex,andregion.7,8 InPoland,dependingonthestandardused,theprevalence ofthinnesswasdiagnosedinabout6---8%ofboysand9---11% ofgirls.9
life.10 Changesinbodycomposition,especiallyinfatmass anditsdistribution,areassociated withalterations inthe secretionofadipokinesbyadiposetissue.Amongadipokines, leptin and adiponectin are of particular interest due to theiropposingbiologicfunctionsandassociationwithbody weight.Leptinisanadipocyte-derivedhormone,whichplays arolenotonlyinregulatingappetite,reproductive capac-ity,andenergyconsumption,butalsoin bonemetabolism throughitsparacrineorautocrineactiononseveralsystems. Clinical studies have shown that serum leptin concentra-tion is proportional to total body weight and fat mass. Authorshavereportedelevatedserumleptinlevelsin obe-sityandreducedlevelsinconditionsoflowbodyweight.11 Leptin interactsdirectly with the leptin receptor (OB-R), whichinhumansexistsinfourknownisoformswith differ-ent C-terminal cytoplasmaticdomains. The soluble leptin receptor(sOB-R)representsthemainleptin-binding activ-ityin humanblood andmodulates leptinlevelsbybinding free leptin in circulation and preventing hormone degra-dationandclearance.12 Adiponectinisanotherbiologically active adipokine expressed by mature adipocytes. Struc-turally, adiponectin belongs to the collagen superfamily. Itsmonomeric subunits,composed of a C-terminal globu-lar domain, oligomerize to trimers that further associate throughdisulphide bonds withthe collagenous domain to formpolymericcomplexesofahigherstructure(hexamers). Inserum, adiponectincirculates ashighmolecular weight (HMW),mid-molecular weight (MMW), and low molecular weight (LMW) adiponectin. HMW adiponectin appears to be an active form and the HMW/total adiponectin ratio is abetter indicator of metabolic disturbances thantotal adiponectin.13 Adiponectinplaysaroleinmany physiolog-icalprocesses,includingthe metabolismof carbohydrates andfattyacids,insulinresistance,inflammation,andbone metabolism. Studies have shown that serum levels of adiponectininverselycorrelatewithBMI,fatmass,andbone mineraldensityinchildrenandadults.14
Until now, studies regarding body composition and adipokine status have mainly focused on obese patients. Authors have reported hyperleptinemia and hypoad-iponectinemiaassociatedwithincreasedinsulinresistance, diabetes,andmetabolicsyndromeinthesesubjects.15---17As yet,therehavebeenlimitedreportsregardingbody compo-sitionandserumadipokinestatusinthinsubjects,especially inprepubertalchildren.Itisanimportantproblem,because theprevalenceofthinnessamongchildren,especiallygirls, hasincreasedaccordingtodatafromseveralcountries.
Theaimofthepresentstudywas(a)toexaminethe dif-ferencesin bodycomposition andadipokine levels among thin and normal-weight prepubertal children and (b) to investigatethepossibleassociationbetweenthe biochem-ical and anthropometric parameters in these groups of children.
Methods
Thestudyincluded100childrenaged5---10yearsrecruited between January 2014 and November 2015 from a group of consecutive patients seeking dietary counseling in the Department of Nutrition at the Institute of Mother and Child in Warsaw. Children qualified for the study were
generally healthy, well-nourished, without endocrine dis-orders or geneticsyndromes, without diseases that could affect nutritional status, growth, and pubertal develop-ment,andnotrequiringconstantintakeofmedications.All children livedin anurban areain familieswithgood eco-nomicstatusandremainedonamixeddiet.Pubertalstage wasassessedaccordingtotheTanner scale.Children clas-sified asTanner stage 1 were included in this study, but subjectswhoshowedpubertaldevelopmentwereexcluded. AccordingtoCole’sinternationalBMIcut-offpoints,the sub-jectsweredividedintotwogroups:thinchildren(n=50)and normal-weightchildren(n=50).
Thestudywasconductedaccordingtotheprinciplesof theDeclarationofHelsinkiandwasapprovedbytheEthics Committee of the Institute of Mother and Child. Written informedconsentwasobtainedfromallparentsofthe chil-drenbeforetheirparticipationinthestudy.
Anthropometricmeasurementssuchasbodyheightand weightwereperformed.Bodyheightwasmeasuredwitha stadiometer and recorded with a precision of 0.1cm and bodyweightwasassessedunclothedwithacalibrated bal-ancescaletothenearest0.1kg.BMIwascalculatedasbody weight(kg)dividedbyheightsquared(m2).Body composi-tion(fatmass[FM],leanmass[LM],bonemineralcontent [BMC]) was measured by dual-energy X-ray absorptiome-try (DXA)using the LunarProdigy withpediatric software version 9.30.044 (General Electric Healthcare, WI, USA). Allchildrenweremeasuredbytrainedstaffwiththesame equipment,usingstandardpositioningtechniques.
Venous blood samples were collected in the morning hoursbetween 8:00 and10:00 am afteran overnight fast and centrifuged at 1000g for 10min at 4◦C. Serum sam-ples were stored at −20◦C until biochemical assay, but no longerthan twomonths. Concentrationsof leptin and sOB-R were determined using enzyme-linked immunosor-bent assay (ELISA) kits from DRG Diagnostics (Marburg, Germany). Intra-assay variations (coefficient of variation [CV%])were5.95%and7.10%forleptinandsOB-R, respec-tively.Inter-assayCVswere8.66%and6.21%forleptinand sOB-R,respectively. Serumlevelsof totaladiponectinand its multimers were determined using an ELISA kit from ALPCO (Salem,NH, USA).This assayisdesigned for quan-titativedeterminationoftotaladiponectinaswellasHMW, MMW, and LMW adiponectin. Adiponectin multimers were selectively measured aftersample pretreatment withtwo proteasesthat specificallydigested thetrimericforms,or boththehexamericandtrimericforms.Usingthismethod, bothtotalandHMWadiponectinweredetermineddirectly, but MMW adiponectin was calculated by subtracting the concentration of HMW from the concentration of com-bined MMW+HMW adiponectin and LMW adiponectin by subtractingtheconcentrationofcombinedMMW+HMWfrom total adiponectin. In this assay, the detection limit was 0.019ng/mL,intra-assayCVswere5.4%fortotaladiponectin and 5.0% for HMWadiponectin, andinter-assay variations were5.0%and5.7%fortotalandHMWadiponectin, respec-tively.
Table1 Children’scharacteristicsandanthropometry.
Thinchildren
n=50
Normal-weightchildren
n=50
p-Value
Earlylifecharacteristics
Child’ssex(male/female) 25/25 26/24 0.841
Birthweight(g)a 3123±569 3316±652 0.160
Maternalage(years)b 30(27---32) 29(25---31) 0.134
Gestationalage(weeks)b 40(38---40) 40(38---40) 0.663
Apgarscoreb 10(9---10) 10(10---10) 0.113
Characteristicsatenrollment
Age(years)b 6.9(6.0---8.0) 6.9(5.1---8.9) 0.614
Bodyweight(kg)a 19.8±4.6 24.7±6.5 <0.001
Bodyheight(cm)a 120.3±11.7 123.3±12.3 0.215
BMI(kg/m2)a 13.5±0.6 16.0±1.5 <0.001
BMIz-scoreb −1.29(−1.43to−1.10) −0.12(−0.56to0.28) <0.001
Fatmass(%)a 18.3
±6.3 21.3±6.4 0.021
Fatmass(kg)a 3.16±1.12 5.21±2.72 <0.001
Leanmass(kg)a 14.7
±4.4 18.2±4.1 <0.001
TotalBMC(kg)a 0.63±0.24 0.84±0.24 <0.001
SpinalBMC(kg)a 0.05±0.02 0.07±0.02 <0.001
FM/LMa 0.23±0.10 0.28±0.11 0.018
DatawereanalyzedusingaStudent’st-testorthebMann---Whitneytestandpresentedasameanvalues±SD,orbmediansandinterquartile
ranges(25---75thpercentiles).
BMI,bodymassindex;BMC,bonemineralcontent;FM,fatmass;LM,leanmass.
data or medians and interquartile ranges (25---75th per-centiles) for skewed distribution.Group differences were assessedusingStudent’st-testortheMann---WhitneyUtest, asappropriate.Differencesinanthropometricand biochem-icalparametersbetweenchildrenwiththinnessgrades1---3 were assessed by exact Jonckheere---Tentra test (p-value fortrend).Multivariateregressionanalyseswereperformed withBMC,leptin(expressedasnaturallogarithm[ln]),and adiponectin as dependent variables, and anthropometric andbiochemicalparameterswereselectedasindependent variables(separatemodelsadjustedforageandsex)inthin andnormal-weightgroups.Ap-valuelessthan0.05was con-sideredsignificantforallanalyses.
Results
Data on the children’s characteristics and anthropome-try are presented in Table 1. The studied children were generallyhealthy.Therewasnodifferenceinearlylife char-acteristics,suchasmaternalage,gestationalage,orApgar score.Thinchildrenhadaslightlylowerbirthweightthan normal-weightchildren,butthisdifferencewasnot statis-ticallysignificant. Thinchildrendidnotdifferinage,sex, orheightcomparedwithnormal-weightchildren.However, thinsubjectshadsignificantlylower(p<0.001)bodyweight, BMI,fat mass,and leanmass.The median valuesof total BMCandspineBMCweredecreased(p<0.001)inthegroup of thin children comparedwiththe normal-weight group. Additionally,theratioofFM/LMwasalsolower(p<0.05)in thinsubjects.
Regarding adipokine levels, a more than 2-fold lower serumleptin level was found in thin children vs. normal-weightpeers(Table2).Inthetwostudiedgroups,therewere
nodifferencesin total adiponectinconcentrations and its multimers(HMW,MMW,andLMW)aswellassOB-R. Addition-ally,thepercentageofHMWadiponectintototaladiponectin wascomparableinthinandnormal-weightchildren.Hence, theratiosofleptintosOB-Randleptintototaladiponectin weresignificantlylower(p<0.0001)inthinchildren.
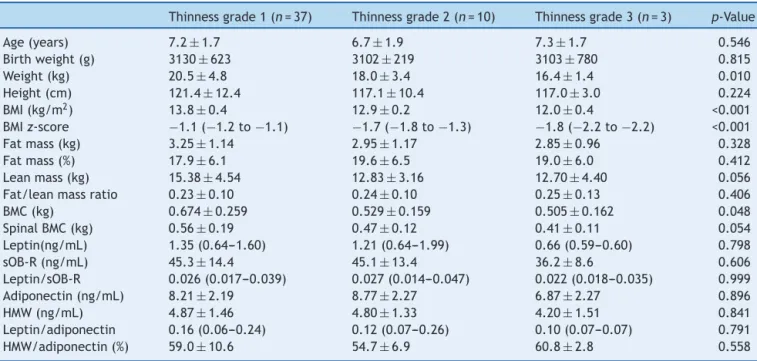
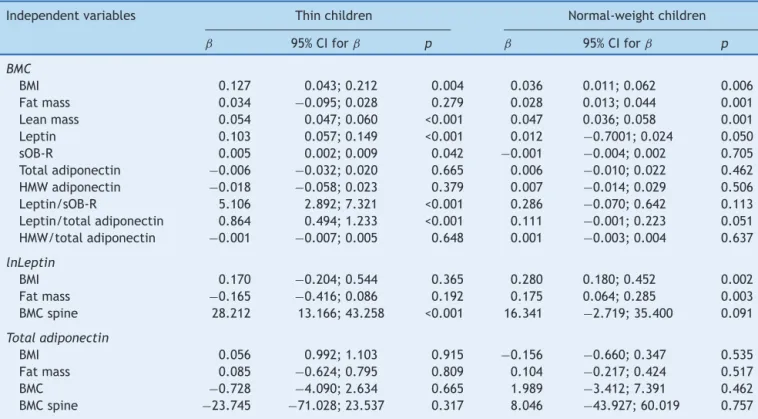
According to Cole’s cut-off points, thin children were classifiedintothreesubgroups:grade1(74%),grade2(20%), andgrade3(6%).Significantdifferencesinweight(p<0.01), BMI(p<0.001),BMIz-score(p<0.001),BMC(p<0.05),lean mass(p=0.056),andspinalBMC(p=0.054)wereobserved amongthesubgroups(grades1---3)ofthinchildren(Table3). In multivariante regression analyses, BMC was signifi-cantlycorrelatedwithBMI(p<0.01),leanmass(p<0.001), leptin(<0.001),andOB-R(p<0.05)inthinchildrenandwith BMI(p<0.01), fat mass (p<0.001), lean mass (p<0.001), and leptin (p=0.05) in normal-weight subjects (Table 4). SerumleptinlevelwashighlycorrelatedwithBMC(p<0.001) and spinal BMC (p<0.001) in thin subjects, whereas, in thenormal-weightgroup,arelationshipwasfoundbetween leptin and BMI (p<0.01), fat mass (p<0.01), and BMC (p=0.05). No correlations were observed between serum levelsofadiponectinand bodycompositionparametersin bothgroupsofchildren.
Discussion
Table2 Serumconcentrationsofadipokinesingroupsofthinandnormal-weightchildren.
Thinchildren
n=50
Normal-weightchildren
n=50
p-Value
Leptin(ng/mL)b 1.33(0.65---1.62) 3.06(1.60---5.18) <0.001
sOB-R(ng/mL)a 44.69±13.88 45.47±14.62 0.786
Totaladiponectin(ng/mL)a 8.24±2.21 8.46±2.47 0.647
HMWadiponectin(ng/mL)a 4.81±1.42 5.05±1.97 0.486
MMWadiponectin(ng/mL)a 1.74±1.01 2.00±1.21 0.239
LMWadiponectin(ng/mL)a 1.51±0.84 1.33±0.96 0.320
Leptin/sOB-Rb 0.03(0.02---0.04) 0.08(0.03---0.14) <0.001
Leptin/adiponectinb 0.15(0.07---0.24) 0.39(0.19---0.61) <0.001
HMW/totaladiponectin(%)a 58.25±9.74 58.52±11.92 0.903
DatawereanalyzedusingaStudent’st-testorthebMann---Whitneytestandpresentedasameanvalues±SD,orbmediansandinterquartile
ranges(25---75thpercentiles).
sOB-R,solubleleptinreceptor;HMW,highmolecularweight;MMW,mid-molecularweight;LMW,lowmolecularweight.
establishedasapredictoroflowbonemineralcontentand a risk factor for fracture. There are only a few reports assessingbodycompositioninthinhealthychildren.20---22
In the present study, differences in body composition wereobservedregardinglowerfatmass,leanmass,andthe ratioof fat mass to leanmass in thinchildren compared withnormal-weightpeers.Similartotheseresults,aclinical studyconductedinAustraliademonstratedthatthinschool childrenwere less muscular, weaker,and less activethan theirnormal-weightpeers.20 Theseauthorssuggestedthat suchchildrenmayhavearangeofsignificant health prob-lems,including lower skeletal mass and increased risk of osteoporosis in laterlife. In the present study’sthin sub-jects,lowermedianvaluesoftotalBMCwerefound,aswell asspinalBMCcomparedwithnormal-weightchildren.Inthis groupofchildren,BMCwaspositivelycorrelatedwithBMI,
leanmass,serumleptinlevel, serumsOB-Rlevel, ratioof leptintosOB-R,andratioofleptintototaladiponectin.Also, Pietrobellietal.21reportedthatfatmassandleanmasswere independentlyassociatedwithbonemineralcontentin chil-dren andadolescents.Vaitkeviciuteetal.,22 in agroup of underweightboys,observedsignificantlylowerbodymass, fatmass,leanmass,andBMCcomparedwithnormal-weight boys. These authors suggested that thinness in childhood indicated a greaterchance of lowerbone mineraldensity in the future. The present study’s results as well as the observationsfromotherstudiessupportthehypothesisthat in thinchildren therearealterations in bodycomposition andthatacloseassociationexistsbetweenbody composi-tionandbonemineraldensity.Moreover,bonestatusduring childhoodmightbeastrongpredictorofbonestatusinyoung adulthood,whenpeakbonemassisachieved.
Table3 Comparisonofanthropometricandbiochemicalparametersinthesubgroupsofthinchildren(grades1---3).
Thinnessgrade1(n=37) Thinnessgrade2(n=10) Thinnessgrade3(n=3) p-Value
Age(years) 7.2±1.7 6.7±1.9 7.3±1.7 0.546
Birthweight(g) 3130±623 3102±219 3103±780 0.815
Weight(kg) 20.5±4.8 18.0±3.4 16.4±1.4 0.010
Height(cm) 121.4±12.4 117.1±10.4 117.0±3.0 0.224
BMI(kg/m2) 13.8
±0.4 12.9±0.2 12.0±0.4 <0.001
BMIz-score −1.1(−1.2to−1.1) −1.7(−1.8to−1.3) −1.8(−2.2to−2.2) <0.001
Fatmass(kg) 3.25±1.14 2.95±1.17 2.85±0.96 0.328
Fatmass(%) 17.9±6.1 19.6±6.5 19.0±6.0 0.412
Leanmass(kg) 15.38±4.54 12.83±3.16 12.70±4.40 0.056
Fat/leanmassratio 0.23±0.10 0.24±0.10 0.25±0.13 0.406
BMC(kg) 0.674±0.259 0.529±0.159 0.505±0.162 0.048
SpinalBMC(kg) 0.56±0.19 0.47±0.12 0.41±0.11 0.054
Leptin(ng/mL) 1.35(0.64---1.60) 1.21(0.64---1.99) 0.66(0.59---0.60) 0.798
sOB-R(ng/mL) 45.3±14.4 45.1±13.4 36.2±8.6 0.606
Leptin/sOB-R 0.026(0.017---0.039) 0.027(0.014---0.047) 0.022(0.018---0.035) 0.999
Adiponectin(ng/mL) 8.21±2.19 8.77±2.27 6.87±2.27 0.896
HMW(ng/mL) 4.87±1.46 4.80±1.33 4.20±1.51 0.841
Leptin/adiponectin 0.16(0.06---0.24) 0.12(0.07---0.26) 0.10(0.07---0.07) 0.791
HMW/adiponectin(%) 59.0±10.6 54.7±6.9 60.8±2.8 0.558
Datawereanalyzed using theJonckheere---Terpstraexact test(pfortrend) and presentedasmean values±SDoras mediansand
interquartileranges(25---75thpercentiles),accordingtoprevioustables.
Table4 MultivariateregressionwithBMC,leptin,andtotaladiponectinasdependentvariablesandselectedanthropometric andbiochemicalparametersastheindependentvariables(separatemodelsadjustedforageandsex).
Independentvariables Thinchildren Normal-weightchildren
ˇ 95%CIforˇ p ˇ 95%CIforˇ p
BMC
BMI 0.127 0.043;0.212 0.004 0.036 0.011;0.062 0.006
Fatmass 0.034 −0.095;0.028 0.279 0.028 0.013;0.044 0.001
Leanmass 0.054 0.047;0.060 <0.001 0.047 0.036;0.058 0.001
Leptin 0.103 0.057;0.149 <0.001 0.012 −0.7001;0.024 0.050
sOB-R 0.005 0.002;0.009 0.042 −0.001 −0.004;0.002 0.705
Totaladiponectin −0.006 −0.032;0.020 0.665 0.006 −0.010;0.022 0.462 HMWadiponectin −0.018 −0.058;0.023 0.379 0.007 −0.014;0.029 0.506
Leptin/sOB-R 5.106 2.892;7.321 <0.001 0.286 −0.070;0.642 0.113
Leptin/totaladiponectin 0.864 0.494;1.233 <0.001 0.111 −0.001;0.223 0.051 HMW/totaladiponectin −0.001 −0.007;0.005 0.648 0.001 −0.003;0.004 0.637
lnLeptin
BMI 0.170 −0.204;0.544 0.365 0.280 0.180;0.452 0.002
Fatmass −0.165 −0.416;0.086 0.192 0.175 0.064;0.285 0.003
BMCspine 28.212 13.166;43.258 <0.001 16.341 −2.719;35.400 0.091
Totaladiponectin
BMI 0.056 0.992;1.103 0.915 −0.156 −0.660;0.347 0.535
Fatmass 0.085 −0.624;0.795 0.809 0.104 −0.217;0.424 0.517
BMC −0.728 −4.090;2.634 0.665 1.989 −3.412;7.391 0.462
BMCspine −23.745 −71.028;23.537 0.317 8.046 −43.927;60.019 0.757
BMI,bodymassindex;BMC,bonemineralcontent;sOB-R,solubleleptinreceptor;HMW,highmolecularweightadiponectin;CI,confidence
interval;leptinisexpressedasln,naturallogarithm.
Recent advances from basic and clinical studies con-firm the important role of adipokines in many metabolic processes.23Amongthem,leptinandadiponectinareunique hormones because their levels reflect the degree of fat accrual and they appear to be pleiotropic mediators. Changesinadipokinelevelsalsomodulatebonemetabolism. Numerousstudieshaveshownleptinandadiponectin secre-torydynamicsacrosstheweightspectrumandtheauthors have concludedthatthe profile ofadipokines inlean and obesesubjectsisdifferent.11,24
There are scantreports about adipokine status in thin healthysubjects.Ebertetal.25observedsignificantlyhigher serum levels of adiponectin and resistin and lower con-centrationsofleptininleanhealthyadultscomparedwith overweight/obese subjects. However, Moscavitch et al.26 reportedcomparable adiponectinlevels inlean and over-weight subjects. These results support the notion that severaladipokinesmightberegulatedinadifferentmanner inleanadultscomparedwithoverweightorobesesubjects and patientswith eatingdisorders.As yet, in thin prepu-bertal children, the assessment of serum adipokines and their interrelations withbody composition have not been ascertainedindetail.Studiesonadiponectinmultimersare especiallyscarce.
Inthegroupofthinchildren,thepresentstudyobserved significantlylowerserumleptinlevelsthaninnormal-weight children,andsimilarconcentrationsoftotaladiponectinas well asadiponectinmultimers in both groups ofchildren. Hence,theratiosofleptintoOB-Randleptintoadiponectin were significantly lower in thin subjects. Similarly,
Martos-Morenoetal.27 foundsignificantlylower concentra-tionsofleptinandcomparablevaluesoftotaladiponectin andHMWadiponectinin thinprepubertalSpanishchildren
vs. controls. In addition, Murdolo et al.28 analyzed pre-pubertal Italian children and observed that leptin levels increasedprogressively from thinto overweight children. Additionally, the authors reportedcomparable concentra-tionsof totaladiponectinin leanandobese subjects,but alsoatendencytowarddecreasedlevelsofHMWadiponectin in obese subjects. They suggested that leptin and the leptin/HMW adiponectin ratio differed between lean and overweightindividuals,andwassignificantlyhigherinthose withadiposity.These studies as well asthe present work showedthat adipokine profiles were different in children withvariousBMIs.Notably,leptin,ratherthanadiponectin, emerges as a marker of the degree of adiposity in the young thinpopulation. As expected,a significant positive associationwasdemonstratedbetweenserumleptinlevels andanthropometricparametersinthinandnormal-weight children.However,nocorrelationswereobservedbetween adiponectinlevelsandbodycompositionparametersinboth groups of children. Other researchers alsofound positive correlations between leptin levels and body composition parametersinadultsandinchildren,andsuggestedastrong association offat mass withleptin at everyage, which is consistent with the notion that leptin acts asa signal of adiposity.29
statusandriskofthinness.8,30 Inthepresentgroupof chil-drentherewerenosignificant differencesinbirthweight, Apgarscore,gestationalage,ormaternalageatbirth.The thinchildrenwerehealthy,without malnutritionor eating disorders, and almost 75% were classified as having mild thinness.
Thisstudyhadafewpotentiallimitations.First,the sam-plesizewasrelatively small(especiallyafter dividingthe participantsintosubgroupsaccordingtogradeofthinness), whichlackssufficientpowertodetectmoderateassociations with statistical significance. However, the studied group washomogeneous;all childrenwere Caucasian, compara-bleinageandsex, living inan urbanarea.Second, there waslackof detailednutritionaland physical activitydata forthe studiedchildren, butthesechildren werehealthy, without eating disorders, and remained on a traditional mixeddiet.Third,only leptinand adiponectin concentra-tionsweredetected;otheradipokineswerenotmeasured. However,theauthorsareplanningtodetermineresistin, vis-fatin,andapelininthinchildren.Additionally,notonlytotal adiponectinconcentrationsweredetermined,butalsoHMW, MMW,andLMWmultimersofadiponectin.
In conclusion,thesefindings demonstrate thatasearly asinprepubertalage,thinchildrenexhibitadifferentbody compositionandpatternof adipokines,withmajor differ-encesinleptinlevels.DecreasedBMCmight beassociated withlowerserumleptin levelsandtheproportionsof lep-tintoadiponectininthinchildren.Earlyrecognitionofboth underweight andoverweight youthandthe accompanying consequences on bone metabolism are important for the optimizationofbonemineralaccrualandpreventionofbone loss.Itissuggestedthatmonitoringofbodycompositionand adipokine status can be useful in medical andnutritional careofthinchildrentopreventhealthrisksandreducesome diseasesinlaterlife.
Conflicts
of
interest
Theauthorsdeclarenoconflictsofinterest.
Acknowledgments
The authors thank the staff of the Department of Inter-nalMedicine,Endocrinology,andDiabetologyattheCentral ClinicalHospitaloftheMinistryoftheInteriorinWarsawfor theirhelpinDXAmeasurements.
References
1.deOnisM.Preventingchildhoodoverweightandobesity.J Pedi-atr(RioJ).2015;91:105---7.
2.ColeTJ,FlegalKM,NichollsD,JacksonAA.Bodymassindexcut offstodefinethinnessinchildrenandadolescents:international survey.BMJ.2007;335:194.
3.Monyeki MA,Awotidebe A, StrydomGL,de RidderJH, Mam-abolo RL, Kemper HC. The challenges of underweight and overweightinSouthAfricanchildren:arewewinningorlosing thebattle.Asystematicreview.IntJEnvironResPublicHealth. 2015;12:1156---73.
4.PohBK,WongJE,NorimahAK,DeurenbergP.Differencesinbody buildinchildrenofdifferentethnicgroupsandtheirimpacton
theprevalenceofstunting,thinness,overweight,andobesity. FoodNutrBull.2016;37:3---13.
5.ShirasawaT,OchiaiH,NanriH,NishimuraR,OhtsuT,Hoshino H,etal.Trendsofunderweightandoverweight/obesityamong Japaneseschoolchildren from2003 to2012,definedbybody massindex andpercentage overweightcutoffs.JEpidemiol. 2015;25:482---8.
6.CliffordSA,GoldL,Mensah FK,Jansen PW,LucasN, Nichol-sonJM,et al.Health-care costsofunderweight, overweight andobesity:Australianpopulation-basedstudy.JPaediatrChild Health.2015;51:1199---206.
7.Rosati P, Triunfo S, Zucchetti F, Gorca C, Chini R, Cam-pana R. Screening of obesity, overweight and thinness in a childrenpopulationinRome,Italy.MinervaPediatr.2014;66: 201---7.
8.PearceA,RougeauxE,LawC.Disadvantagedchildrenatgreater relativeriskofthinness(aswellasobesity):asecondarydata analysisoftheEnglandNationalChildMeasurementProgramme and the UK Millennium Cohort Study. Int J Equity Health. 2015;14:61.
9.Grajda A, KułagaZ, Gurzkowska B,Napieralska E,Litwin M. Regionaldifferencesintheprevalenceofoverweight,obesity andunderweightamongpolishchildrenandadolescents.Med WiekuRozwoj.2011;15:258---65.
10.BialoSR,GordonCM.Underweight,overweight,andpediatric bonefragility:impactandmanagement.CurrOsteoporosRep. 2014;12:319---28.
11.BaskaranC,EddyKT,MillerKK,MeenaghanE,MisraM,Lawson EA.Leptinsecretorydynamicsandassociateddisorderedeating psychopathologyacrosstheweightspectrum.EurJEndocrinol. 2016;174:503---12.
12.SchaabM,KratzschJ.Thesolubleleptinreceptor.BestPract ResClinEndocrinolMetab.2015;29:661---70.
13.ArakiS,DobashiK,KuboK,AsayamaK,ShirahataA.High molec-ularweight,ratherthantotal,adiponectinlevelsbetterreflect metabolicabnormalities associatedwithchildhoodobesity. J ClinEndocrinolMetab.2006;91:5113---6.
14.MatherKJ,GoldbergRB.Clinicaluseofadiponectinasamarker of metabolic dysregulation. Best Pract Res Clin Endocrinol Metab.2014;28:107---17.
15.GroeneveldMP,Huang-DoranI,SempleRK.Adiponectinand lep-tininhumansevereinsulinresistance---diagnosticutilityand biologicalinsights.Biochimie.2012;94:2172---9.
16.RedondoMJ,RodriguezLM,HaymondMW,HampeCS,SmithEO, BalasubramanyamA,etal.Serumadiposity-inducedbiomarkers inobeseandleanchildrenwithrecentlydiagnosedautoimmune type1diabetes.PediatrDiabetes.2014;15:543---9.
17.Falahi E, Khalkhali Rad AH, Roosta S. What is the best biomarkerfor metabolicsyndrome diagnosis.DiabetesMetab Syndr.2015;9:366---72.
18.FajeA,KlibanskiA.Bodycompositionandskeletalhealth:too heavy?Toothin?CurrOsteoporosRep.2012;10:208---16.
19.MisraM,KatzmanDK,CordJ,ManningSJ,MendesN,Herzog DB,etal.Bonemetabolisminadolescentboyswithanorexia nervosa.JClinEndocrinolMetab.2008;93:3029---36.
20.O’Dea JA, Amy NK. Perceived and desired weight, weight relatedeatingandexercisingbehaviours,andadvicereceived fromparentsamongthin,overweight,obeseornormalweight Australianchildrenandadolescents.IntJBehavNutrPhysAct. 2011;8:68.
21.Pietrobelli A, Faith MS, Wang J, Brambilla P, Chiumello G, HeymsfieldSB. Association oflean tissue and fat mass with bonemineralcontentinchildrenandadolescents.Obes Res. 2002;10:56---60.
23.KawaiM,dePaulaFJ,RosenCJ.Newinsightsintoosteoporosis: thebone-fatconnection.JInternMed.2012;272:317---29.
24.MisraM,KlibanskiA.Endocrineconsequencesofanorexia ner-vosa.LancetDiabetesEndocrinol.2014;2:581---92.
25.EbertT,RothI,RichterJ,TönjesA,KralischS,LossnerU,etal. Differentassociationsofadipokinesinleanandhealthyadults. HormMetabRes.2014;46:41---7.
26.MoscavitchSD,KangHC,FilhoRA,MesquitaET,NetoHC,Rosa ML.Comparisonofadipokinesinacross-sectionalstudywith healthyoverweight,insulin-sensitiveandhealthylean, insulin-resistantsubjects, assisted bya family doctor primary care program.DiabetolMetabSyndr.2016;8:9.
27.Martos-MorenoGÁ,KratzschJ,KörnerA,BarriosV,HawkinsF, KiessW,etal.Serumvisfatinandvaspinlevelsinprepubertal
children: effect of obesity and weight loss after behavior modificationsontheirsecretionandrelationshipwithglucose metabolism.IntJObes(Lond).2011;35:1355---62.
28.MurdoloG, NowotnyB,CeliF,DonatiM,BiniV,PapiF,etal. Inflammatoryadipokines, highmolecular weightadiponectin, andinsulinresistance:apopulation-basedsurveyinprepubertal schoolchildren.PLoSONE.2011;6:e17264.
29.SchoppenS,RiestraP,García-AnguitaA,López-SimónL,Cano B,de OyaI,etal. Leptinandadiponectin levelsinpubertal children:relationshipwithanthropometricvariablesandbody composition.ClinChemLabMed.2010;48:707---11.