Authors
Marcia Regina Gianotti Franco 1
Fernando Antonio Basile Colugnati 1
Abdul Rashid Qureshi 2
José Carolino Divino--Filho 2
Natália Maria da Silva Fernandes 1
1 Universidade Federal de
Juiz de Fora.
2 Renal Medicine, CLINTEC,
Karolinska Institute, Stockholm, Sweden.
Submitted on: 6/3/2016. Approved on: 10/5/2016.
Correspondence to:
Natália Maria Da Silva Fernandes.
Universidade Federal de Juiz de Fora.
Rua Jamil Altaf, 132, Vale do Ipê, Juiz de Fora, MG, Brazil. CEP: 36035 380
E-mail: nataliafernandes02@ gmail.com
The impact of body mass index (BMI) variation on mortality
of incident elderly patients on peritoneal dialysis: a joint
model analysis
O impacto da variação do índice de massa corporal (IMC) na
mortalidade de pacientes idosos incidentes em diálise peritoneal
Introdução: Dados sobre o impacto do índice de massa corporal (IMC) sobre mortalidade de pacientes em diálise peritoneal (DP), espe-cialmente entre os idosos, são inconsistentes.
Objetivo: Avaliar o impacto do IMC sobre a mortalidade de coorte de pacientes incidentes idosos em DP ao longo do tempo. Métodos:
Estudo de coorte prospectivo multicêntrico (dezembro de 2004 a outubro de 2007), com 674 pacientes. Avaliados dados sociodemo-gráficos, clínicos e pacientes acompanhados até morte, transferência para hemodiálise (HD), recuperação da função renal, perda de seguimento ou transplante. Pacientes foram divididos em incidentes em terapia renal subs-titutiva por PD (230) e transferidos da hemo-diálise (444). A análise foi feita comparando estes dois grupos usando Qui-Quadrado ou Kruskal Wallis. Análise semelhante foi utili-zada para comparar os pacientes em diálise peritoneal automatizada vs. diálise perito-neal ambulatorial contínua. Os dados foram comparados entre pacientes de acordo com o IMC por ANOVA, Kruskal Wallis ou Qui--Quadrado. Para análise de sobrevivência, método de Kaplan Meier foi utilizado e, para ajustar variáveis confundidoras, usada regres-são de Cox. Um modelo conjunto para dados longitudinais tempo-dependente foi utilizado, avaliando o impacto de variações longitudi-nais sobre a sobrevida. Resultados: Pacientes desnutridos (76,79 ± 7,53 anos), eram mais velhos (p < 0,0001) e apresentaram maior mortalidade (44,6%, p = 0,001). Diabetes mellitus foi mais prevalente em obesos (68%,
p < 0,0001); níveis mais elevados de pressão arterial (p = 0,002) também foram mais fre-quentes em obesos e com sobrepeso. Conclu-são: A variação positiva do IMC ao longo do tempo provou ser um fator de proteção, com uma diminuição de cerca de 1% no risco de morte por unidade de elevação do IMC.
R
ESUMOPalavras-chave: índice de massa corporal; idoso; diálise peritoneal.
Introduction: Data on impact of high body mass index (BMI) on mortality of patients on peritoneal dialysis (PD), especially among elderly, are inconsistent. Objective: To evaluate impact of BMI on cohort of incident elderly PD patients over time. Me-thods: Prospective multicenter cohort study (December / 2004-October/2007) with 674 patients. Socio-demographic and clinical data evaluated with patients followed until death, transfer to hemodialysis (HD), reco-very of renal function, loss of follow-up or transplant. Patients were divided into inci-dent on renal replacement therapy (RRT) for PD (PD first: 230) and transferred from hemodialysis (HD first: 444). Analysis was performed comparing these two groups using chi-square or Kruskal Wallis. Simi-lar analysis was used to compare patients on automated peritoneal dialysis (APD) vs. continuous ambulatory peritoneal dialysis (CAPD). Data were compared between patients according to BMI by ANOVA, Kruskal Wallis or chi-square. For analy-sis of survival, Kaplan Meier method was used and to adjust confounding variables, Cox regression proportional hazard. Joint model for longitudinal and time-dependent data was conducted, assessing impact that a longitudinal variable displays on time of survival. Results: Malnourished pa-tients (76.79 ± 7.53 years) were older (p
< 0.0001) with higher percentage of dea-th (44.6%, p = 0.001); diabetes mellitus
showed high prevalence in obese patients (68%, p < 0.0001); higher blood pressu-re levels (p = 0.002) were present in obese and overweight patients. Conclusions: In-creased BMI variation over time proved to be a protective factor, with a decrease of about 1% in risk of death for every BMI unit earned.
A
BSTRACTKeywords: body mass index; aged; perito-neal dialysis.
I
NTRODUCTIONThe increase in life expectancy evidenced by the world’s population in recent decades has brought as a consequence a higher prevalence of diabetes mel-litus (DM), hypertension and chronic kidney disease (CKD), frequent non-transmissible diseases among the elderly.1
This is one of the reasons for the significant in-crease in the incidence of elderly patients (≥ 65 years) on renal replacement therapy (RRT) in recent years. As evidenced by the last dialysis survey of the Brazilian Society of Nephrology, 31.4% of dialysis patients in Brazil are elderly.2
Similarly, obesity has reached major proportions globally and is one of the greatest public health chal-lenges in this century, being considered by the World Health Organization (WHO), the epidemic of the 21st century.3 In Brazil this increase was also dramatic es-pecially in patients aged 20 years or older.4
Obesity is known to be associated with the two main causes of CKD, diabetes and hypertension.5 In other words, it can be recognized as a predictor of CKD.6
When considering renal replacement therapy (RRT) for obese patients, several studies show that in hemodialysis (HD), body mass index (BMI) is as-sociated solidly with a lower risk of mortality.7-12 Regarding treatment for peritoneal dialysis (PD), studies on obesity are controversial as to the results, and there is no consensus on the prognosis for this condition.11,13-17
Existing studies in the literature are not longitu-dinal, evaluated BMI only on admission or are not stratified by age being adjusted only in statistical models.14,16,18
PD is a good treatment option for elderly patients because of the well suited benefits it offers for this population.19-22 However, regarding the high BMI found in patients with PD, data inconsistency is a re-ality, particularly in the elderly population.
The aim of this study is to assess the impact of BMI in a cohort of incident elderly PD patients over a period.
M
ETHODSSETTINGANDPATIENTS
Multicenter prospective cohort study, conducted from December 2004 to October 2007, with patients enrolled in the BRAZPD study.23
In this study were included incident PD patients were recruited from 114 dialysis centers treating more than 10 PD patients each and reporting monthly to BRAZPD. Details of the study design and characteris-tics of the cohort are described elsewhere.23 All of the patients were 18 years or older, remained on PD for at least 90 days and provided complete information on body weight and height. This study was conducted in accordance with the Declaration of Helsinki, and all participants provided written informed consent before enrollment.
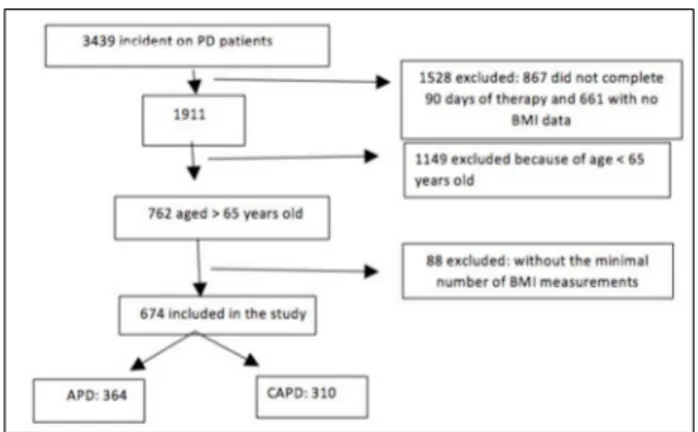
Of the 3439 incident patients enrolled in the BRAZPD, 1.528 patients were excluded (867 for not completing 90 days of therapy and 661 with more than 90 days of therapy but lacking either weight or height data). Of the remaining 1911, 1149 were ex-cluded (age < 65 years) and of the other 762 patients, 88 were excluded (less than two BMI measurements), leaving 674 for analysis (Figure 1).
Figure 1. Flow chart of the study.
DATACOLLECTION
Data were collected monthly from December 2004 through October 2007. Sociodemographic and clini-cal data were evaluated at baseline. Each patient’s medical chart was thoroughly reviewed by nephrolo-gists who extracted data relative to the underlying renal disease, history of cardiovascular disease and other comorbid conditions. The Davies comorbidity score24 was used to assess the severity of comorbid conditions and the Karnofsky status scale25 to classify the functional impairment.
square of the height in meters, was classified according to the World Health Organization (WHO): underweight (< 18.5 kg/m2), normal (18.5 to 24.9 kg/m2), overweight (25 to 29.9 kg/m2) and obese (≥ 30 kg/m2).
Body weight was measured monthly without PD fluid in the abdominal cavity. Laboratory measurements were taken monthly, including creatinine, urea, potassium, cal-cium, phosphate, alanine amino-transferase (ALT), glu-cose, hemoglobin, albumin, total cholesterol, and triglyc-erides, and were determined using routine methods. The patients were followed until they received kidney trans-plants, recovered renal function, were transferred to HD, died, or ended their participation in the study.
STATISTICS
Patients were divided into those who were incident on renal replacement therapy (RRT) for PD (PD first: 230) patients and those who came transferred from hemodi-alysis (HD first: 444). Data are described as mean ± SD, median or percentage depending on the characteristic of the variable. An analysis comparing the two groups (PD first vs. HD first) was conducted using the chi-square test or Kruskal Wallis was conducted. A similar analysis was used to compare patients in APD vs. CAPD.
Demographic and clinical data were compared among the patients, who were divided according to BMI (defined by WHO), by ANOVA, Kruskal Wallis or chi-square. Survival analysis was performed using the Kaplan Meier method, and Cox regression proportional hazard analy-sis was used to adjust for confounding variables. Survival was also analyzed according to the evolution of BMI in the follow-up period.
Finally, a joint model for longitudinal data and time to event was conducted in order to effectively assess the impact that a longitudinal variable presents on time in an event of interest, in this case, survival. Joint models as-sesses both longitudinal and survival data assuming that both processes share the same random effects, which can reduce the bias and improve accuracy when compared to simpler approaches.
This approach includes separate models for each form of data using standard tools for time-dependent covari-ates in a survival model. It was also adjusted for other covariates such as age, gender, Davies score, first ther-apy and type of therther-apy. For parameter estimation, the Hermmit-Gauss quadrature technique was performed in order to evaluate the cumulative risk. Software STATA 13 was used. A confidence interval of 95% and p < 0.05 was considered.
R
ESULTSThe study evaluated 674 incident elderly PD patients treated by APD (n = 364) or CAPD (n = 310), who start-ed dialysis between December 2004 and October 2007 and were followed until October 2007. Following the classification of WHO classification, BMI at baseline was used to divide patients into four groups: malnourished (n = 56); normal (n = 329); overweight (n = 214) and obese (n = 75).
The mean age was statistically different between groups, showing that malnourished patients (76.79 ± 7.53 years) were older (p = < 0.0001). The female gender
was significantly prevalent in obese patients (65.3%) (p
= 0.014) and follow-up time (12.47 ± 7.73 months) was also higher (p = 0.017) in the group of obese patients. Educational level showed significant statistics (p = 0.002), with more illiterate patients (30.4%) in the malnourished group and more educated (9.3%) in the obese group (Table 1).
There was no difference among the four groups when comparing income, race, distance to dialysis center, pre-dialysis follow up, choice of method, referral or Davies score (Table 1).
Also in Table 1, diabetes mellitus showed a high prev-alence in the obese group (68%, p < 0.0001). In the group of malnourished patients, Karnofsky index greater than 70 occurred in 66.1% of them, a percentage lower than the other groups (p = 0.002). However, this was the group with the highest percentage of death (44.6%, p = 0.001).
Blood pressure levels significantly showed that the highest values of both systolic blood pressure (SBP) (p
= 0.002) and diastolic blood pressure (DBP) (p = 0.002)
are present in the group of overweight and obese patients (Table 1).
Regarding laboratory data, there was statistical differ-ence in calcium levels (p = 0.046) and glucose (p = 0.006), with the highest values present in obese patients (Table 2).
The comparison between patients on APD (n = 364)
vs. on CAPD (n = 310) showed no difference between the two groups when comparing age, gender, income or pre-dialytic care. Regarding race, there was a higher per-centage of whites on APD (73.6% vs. 62.9%, p = 0.01). Educational level was also significant (p = 0.001), show-ing more illiterates on CAPD (19.7% vs. 11.3%) and pa-tients better educated on APD (7.1% vs. 2.9%).
TABLE 1 COMPARISONBETWEENSOCIODEMOGRAPHICANDCLINICALVARIABLESACCORDINGTOBODYMASSINDEXRANGE
Underweight n = 56 Normal n = 329 Overweight n = 214 Obese n = 75 p value
Age (years) 76.79 ± 7.53 75.23 ± 7.04 73.79 ± 6.15 72.36 ± 5.5 < 0.0001
Sex female (%) 58.9 53.8 45.3 65.3 0.014
Race (%) 0.14
White 66.1 67.2 72 68
Black 7.1 9.1 10.3 16
Brown 23.2 20.4 13.6 16
Yellow 3.6 3.3 4.2 0
Income (%): up to two
income 33.9 31.6 28.5 25.3 0.35
Educational level (%) 0.002
Illiterate 30.4 17.3 8.4 13.3
Elementary School 51.8 56.5 66.8 54.7
High School 16.1 22.2 18.2 22.7
College 1.8 4.0 6.5 9.3
Predialysis follow-up (%) 51.8 55 55.6 62.7 0.66
Follow–up (months) 8.5 ± 6.2 10.66 ± 7.03 10.97 ± 7.2 12.47 ± 7.73 0.017
Choice of method (%) 0.45
Medical information 62.5 59 55.6 64
Personal preference 21.4 25.5 21.5 24
Only option 16.1 15.2 22 12
Referral (%)
Clinical 30.4 31.3 32.2 33.3 0.97
Cardiologist 23.2 24.9 24.3 18.7 0.70
Endocrinologist 8.9 7.6 8.9 14.7 0.34
Emergency Unit 21.4 16.7 13.6 16 0.52
Basic Health Unit 8.9 7.6 9.3 6.7 0.84
Others 21.4 16.7 15.4 18.7 0.73
Distance from the center:
up to 25 kms 55.4 61.7 63.1 58.7 0.82
Comorbidities (%)
Diabetes 32.1 44.7 55.1 68 < 0.0001
LVH 42.9 40.4 42.5 40 0.95
Heart Insufficiency 30.4 35.3 31.3 30.7 0.70
PVD 23.2 28.3 30.8 29.3 0.71
Neoplasia 8.9 4.6 5.6 4.0 0.59
Collagenosis 3.6 1.2 0 0 0.04
PD first(230)/HD first (444)
(%) 32.1/67.9 32.5/67.5 35 /65 40/60 0.64
APD/CAPD (364/310) 31/25 172/157 120/94 41/34 0.84
Karnofsky > 70 66.1 75 79 77.2 0.002
Patients with vascular
access (%) 19.6 21.9 20.1 18.7 0.83
Davies score (%) 0.56
0 10.7 13.7 11.2 10.7
1 51.8 42.6 39.3 33.3
2 25 26.1 30.4 34.7
3 12.5 17.6 19.2 21.3
Death (%) 44.6 34 26.2 29.3 0.001
TABLE 2 COMPARISONBETWEENLABORATORYVARIABLESWITHTHEBODYMASSINDEXRANGE
Underweight n = 56
Normal n = 329
Overweight n = 214
Obese
n = 75 p-value
Missing data
S- albumin (g/L) 0.77 484
S-creatinine (mg/dL) 5.58 ± 2.85 6.49 ± 3.20 6.87 ± 5.31 6.71 ± 3.11 0.19 44
S-urea (mg/dL) 107.00 ± 46.74 114.30 ± 46.05 113.91 ± 47.50 107.16 ± 46.24 0.48 3 Hemoglobin (g/L) 10.66 ± 2.04 10.54 ± 3.35 11.21 ± 2.68 10.68 ± 1.81 0.07 3
Phosphate (mg/dL) 4.58 ± 1.77 5.42 ± 11.34 4.78 ± 1.77 5.27 ± 5.31 0.78 3
Calcium (mg/dL) 8.55 ± 2.19 8.18 ± 2.61 8.41 ± 2.14 9.00 ± 1.60 0.046 3
Potassium (mEq/L) 4.34 ± 1.16 4.58 ± 1.08 4.80 ± 1.60 4.56 ± 0.76 0.055 3 ALT (mg/dL) 21.01 ± 13.42 16.93 ± 13.36 18.25 ± 11.43 19.78 ± 15.30 0.084 3
Glucose (mg/dL) 101.85 ± 48.85 119.21 ± 63.87 129.94 ± 78.92 142.23 ± 81.65 0.006 63
Tryglicerides (mg/dL) 125.24 ± 72.71 175.34 ± 101.19 215.85 ± 201.01 181.82 ± 87.48 0.39 565
Total cholesterol (mg/dL) 193.26 ± 49.41 194.27 ± 66.05 185.13 ± 68.99 174.18 ± 47.92 0.077 566
closer (67.3% vs. 54.2%). There was a higher number of patients on CAPD (63.5% vs. 54.7%) because of a medical indication (p < 0.0001) as well as more patients on APD (29.4% vs. 17.1%) by personal preference. As for referrals, patients previously attended by endocrinolo-gists used to prefer APD (11.8%) than CAPD (5.5%) (p
= 0.003). Left ventricular hypertrophy (LVH) was the only comorbidity which showed significant difference be-tween groups (p = 0.011), with patients on CAPD show-ing higher prevalence (46.5% vs. 36.8%).
Regarding level of SBP, there was a statistically signifi-cant difference (p = 0.002), with higher levels for patients on CAPD (142.01 ± 24.89 mmHg vs. 136.10±24.04 mmHg). Regarding DBP, we observed no difference. Follow-up was different, showing patients on APD with longer periods when compared to those on CAPD (11.39 ± 7.55 months vs. 10.6 ± 6.56 months, p = 0.015). Karnofsky index greater than 70 was significant (p = 0.004), showing that patients on APD had poorer perfor-mance (77.8% vs. 76.8%). Concerning APD and CAPD groups, there was no difference in relation to Davies score or death.
As for laboratory variables, there was statistical differ-ence in hemoglobin levels (p = 0.001) and ALT (p = 0.03), both higher for patients on APD (11.13 g / dL ± 3.15 vs.
10.36 g / dL ± 2.57 and 19.01 U /L ± 13.07 vs. 16.84 U /
L ± 12.97, respectively).
We divided patients into two groups, PD first (n = 230) and HD first (n = 444), based on the type of dialysis modality used by the patient at the beginning of the RRT. In this division, pre-dialytic care and follow-up had statis-tically significant differences (p = 0.048 and p < 0.0001, respectively), showing that a higher number of PD first patients had follow-up (61.3% vs. 52.9%) and that this
occurred for a longer period of time (12.18 months ± 7.64 vs. 5.10 ± 6.76 months).
Regarding choice of method, there was also signifi-cant difference (p = 0.0001), with more PD first patients (36.1% vs. 17.3%) as therapy of choice and more HD first patients (22.3% vs. 7.0%) chosen PD as the only re-maining option. As for referrals, only those ones made by endocrinologists showed statistically significant differ-ence (p = 0.001), resulting more frequently in PD first
pa-tients when referred by this specialty (13.9% vs. 6.3%). Karnofsky index greater than 70 was also statistically sig-nificant (p = 0.03), with patients PD first showing higher values (79.9% vs. 75.9%). There was no statistical differ-ence for any other socio-demographic variable.
We did not observe statistically significant differences in the values of laboratory variables, except for a trend (p
= 0.057) for serum creatinine, with higher values for HD first patients (6.81 mg / dL ± 3.9 vs. 9.6 mg / dL ± 5.13).
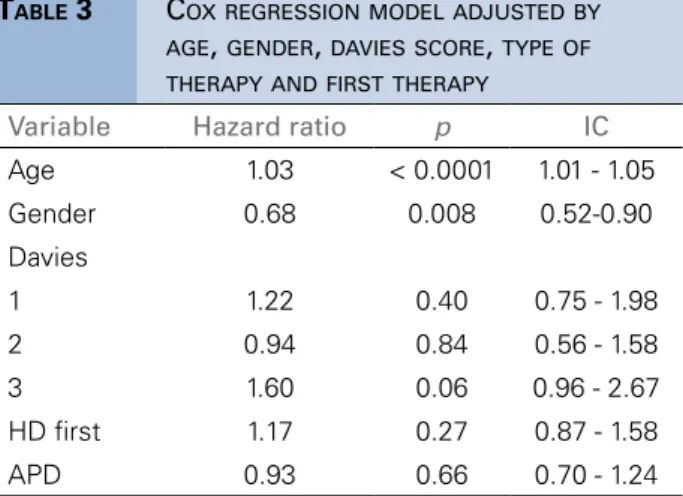
In Table 3, we observe in the Cox model that even after adjustment, the age and BMI, both the intercept and the slope of the curve remained associated with survival, with age as a risk factor and BMI as a protective fator. In the Figure 2 we show the Kaplan Meier curve based in the evolution of BMI. This was confirmed in the joint model (Table 4). The joint parameters, individual BMI intercept and slopes (random effects), provides the grade which body composition affects survival. An increase of one unity in the baseline BMI resulted in decrease of 1% in the risk of death (HR = 0.99, p = 0.02), and an
indi-vidual BMI slope of one unity over the follow-up, in a de-crease of 12% in the risk of death (HR = 0.88, p = 0.01).
TABLE 3 COXREGRESSIONMODELADJUSTEDBY
AGE, GENDER, DAVIESSCORE, TYPEOF THERAPYANDFIRSTTHERAPY
Variable Hazard ratio p IC
Age 1.03 < 0.0001 1.01 - 1.05
Gender 0.68 0.008 0.52-0.90
Davies
1 1.22 0.40 0.75 - 1.98
2 0.94 0.84 0.56 - 1.58
3 1.60 0.06 0.96 - 2.67
HD first 1.17 0.27 0.87 - 1.58
APD 0.93 0.66 0.70 - 1.24
TABLE 4 JOINTMODELOFAGE, GENDER, BODYMASS
INDEX - INTERCEPTANDSLOPE
Variable Hazard ratio p IC
Age 1.03 0.001 1.01 - 1.05 Gender 0.70 0.011 0.53 - 0.92
BMI 0.99 0.021 0.99 - 0.99
Intercept 0.88 0.009 0.80 - 0.96
Slope
in all age groups with similar ability, Santos and Sichieri study26 concluded that among the elderly population they evaluated (n = 699) when compared to the middle-aged population (n = 1306), BMI can be used as indicator of adiposity for this age group, particularly for women.
In addition, a study by Perissinotto et al.27 showed that among older men there is greater loss of lean body mass when compared to women. Goh et al.28 even suggest that BMI should be differentiated by age and ethnicity. A re-cently published study shows that in Brazil, the prevalence of obesity is 12.5% for men and 16.9% for women.29 This fact was also evidenced in our study, which showed more women than men in the group of obese patients.
In developing countries, studies have shown a strong relationship between socioeconomic status and obesity in both men and women.30 This data showed no relevance in a study by de Andrade Bastos et al.31 of the total popu-lation of BRAZPD incident patients when the impact of income and educational level in survival were evaluated. In our study, income was not associated with BMI either, however, when assessing the level of education, we ob-served that contrary to recent systematic review,32 among the malnourished patients, there were more illiterate peo-ple and among those obese and overweight, there was a greater percentage of patients with elementary and high school education.
It is well established that obesity is associated with in-sulin and hyperinin-sulinemia resistance,33 as well as with an increased risk of type 2 diabetes and cardiovascular diseas-es.34 In Brazil, in 2013, VIGITEL (Surveillance of Risk and Protective Factors for Chronic Diseases Telephone Survey) which promotes surveillance of risk and protective factors for chronic diseases through telephone survey around the country, showed increased rates of diabetes in the group of elderly patients (≥ 65 years; 22.1%).35 We found, as ex-pected, high prevalence of diabetes mellitus in the group of obese patients, as well as higher glucose levels.
Excessive weight is a good predictor for the develop-ment of hypertension.36 Indeed, our overweight and obese patients had the highest blood pressure levels, both sys-tolic and diassys-tolic.
When we evaluate Karnofsky index and Davies score, we find that obese patients presented more serious prob-lems although there was no statistical significance. Studies published so far show conflicting results regarding the impact of BMI on survival of PD patients, what may be related in part to the fact that BMI does not distinguish muscle from fat tissue.37
Figure 2. Kaplan-Meier survival curve based on the evolution of body mass index.
In this observational study of a cohort of incident el-derly PD patients held in Brazil, we demonstrated that patients vary widely as to the evolution of BMI. Without a random-effect model, the conclusion reached is: there is no difference in survival between the subgroups evalu-ated. However, when setting models for the evolution of BMI, it is observed that among the elderly who died there was no average gain of BMI, the opposite occurring with those who survived.
It is interesting to observe that factors such as changes due to aging, polypharmacy, chronic diseases, psychoso-cial changes and diet cause a higher risk of malnutrition in the elderly.38 This, in turn, increases the risk of mortal-ity and morbidmortal-ity.38 Similarly, low BMI and muscle mass loss are also associated with morbidity and mortality in patients with chronic kidney disease.39 Our study shows that most malnourished patients were not only older but were also the ones who died more although, paradoxi-cally, the obese presented more serious problems.
It is noteworthy to observe that patients in APD vs.
CAPD were compared and it is found that there is a high-er phigh-ercentage of arthigh-erial hyphigh-ertension and LVH in those patients on CAPD, as well as hemoglobin levels. It is be-yond the scope of this article to compare these methods however, this variable was included as one of the adjust-ment factors in Cox regression models and joint models, with no significant impact on survival. PD first patients were also compared with those who were HD first and in this case, Karnofsky index was better among the PD first patients. Similarly, the dialysis modality PD first vs HD first were included in the adjusted models and showed no impact on survival.
Most studies show that the association between BMI and survival on dialysis is unrelated to age. Indeed, Pellicano et al.40 in a longitudinal study evaluated BMI in HD and PD, stratifying by age and did not observe differ-ences between the groups.
Study done by Hoogeveen et al.14 noted that there may be association between age and long-term survival on dialysis for patients over 65, suggesting that obesity is more associated with mortality for those aged less than 65 years old. In our study, age appears as a risk factor for mortality and BMI does not show worse impact on mortality.
The fact that malnourished patients present higher mortality is consensus in RRT. Malnutrition is recognized as a strong predictor of mortality in patients undergoing PD.41 In fact, when we evaluated the effect of low BMI on survival of these patients, results seem to be more con-vincing, with studies showing that incident PD patients have mortality risk twice as high16 and that there is higher mortality in those who have lower BMI (< 18.5 kg/m2).42 Our study also showed that malnourished patients were the ones who presented higher percentage of death.
Johnson et al.,17 one of the first to examine BMI in relation to mortality in PD, followed 43 prevalent PD patients for 3 years and showed that BMI greater than 27.5 kg/m² was a positive predictor of patient survival. A
recent Brazilian study,42 using the population of BRAZPD, showed in an observational study that high BMI has no impact on mortality over time.
Considering the risk of death in obese patients under-going PD, other studies show decrease,11,43 increase13,14 or no difference.15,16 In our study, despite the limitations caused by the absence of residual renal function and smoking variables, we consider the analysis of BMI a differential since it was shown to be evolutive and time-dependent in the elderly population. We conclude that in-creased BMI variation over time proved to be a protective factor, with a decrease of about 1% in risk of death for every BMI unit in the baseline and 12% for each unity earned.
R
EFERENCES1. Martin LG, Schoeni RF, Andreski PM. Trends in health of older adults in the United States: past, present, future. Demography 2010;47:17-40. DOI: http://dx.doi.org/10.1353/dem.2010.0003 2. Sesso RC, Lopes AA, Thomé FS, Lugon JR, Santos DR. Inquérito
Brasileiro de Diálise Crônica 2013 - Análise das tendências entre 2011 e 2013. J Bras Nefrol 2014;36:476-81. DOI: 10.5935/0101-2800.20140068 DOI: http://dx.doi.org/10.5935/0101-2800.20140068
3. WHO World Health Organization. Obesity: Preventing and managing the global epidemic. Geneva: World Health Organiza-tion.1998. [accessed 2014 Sep 7]. Available from: http://www.who. int/gho/ncd/risk_factors/overweight/en/
4. Sichieri R, do Nascimento S, Coutinho W. The burden of hospital-ization due to overweight and obesity in Brazil. Cad Saude Pública 2007;23:1721-7. DOI: 10.1590/S0102-311X2007000700025 DOI: http://dx.doi.org/10.1590/S0102-311X2007000700025 5. Hall JE, Kuo JJ, da Silva AA, de Paula RB, Liu J, Tallam L.
Obesity-associated hypertension and kidney disease. Curr Opin Nephrol Hypertens 2003;12:195-200. DOI: http://dx.doi. org/10.1097/00041552-200303000-00011
6. Stefan N, Artunc F, Heyne N, Machann J, Schleicher ED, Häring HU. Obesity and renal disease: not all fat is created equal and not all obesity is harmful to the kidneys. Nephrol Dial Transplant 2016;31:726-30. DOI: 10.1093/ndt/gfu081 DOI: http://dx.doi. org/10.1093/ndt/gfu081
7. Degoulet P, Legrain M, Réach I, Aimé F, Devriés C, Rojas P, et al. Mortality risk factors in patients treated by chronic hemo-dialysis. Report of the Diaphane collaborative study. Nephron 1982;31:103-10. DOI: 10.1159/000182627 DOI: http://dx.doi. org/10.1159/000182627
8. Leavey SF, Strawderman RL, Jones CA, Port FK, Held PJ. Simple nutritional indicators as independent predictors of mortality in hemodialysis patients. Am J Kidney Dis 1998;31:997-1006. DOI: http://dx.doi.org/10.1053/ajkd.1998.v31.pm9631845
9. Pifer TB, McCullough KP, Port FK, Goodkin DA, Maroni BJ, Held PJ, et al. Mortality risk in hemodialysis patients and chang-es in nutritional indicators: DOPPS. Kidney Int 2002;62:2238-45. PMID: 12427151 DOI: http://dx.doi.org/10.1046/j.1523-1755.2002.00658.x
10. Kopple JD, Zhu X, Lew NL, Lowrie EG. Body weight-for-height relationships predict mortality in maintenance hemodialysis patients. Kidney Int 1999;56:1136-48. DOI: 10.1046/j.1523-1755.1999.00615.x DOI: http://dx.doi.org/10.1046/j.1523-1755.1999.00615.x
12. Kalantar-Zadeh K, Streja E, Kovesdy CP, Oreopoulos A, Noori N, Jing J, et al. The obesity paradox and mortality associated with surrogates of body size and muscle mass in patients receiving he-modialysis. Mayo Clin Proc 2010;85:991-1001. DOI: 10.4065/ mcp.2010.0336 DOI: http://dx.doi.org/10.4065/mcp.2010.0336 13. McDonald SP, Collins JF, Johnson DW. Obesity is associated with
worse peritoneal dialysis outcomes in the Australia and New Zea-land patient populations. J Am Soc Nephrol 2003;14:2894-901. DOI: 10.1097/01.ASN.0000091587.55159.5F DOI: http://dx.doi. org/10.1097/01.ASN.0000091587.55159.5F
14. Hoogeveen EK, Halbesma N, Rothman KJ, Stijnen T, van Dijk S, Dekker FW, et al.; Netherlands Cooperative Study on the Adequa-cy of Dialysis-2 (NECOSAD) Study Group. Obesity and mortal-ity risk among younger dialysis patients. Clin J Am Soc Nephrol 2012;7:280-8. DOI: 10.2215/CJN.05700611 DOI: http://dx.doi. org/10.2215/CJN.05700611
15. Abbott KC, Glanton CW, Trespalacios FC, Oliver DK, Ortiz MI, Agodoa LY, et al. Body mass index, dialysis modality, and survival: analysis of the United States Renal Data System Dialysis Morbidity and Mortality Wave II Study. Kidney Int 2004;65:597-605. DOI: http://dx.doi.org/10.1111/j.1523-1755.2004.00385.x
16. de Mutsert R, Grootendorst DC, Boeschoten EW, Dekker FW, Krediet RT. Is obesity associated with a survival advantage in pa-tients starting peritoneal dialysis? Contrib Nephrol 2009;163:124-31. DOI: 10.1159/000223790
17. Johnson DW, Herzig KA, Purdie DM, Chang W, Brown AM, Rig-by RJ, et al. Is obesity a favorable prognostic factor in peritoneal dialysis patients? Perit Dial Int 2000;20:715-21.
18. Choi SJ, Kim EJ, Park MY, Kim JK, Hwang SD. Does body fat mass define survival in patients starting peritoneal dialysis? Perit Dial Int 2014;34:376-82. DOI: 10.3747/pdi.2011.00152 DOI: http:// dx.doi.org/10.3747/pdi.2011.00152
19. Ho-dac-Pannekeet MM. PD in the elderly--a challenge for the (pre) dialysis team. Nephrol Dial Transplant 2006:ii60-2. DOI: 10.1093/ ndt/gfl138 DOI: http://dx.doi.org/10.1093/ndt/gfl138
20. Brown EA. Peritoneal dialysis in elderly patients: clinical experience. Perit Dial Int 2005:S88-91. PMID: 16048266
21. McLaughlin K, Jones H, VanderStraeten C, Mills C, Visser M, Taub K, et al. Why do patients choose self-care dialysis? Nephrol Dial Transplant 2008;23:3972-6. DOI: 10.1093/ndt/gfn359 DOI: http://dx.doi.org/10.1093/ndt/gfn359
22. Harris SA, Lamping DL, Brown EA, Constantinovici N; North Thames Dialysis Study (NTDS) Group. Clinical outcomes and qual-ity of life in elderly patients on peritoneal dialysis versus hemodialy-sis. Perit Dial Int 2002;22:463-70.
23. Fernandes N, Bastos MG, Cassi HV, Machado NL, Ribeiro JA, Martins G, et al.; Brazilian Peritoneal Dialysis Multicenter Study. The Brazilian Peritoneal Dialysis Multicenter Study (BRAZPD): characterization of the cohort. Kidney Int Suppl 2008:S145-51. DOI: 10.1038/sj.ki.5002616 DOI: http://dx.doi.org/10.1038/ sj.ki.5002616
24. Davies SJ, Phillips L, Naish PF, Russell GI. Quantifying comor-bidity in peritoneal dialysis patients and its relationship to other predictors of survival. Nephrol Dial Transplant 2002;17:1085-92. DOI: 10.1093/ndt/17.6.1085 DOI: http://dx.doi.org/10.1093/ ndt/17.6.1085
25. Crooks V, Waller S, Smith T, Hahn TJ. The use of the Karnofsky Performance Scale in determining outcomes and risk in geriatric outpatients. J Gerontol 1991;46:M139-44. DOI: http://dx.doi. org/10.1093/geronj/46.4.M139
26. Santos DM, Sichieri R. Índice de massa corporal e indicado-res antropométricos de adiposidade em idosos. Rev Saúde Pública 2005;39:163-8. DOI: http://dx.doi.org/10.1590/S0034-89102005000200004
27. Perissinotto E, Pisent C, Sergi G, Grigoletto F; ILSA Working Group (Italian Longitudinal Study on Ageing). Anthropometric measurements in the elderly: age and gender differences. Br J Nutr 2002;87:177-86. DOI: http://dx.doi.org/10.1079/BJN2001487 28. Goh VH, Tain CF, Tong TY, Mok HP, Wong MT. Are BMI and
other anthropometric measures appropriate as indices for obesity? A study in an Asian population. J Lipid Res 2004;45:1892-8. DOI: 10.1194/jlr.M400159-JLR200 DOI: http://dx.doi.org/10.1194/jlr. M400159-JLR200
29. Mendes LL, Nogueira H, Padez C, Ferrao M, Velasquez-Melendez G. Individual and environmental factors associated for overweight in urban population of Brazil. BMC Public Health 2013;13:988. DOI: 10.1186/1471-2458-13-988 DOI: http://dx.doi.org/10.1186/1471-2458-13-988
30. Sabanayagam C, Shankar A, Wong TY, Saw SM, Foster PJ. Socio-economic status and overweight/obesity in an adult Chinese popu-lation in Singapore. J Epidemiol 2007;17:161-8. DOI: 10.2188/ jea.18.43 DOI: http://dx.doi.org/10.2188/jea.18.43
31. de Andrade Bastos K, Qureshi AR, Lopes AA, Fernandes N, Bar-bosa LM, Pecoits-Filho R, et al.; Brazilian Peritoneal Dialysis Mul-ticenter Study (BRAZPD) Group. Family income and survival in Brazilian Peritoneal Dialysis Multicenter Study Patients (BRAZPD): time to revisit a myth? Clin J Am Soc Nephrol 2011;6:1676-83. DOI: 10.2215/CJN.09041010 DOI: http://dx.doi.org/10.2215/ CJN.09041010
32. Cohen AK, Rai M, Rehkopf DH, Abrams B. Educational attain-ment and obesity: a systematic review. Obes Rev 2013;14:989-1005. DOI: 10.1111/obr.12062. DOI: http://dx.doi.org/10.1111/ obr.12062
33. Pratley RE, Weyer C, Bogardus C. Metabolic abnormalities in the development of noninsulin-dependent diabetes mellitus. In: LeRoith D, Taylor SI, Olefsky JM, eds. Diabetes mellitus. 2nd ed. Philadel-phia: Lippincot-Raven Publishers; 2000. p.548-57.
34. Clinical Guidelines on the Identification, Evaluation, and Treatment of Overweight and Obesity in Adults-The Evidence Report. Nation-al Institutes of HeNation-alth. Obes Res 1998:51S-209S. PMID: 9813653 35. Brasil. Ministério da Saúde. Secretaria de Vigilância em Saúde,
Departamento de Análise de Situação de Saúde. Plano de ações estratégicas para o enfrentamento das doenças crônicas não transmissíveis [DCNT] no Brasil 2011-2022. Brasília: Minis-tério da Saúde; 2011. [cited 2014 Dec 12]. Available from: http://bvsms.saude.gov.br/bvs/publicacoes/plano_acoes_en-frent_dcnt_2011.pdf
36. Hall JE, Crook ED, Jones DW, Wofford MR, Dubbert PM. Mechanis-ms of obesity-associated cardiovascular and renal disease. Am J Med Sci. 2002; 324(3):127–137.
37. Johnson DW. What is the optimal fat mass in peritoneal dialysis pa-tients? Perit Dial Int. 2007;27 Suppl 2:S250-4.
38. Winter JE, MacInnis RJ, Wattanapenpaiboon N, Nowson CA. BMI and all-cause mortality in older adults: a meta-analysis. Am J ClinNu-tr.2014; 99:875-90, http://dx.doi.org/10.3945/ajcn.113.068122. 39. Beddhu S, Pappas L, Ramkumar N, Samore MH. Malnutrition and
atherosclerosis in dialysis patients. J Am Soc Nephrol. 2004; 15:733-42, http://dx.doi.org/ 10.1097/01.ASN.0000113319.57131.28 40. Pellicano R, Strauss BJ, Polkinghome KR, Kerr PG. Longitudinal
Body Composition Changes Due to Dialysis. Clin J Am Soc Nephro. 2011;6(7):1668-75,http://dx.doi.org/10.2215/CJN.06790810 41. CANADA-USA (CANUSA) Peritoneal Dialysis Study Group.
Adequa-cy of dialysis and nutrition in continuous peritoneal dialysis: association with clinical outcome. J Am Soc Nephrol. 1996; 7 (2): 198–207. 42. Fernandes NM, Bastos MG, Franco MR, Chaoubah A, Lima MG,
Divino-Filho JC, et al. Body size and longitudinal body weight chan-ges do not increase mortality in incident peritoneal dialysis patients of the Brazilian peritoneal dialysis multicenter study. Clinics. 2013; 68(1):51-58, http://dx.doi.org/10.6061/clinics/2013 (01)OA08. 43. Johansen KL, Young B, Kaysen GA, Chertow GM Association of