Vocal Parameters of Elderly Female Choir Singers
Fernanda Salvatico de Aquino
1Léslie Piccolotto Ferreira
11Speech Therapy, PUC-SP, São Paulo, São Paulo, Brazil
Int Arch Otorhinolaryngol 2016;20:25–29.
Address for correspondence Fernanda Salvatico de Aquino, MSc, PUC-SP, Rua Inácio Taveira, 18, São Paulo, São Paulo 04658-110, Brazil (e-mail: [email protected]).
Introduction
According to the latest population census of the Brazilian Institute of Geography and Statistics - IBGE released in 2010,1 the number of elderly in Brazil exceeds 20 million, represent-ing 10% of the population. Considerrepresent-ing the demographic changes in emerging countries and in search of better quality of life for the population of senior citizens, it is necessary that new public policies be adopted.2–6
With aging, several changes occur in the body and some of them affect voice production. The expiratory air is critical to vocal production; however, with increasing age, there is a reduction in lung capacity of the individual. The trachea tends to widen, the alveoli and bronchi are dilated, and peribronchial muscles atrophy. The reduction of this elasticity can cause a decrease in expiratory volume, leading to a consequent reduction in maximum phonation time andloudness.7–9
The proper functioning of the mucous glands, responsible for lubricating the vocal folds, tends to decrease over time, a fact that contributes to the vocal wear of the elderly. The speech organs, such as the tongue, lips, and cheeks may also lose the tone due to muscle atrophy and, as a result, cause changes in speech. There are neurological changes that occur in the nervous system, with the decrease in nerve conduction velocity and disability of neurotransmission, which leads the elderly to present articulatory imprecision.2,10
Another aspect to be considered is the ossification of the laryngeal cartilages that occurs as part of the aging process. The thyroid, cricoid, and arytenoid are hyaline cartilages and, therefore, are prone to ossification. The joints (cricothyroid and cricoarytenoid) can erode the surface, with the breakdown of collagenfibers that are manifested in loosening the joint capsule. This process reduces the range of motion of cartilage, damaging the adduction and abduction of the vocal Keywords
►
voice
►
elderly
►
quality of life
Abstract
Introduction
Due to increased life expectancy among the population, studying the
vocal parameters of the elderly is key to promoting vocal health in old age.
Objective
This study aims to analyze the pro
fi
le of the extension of speech of elderly
female choristers, according to age group.
Method
The study counted on the participation of 25 elderly female choristers from
the Choir of Messianic Church of São Paulo, with ages varying between 63 and 82 years,
and an average of 71 years (standard deviation of 5.22). The elders were divided into two
groups: G1 aged 63 to 71 years and G2 aged 72 to 82. We asked that each participant
count from 20 to 30 in weak, medium, strong, and very strong intensities. Their speech
was registered by the software Vocalgrama that allows the evaluation of the pro
fi
le of
speech range. We then submitted the parameters of frequency and intensity to
descriptive analysis, both in minimum and maximum levels, and range of spoken voice.
Results
The average of minimum and maximum frequencies were respectively
134.82
–
349.96 Hz for G1 and 137.28
–
348.59 Hz for G2; the average for minimum
and maximum intensities were respectively 40.28
–
95.50 dB for G1 and 40.63
–
94.35 dB
for G2; the vocal range used in speech was 215.14 Hz for G1 and 211.30 Hz for G2.
Conclusion
The minimum and maximum frequencies, maximum intensity, and vocal
range presented differences in favor of the younger elder group.
received
June 25, 2015
accepted
September 13, 2015
published online
November 25, 2015
DOI http://dx.doi.org/ 10.1055/s-0035-1567875.
ISSN 1809-9777.
Copyright © 2015 by Thieme Publicações Ltda, Rio de Janeiro, Brazil
cords during phonation, a fact that contributes to incomplete glottic coaptation, which reflects in the quality of voice.7,8,10–16
The vocal folds also undergo changes and can present arching signals. In women in the postmenopausal period, the decrease in estrogen hormone results in the imposition of glottal edema, changing the histological composition of the vocal tract mucosa. This histological change is the disorgani-zation of collagenfibers of the deep layer of the vocal folds, making them thicker and decreasing the fundamental frequency of voice.2,3,5,8,10,12,17–22
From this perspective, vocal training is needed for seniors who wish to keep their vocal quality to play an active role in society for a longer time.6,10,11,15,23,24Among the activities considered for vocal training, singing is noteworthy, as it plays an important role in the promotion of vocal welfare.11,24–34
Thus, this study aimed to analyze the vocal parameters of senior female choristers’speech, by age group.
Method
This research, prospective and cross-cutting in nature, was approved by the Research Ethics Committee, under the CAEE number 07252712.7.0000.5482. All participants were informed of the objectives of the study and invited to participate, after agreeing and signing the Term of Consent.
Selection of Subjects
We considered the following criteria for inclusion of the elderly in the study: being female; participating in choirs for at least one year; 60 years old or more, age defining the elderly in developing countries, as proposed by the World Health Organization (WHO) in 2002; being in good health on the day of data collection, according to participant information; not smoking, and, in the case of former smokers, having quit smoking for more than 10 years.
The sample included 25 elderly women who belonged to a Brazilian popular music choir from a religious foundation from São Paulo, aged between 63 and 79 years. They were divided into two groups according to age: Group 1 (G1) composed of 13 seniors aged between 63 and 70 years (mean of 67 and a standard deviation of 2.21) and Group 2 (G2) consisting of 12 elderly aged 72 and 79 years (mean of 75 years and standard deviation of 3.27).
Procedures
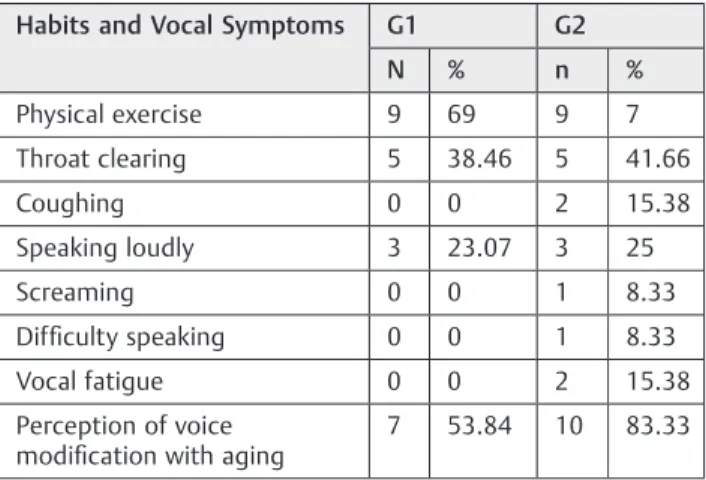
The elderly women were asked about habits and vocal symptoms: hydration, physical exercise, throat clearing, coughing, speak loudly, scream, difficulty to speak, vocal fatigue, and perception of voice modification with aging.
To collect speech samples, we used the Vocalgrama soft-ware version 1.8i (CTS Informática, Pato Branco, Brazil) and the microphone accompanying the Program, positioned at 45° andfive centimeters away from the mouth of the elderly who were sitting in a silent room.
To evaluate the speech extension profile, we asked each elder to count from 20 to 30 in low, medium, strong, and very
strong intensity, as per instructions in the software manual. We captured and projected the speech excerpts on a chart where X is the frequency and Y the intensity.
Data Analysis
We comparatively analyzed responses referring to habits and vocal symptoms, as well as numerical data obtained from the chart provided by the program. We considered the following voice parameters:
• Frequency - average, standard deviation (SD), and variance of the minimum and maximum frequencies produced by seniors in G1 and G2, measured in Hertz (Hz);
• Intensity–average, standard deviation (SD), and variance of the minimum and maximum intensities produced by the seniors in G1 and G2, measured in Decibel (dB); • Vocal range - average, SD, and variance of the vocal range
presented by seniors in G1 and G2, measured in Hertz (Hz);
Results
Habits and Vocal Symptoms
With respect to hydration, we can observe G1 ingests more glasses of water a day than G2 (6.38 and 2.8, respectively). A comparison of other habits and vocal symptoms is shown in►Table 1.
Minimum Frequency
Subjects in G1 had an average minimum frequency of 134.82 Hz (SD 2.90 Hz), ranging from 131.23 to 139.95 Hz, while those in G2 showed an average of 137.28 Hz (6.96 Hz SD), ranging from 131.42 to 157.72 Hz.►Fig. 1represents the dispersion of the values obtained from each of the two elderly groups.
Maximum Frequency
G1 women had an average maximum frequency of 349.96 Hz (DP 37.66 Hz), ranging from 270.7 to 386.18 Hz, while those in G2 showed an average of 348.59 Hz (35.49 Hz DP), ranging
Table 1 Numerical and percentage distribution of habits and vocal symptoms presented by G1 and G2
Habits and Vocal Symptoms G1 G2
N % n %
Physical exercise 9 69 9 7
Throat clearing 5 38.46 5 41.66
Coughing 0 0 2 15.38
Speaking loudly 3 23.07 3 25
Screaming 0 0 1 8.33
Difficulty speaking 0 0 1 8.33
Vocal fatigue 0 0 2 15.38
Perception of voice
modification with aging
from 257.29 and 381.17 Hz.►Fig. 2represents the dispersion of the values obtained from each senior from both groups.
Minimum Intensity
G1 had an average minimum vocal intensity of 40.28 dB (SD 0.44 dB), ranging from 40 to 41.59 dB, while G2 showed an average of 40.63 dB (SD 1.12 dB) ranging from 40.01 to 42.94 dB.►Fig. 3shows the dispersion of the values obtained from each elder of both groups.
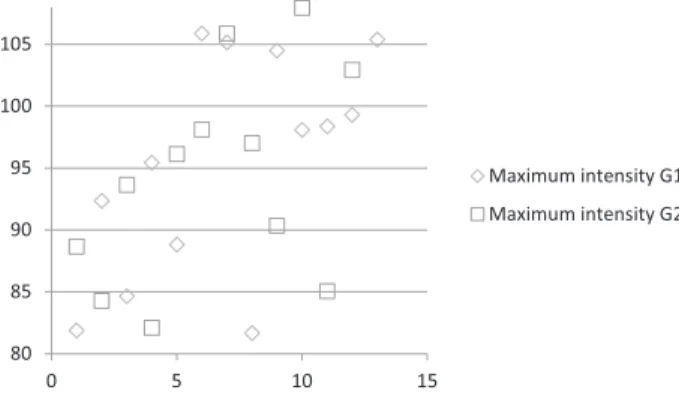
Maximum Intensity
As for maximum vocal intensity, G1 had an average of 95.50 dB (SD 8.9 dB), ranging from 81.68 to 105.89 dB, while
the G2 showed an average of 94.35 dB (DP 8.54 dB) ranging from 82.12 to 107.95 Hz.►Fig. 4shows the dispersion of the values obtained from each elderly of both groups.
Vocal Extension
The G1 had an average extended vocal of 215.14 Hz (DP 37.47 Hz), ranging from 138.11 to 253.48 Hz, while G2 showed an average of 211.30 Hz (34.16 Hz DP), ranging from 125.87 to 244.08 Hz. ►Fig. 5 shows the dispersion of the values obtained from each elderly of both groups.
Discussion
In this study, the groups showed mild limitation in voice modulation capacity of choristers. Thisfinding likely relates to data described in the literature as part of vocal aging.2,3,5,8–22
Based on the average values of the minimum and maximum frequencies produced by the groups, we can infer that G1 has a higher modulation for low and high tone ranges when compared with G2.
This hypothesis is verified based on the highest DP rate shown by G2 minimum frequency, indicating that elderly have difficulty in modulating sound for lower tones during phonation. This process is reversed for maximum frequency and indicates that modulation for acute also reflects signs of 130
135 140 145 150 155 160
0 5 10 15
Maximum frequency G1
Maximum frequency G2
Fig. 2 Dispersion of values obtained for maximum frequency in G1 and G2 elders.
40 40.5 41 41.5 42 42.5 43
0 5 10 15
Minimum intensity G1
Minimum intensity G2
Fig. 3 Dispersion of values obtained for minimum intensity in G1 and G2 elders.
80 85 90 95 100 105
0 5 10 15
Maximum intensity G1
Maximum intensity G2
Fig. 4 Dispersion of values obtained for maximum intensity in G1 and G2 elders.
130 135 140 145 150 155 160
0 5 10 15
Minimum frequency G1
Minimum frequency G2
Fig. 1 Dispersion of values obtained for minimum frequency in G1 and G2 elders.
125 145 165 185 205 225 245
0 5 10 15
Extended Vocal G1
Extended Vocal G2
presbyphonia. Thesefindings, in turn, point in the direction of literature, which postulates difficulties in laryngeal adjustments that are necessary to maintain the melodic line used in speech.7,19
It is noteworthy that, in this sample, two elderly women from G2 stood out: number 1, for introducing a minimum frequency above the most part of the group (►Fig. 1), and number 11, which produced the maximum frequency below of the most part of the group (►Fig. 2). These outliers influence amounts for averages, standard deviations, and variations, resulting in the greatest numerical difference when comparing the groups. However, this data can show the aging intrinsic factor as an individual process encompassing genetic and biopsychosocial features. Therefore, presbyphonia will show varying speed and afflictions, causing different impacts on the quality of life of older people.2,6,23,35,36
The comparison of vocal extension confirms thefindings related to the frequency, and corresponds to the difference between the more acute and severe hue produced by the individual during speech sample collection.19
It is worth noting that the data do not correspond to the fundamental tendency for voice frequency. According to literature, it has a tendency to decrease with increasing age.2,3,5,8,10–12,18–23
If, on one hand, the data confirm the study by Teles-Magalhães et al,19as evidenced by phonetography, showing a limitation in the older seniors in the production of acute tones and a decrease in their vocal range; on the other hand, it suggests an increase in bass production capacity. The expla-nation for this difference may be the use of different analytical devices. The evaluation of the speech extension profile analyzes the frequencies that arise during phonation, elements responsible for the aesthetics of communication through oral language, while phonetography analyzes the frequencies that the individual is able to send outside the context of speech.
The numerical values obtained in the comparison of minimum intensity groups showed no significant differences. The change was most keenly at maximum intensity, suggest-ing a discrete expansion in the dynamic modulation of G1. Although this data are not representative, the literature shows that the vocal intensity changes with aging due to lower subglottic pressure caused by muscle changes in the respiratory system and in the nerve conduction.2,6,9
Although in this study there is no data on the larynx structures of the participants, our findings may corroborate the literature on changes in anatomo-physiological character-istics of aging.10,15,17Pontes et al.10report alterations in glottal closure, presence of spindle-shaped chink, atrophy, and vocal fold bowing due to age. This may justify the variation of the parameters analyzed.
It is also worth highlighting that G1had lower incidence of habits and vocal symptoms considered negative in addition to increased water intake, although physical activity in G2 was higher. These data can relate physical being to vocal well-being and lead to an improvement in the parameters analyzed. Nevertheless, the differences between the groups were not marked. This aspect can be attributed to the practice of choral
singing that would minimize the differences between younger and older elderly due auditory and vocal practice, guidelines related to caring for their voice, and the improvement in the individual’s self-perception provided by musical training.11,24–34
Conclusion
Based on the analysis of spoken voice parameters between two older groups experienced in choir singing, it is possible to observe that the minimum and maximum frequencies, max-imum intensity, and vocal range show slight differences in favor of the younger elderly group.
References
1 IBGE–Instituto Brasileiro de Geografia e Estatística. Available at:
<http://www.ibge.br>. Accessed in May 30. 2013
2 Menezes LN, Vicente LCC. Envelhecimento vocal em idosos institucionalizados. Revista CEFAC 2007;9(1):90–98
3 Mifume E, Justino VSS, Camargo Z, Gregio F. Análise acústica da voz do idoso: caracterização da frequência fundamental. Revista CE-FAC. 2007;9(2):238–247
4 Soares EB, Borba DT, Barbosa TK, Medved DM, Montenegro ACA. Hábitos vocais em dois grupos de idosos. Revista CEFAC. 2007; 9(2):221–227
5 Cerceau JSB, Alves CFT, Gama ACC. Análise acústica da voz de mulheres idosas. Revista CEFAC. 2009;11(1):142–149
6 Gama AC, Alves CF, Cerceau JdaS, Teixeira LC. Correlation between acoustic-perceptual data and voice-related quality of life in elderly women. Pro Fono 2009;21(2):125–130
7 da Silva PT, Master S, Andreoni S, Pontes P, Ramos LR. Acoustic and long-term average spectrum measures to detect vocal aging in women. J Voice 2011;25(4):411–419
8 Boone DR. The singing/acting voice in the mature adult. J Voice 1997;11(2):161–164
9 Hodge FS, Colton RH, Kelley RT. Vocal intensity characteristics in normal and elderly speakers. J Voice 2001;15(4):503–511 10 Pontes P, Brasolotto A, Behlau M. Glottic characteristics and voice
complaint in the elderly. J Voice 2005;19(1):84–94
11 Hazlett D, Ball MJ. An acoustic analysis of the effects of ageing on the trained singer’s voice. Logopedics Phoniatrics Vocology 1996; 21(2):101–107
12 Hagen P, Lyons GD, Nuss DW. Dysphonia in the elderly: diagnosis and management of age-related voice changes. South Med J 1996; 89(2):204–207
13 De Biase NG, Cervantes O, Abrahão M. A voz no idoso. Acta AWHO 1998;17(2):70–72
14 Soyama CK, Espassatempo CL, Gregio FN, Camargo Z. Qualidade vocal na terceira idade: parâmetros acústicos de longo termo de vozes masculinas e femininas, Revista. CEFAC 2005;7(2): 267–279
15 Ahmad K, Yan Y, Bless D. Vocal fold vibratory characteristics of healthy geriatric females—analysis of high-speed digital images. J Voice 2012;26(6):751–759
16 Gregory ND, Chandran S, Lurie D, Sataloff RT. Voice disorders in the elderly. J Voice 2012;26(2):254–258
17 Yamauchi A, Imagawa H, Sakakaibara K, et al. Vocal fold atrophy in a Japanese tertiary medical institute: status quo of the most aged country. J Voice 2014;28(2):231–236
18 Honjo I, Isshiki N. Laryngoscopic and voice characteristics of aged persons. Arch Otolaryngol 1980;106(3):149–150
20 Gorham-Rowan MM, Laures-Gore J. Acoustic-perceptual corre-lates of voice quality in elderly men and women. J Commun Disord 2006;39(3):171–184
21 Gampel D, Karsch UM, Ferreira LP. Envelhecimento, voz e atividade física de professores e não professores, Revista da Sociedade Brasileira de. Fonoaudiologia 2008;13(3):218–225
22 Nishio M, Niimi S. Changes in speaking fundamental frequency characteristics with aging. Folia Phoniatr Logop 2008;60(3):120–127 23 Machado MAMP, Aldrighi JM, Ferreira LP. Os sentidos atribuídos à voz por mulheres após a menopausa. Revista de Saúde Pública 2005;39(2):261–269
24 Prakup B. Acoustic measures of the voices of older singers and nonsingers. J Voice 2012;26(3):341–350
25 Aquino FS. Análise das características da voz falada de mulheres idosas com prática de canto coral [dissertation]. São Paulo: Pontifícia Universidade Católica de São Paulo; 2013
26 Aquino FS, Teles LCS. Autopercepção vocal de coristas profi ssio-nais. Revista CEFAC. 2013;15(4):986–993
27 Barreto TMM, Amorim GO, Trindade Filho EM, Kanashiro CA. Perfil da saúde vocal de cantores amadores de igreja evangélica. Revista da Sociedade Brasileira de Fonoaudiologia 2011;16(2):140–145 28 Fuchs M, Meuret S, Thiel S, Täschner R, Dietz A, Gelbrich G.
Influence of singing activity, age, and sex on voice performance
parameters, on subjects’perception and use of their voice in childhood and adolescence. J Voice 2009;23(2):182–189 29 Camargo TF, Barbosa DA, Teles LCS. Características da fonetografia
em coristas de diferentes classificações vocais. Revista da Socie-dade Brasileira de Fonoaudiologia 2007;12(1):10–17
30 Rocha TF, Amaral FP, Hanayama EM. Extensão vocal de idosos coralistas e não coralistas. Revista CEFAC. 2007;9(2):248–254 31 Cassol M, Bós AJG. Canto coral melhora sintomas vocais em idosos
saudáveis. Rev Bras Cienc Env Hum 2006;3(2):113–122 32 Sonninen A, Hurme P. Vocal fold strain and vocal pitch in singing:
radiographic observations of singers and nonsingers. J Voice 1998; 12(3):274–286
33 Brown WS, Morris RJ, Hollien H, Howell E. Speaking fundamental frequency characteristics as a function of age and professional singing. J Voice 1991;5(4):310–315
34 Brown WS, Morris RJ, Michel JF. Vocal jitter and fundamental frequency characteristics in aged, female professional singers. J Voice 1990;4(2):135–141
35 Costa HO, Matias C. O impacto da voz na qualidade da vida da mulher idosa: Vocal impact on quality of life of elderly female subjects. Rev Bras Otorinolaringol 2005;71(2):172–178