DOI: 10.1590/0004-282X20160112 ARTICLE
Association between clinical condition and
F-waves changes in the acute phase of stroke
Associação entre condição clínica e alterações das ondas-F na fase aguda do acidente
vascular cerebral
Gustavo José Luvizutto1, Marcelo Fernando Zeugner Bertotti1, Thiago Dias Fernandes1, Hélio Rubens de
Carvalho Nunes1, Gabriel Pereira Braga1, Rodrigo Bazan1, Luiz Antônio de Lima Resende1
Stroke often leads to a signiicant decrease in patient qual
-ity of life, yet it has been the subject of few electrophysiological studies1,2. Following the pioneering work of McComas et al.3,
electromyography studies showed that changes in muscle iber density occur during the chronic phase of stroke4,5, and
that positive sharp waves and ibrillation are observed two to three weeks after stroke6,7. However, few studies have used
electrophysiological examinations to evaluate F-wave altera
-tions in the acute phase of stroke.
F-waves are late muscle responses elicited by the iring of antidromically stimulated motor neurons8. F-wave measure
-ments are helpful in evaluating conduction along the entire
length of peripheral motor neuron axons, including the most proximal segment9. Mesrati and Vecchierini10reported that
F-wave changes occur in central nervous system (CNS) dis
-eases, and concluded that F-waves are absent during the acute phase of CNS lesions but persist in the chronic phase in association with spasticity and hyperrelexia. Alterations in F-waves are associated with major severity of the CNS dis
-eases and a poor long-term motor prognosis10.
In the only study that investigated the relationship between level of consciousness and F-waves, it was con
-cluded that F-waves may be useful as an objective measure of the severity of consciousness impairment, but an association
1 Universidade Estadual Paulista, Faculdade de Medicina de Botucatu, Serviço de Neurologia, Botucatu SP, Brasil.
Correspondence: Gustavo José Luvizutto; Departamento de Neurologia, Psicologia e Psiquiatria da Universidade Estadual Paulista, Faculdade de Medicina de Botucatu; Distrito de Rubião Junior, s/n; 18618-970 Botucatu SP, Brasil; E-mail: [email protected]
Conflict of interest: There is no conlict of interest to declare.
Received 14 December 2015; Received in inal form 26 February 2016; Accepted 13 June 2016. ABSTRACT
Objective: To relate F-waves with clinical and laboratory exams in the acute phase of stroke. Methods: Inclusion criteria for this cross-sectional study were: hemiplegia, absence of previous cranial trauma, myopathy, diabetes, alcoholism or other known causes of peripheral neuropathy, and normal sensory and motor conduction. The National Institutes of Health Stroke Scale (NIHSS) score, glycemia, glucosilate hemoglobin, and CPK were obtained at admission by routine blood exams. After hospital admission, the F-wave latencies and persistence were obtained from the deep peroneal nerve using symmetrical techniques. Results: Evaluation of 20 individuals – mean age 66 years, 50% male and 85% Caucasian – showed association of F-wave persistence with glycemia (r = 0.71; p < 0.001) and NIHSS categorized (NIHSS 1-7 = 65.0 x NIHSS 9-23 = 100; p = 0.004). Multivariate analysis found only association of F-wave persistence with glycemia β = 0.59 (0.44–0.74); p < 0.001. Conclusion: The increase in the persistence of F-waves are associated with hyperglycemia in the acute phase of stroke.
Keywords: stroke; brain waves; electrophysiology.
RESUMO
Objetivo: Relacionar as ondas-F com exames clínicos e laboratoriais na fase aguda do acidente vascular cerebral (AVC). Métodos: Os critérios de inclusão para este estudo transversal foram: hemiplegia, ausência de trauma craniano, miopatia, diabetes, alcoolismo ou outra causa conhecida de neuropatia periférica, além de condução sensorial e motora normal. O National Institutes of Health Stroke Scale (NIHSS), glicemia, hemoglobina glicada e CPK foram obtidos na admissão por meio de exames de rotina. Após a admissão hospitalar, a latência e persistência das ondas-F foram obtidas por meio da estimulação do nervo ibular profundo utilizando técnicas simétricas. Resultados: Foram avaliados 20 indivíduos – média de idade 66 anos, 50% homem e 85% caucasianos – apresentaram associação univariada da persistência das ondas-F com glicemia (r = 0.71; p < 0.001) e NIHSS categorizado (NIHSS 1–7 = 65.0 x NIHSS 9-23 = 100; p = 0.004). Na regressão multivariada foi encontrado associação somente entre persistência de ondas-F com glicemia β = 0.59(0.44–0.74); p < 0.001. Conclusão: O aumento da persistência de ondas-F está associado com maior nível de glicemia na fase aguda do AVC.
between the neurological condition and laboratory exam results was not reported8. Given that stroke is a main cause
of chronic incapacity in adults, F-wave alterations in the acute phase of stroke could be important for future prognos
-tic studies. herefore, we hypothesized that the persistence of F-waves correlates with the severity of stroke in the acute phase. he aim of this study was to describe F-wave altera
-tions in the acute phase of stroke and to evaluate their asso
-ciation with clinical and laboratory exam results.
METHODS
Study design, setting and participants
A single-center cross-sectional study was conducted in accordance with the principles of the Declaration of
Helsinki11. Patients were selected following approval of the
study protocol by the Institutional Review Board of the Botucatu Medical School (UNESP). All participants or their legal representatives were aware of the study objectives and provided written informed consent.
he study included 20 individuals with a stroke diagnosis that was conirmed by CT-scan or MRI. he individuals were admitted to the stroke unit of Universidade Estadual Paulista (UNESP) between March 2012 and November 2013, and were included only if they met the following eligibility criteria: irst stroke event, presence of hemiparesis with scores ≥ 1 in items 5 or 6 of the National Institutes of Health Stroke Scale/Score (NIHSS), absence of previous cranial trauma, absence of previ
-ous myopathy, absence of diabetes (glycated hemoglobin < 6.5%) as speciied by the expert committee on the diagnosis and clas
-siication of diabetes mellitus12, absence of alcoholism and other
known causes of peripheral neuropathy, and normal sensory and motor conduction in all four limbs as measured by conventional electrophysiological techniques9.
Variables
Exposures
The independent variables of clinical condition were: age (years), race (non-Caucasian vs. Caucasian), glycemia (mg/dL), glycated hemoglobin (HbA1c, %), creatine phos
-phokinase (CPK, U/L), NIHSS score upon admission (total score), and type of stroke (ischemic vs. hemorrhagic). Glycemia, HbA1c, and CPK were measured by routine lab
-oratory examination. The NIHSS was administered prior to the electrophysiological examination and aimed to quantify the severity of the neurological condition and was subdivided into 11 items: consciousness level, speech, lan
-guage, visual field, unilateral spatial neglect, ocular move
-ment, strength, coordination, and sensitivity. Each item was scored on a scale from 0 to 4, where a higher score was associated with a poorer neurological clinical condition³. Stroke was classified as either ischemic or hemorrhagic by
means of a CT-scan or MRI evaluation according to inter
-national guidelines.
Outcomes
he outcomes of the electrophysiological examina
-tion after admission were: F-wave persistence and latency. he temperature of the lower limb was maintained above 32°C and F-waves were measured from the deep peroneal nerve using symmetrical techniques on the hemiparetic
side. Analysis time was set to 10 ms/cm with a sensitivity of 200 µV and the band-pass ilter was set to 20–3,000 Hz. A minimum of two series of 16 supramaximal stimuli were applied to the deep peroneal nerve at the head of the ib
-ula and it was captured in the extensor digitorum brevis
muscle in order to determine the persistence and latency of F-waves. he minimum amplitude to evoke a positive response (i.e., F-waves) was 10% of the amplitude of the M-wave. he examination was performed by a single exam
-iner, who was certiied by the Brazilian Society of Clinical Neurophysiology. All independent variables were measured upon admission to the stroke unit, and the outcomes were measured within 24–48 h.
Statistical methods
he univariate association between each clinical expo
-sure and electrophysiological outcome was analyzed using non-parametric tests (Spearman and Mann-Whitney). he exposures most strongly associated (p < 0.0083 by Bonferroni correction, α = 0.05/6) with the outcomes were included in a model of multiple linear regression. he num
-ber of independent variables associated with each outcome was 6 in the univariate regression model. After adjustment of the model, the Shapiro-Wilk diagnostic did not reveal any violation of the presuppositions of normality and homosce
-dasticity. Signiicance was set at p < 0.05. Statistical analy
-ses were performed using SPSS version 21.0 (IBM®, Chicago,
Illinois, USA).
RESULTS
Over the course of this study, only 20 of the 168 individuals recruited met the study eligibility criteria. he principal rea
-sons for exclusion of individuals were: absence of hemipare
-sis (18 patients), presentation of cranial trauma (8 patients), previous myopathy (2 patients), previous diagnosis of diabe
-tes (57 patients), history of alcoholism (24 patients), previous presentation of peripheral neuropathy (36 patients), and pre
-sentation of abnormal sensory and motor conduction before F-wave examination (13 patients).
he characteristics of participants in this study are dis
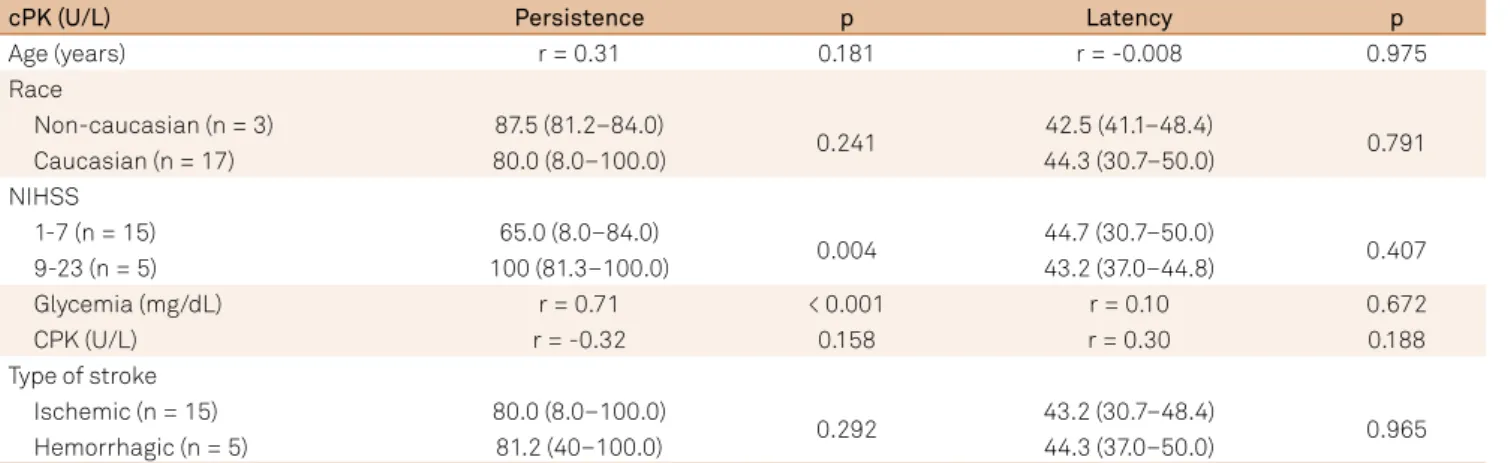
The latency of F-waves was not significantly associ
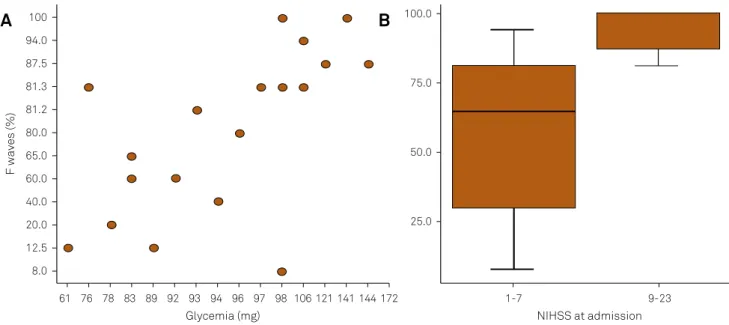
-ated with any clinical or laboratory exam result (Table 2). However, the persistence of F-waves was significantly cor
-related with glycemia (r = 0.71; p < 0.001; Figure A) and NIHSS scores (NIHSS 1–7 = 65.0 × NIHSS 9-23 = 100; p = 0.004; Figure B).
he exposures most strongly associated with our out
-comes were included in the multivariate regression model (Table 3). Glycemia was the most important predictor for an increase in the persistence of F-waves (p < 0.001), with each 1 mg/dl of glycemia augmenting the persistence of F-waves by 0.59% [β = 0.59 (0.44–0.74); p < 0.001].
DISCUSSION
he generation of F-waves is dependent upon the excit
-ability of motor neurons. An increase in the persistence of F-waves indicates alpha motor neuron hyperexcitability, whereas a reduction in the persistence of F-waves indicates hypoexcitability13. In the acute phase of stroke, F-wave per
-sistence is signiicantly reduced on the paretic side. In our study, the mean F-wave persistence was 81.2%. Other stud
-ies have reported that F-wave amplitudes and persistence are decreased in clinically involved limbs, and this inding is compatible with observations of decreased central excit
-ability (e.g., decreased tone and relexes) in patients who are studied early after stroke14,15.
In the acute phase of stroke, F-waves may be absent owing to the hyperpolarization of spinal motor neurons; however, in the late phase, many authors report that F-waves are increased (100%) owing to the augmentation of central nervous system excitability, the disinhibition of supraspinal descending pathways, and a slow conduction period10
. A higher persistence of F-waves in the acute phase of stroke may be related to a poorer neurological outcome15.
Several trials have reported an association between the NIHSS score and functional outcome16,17, but an association
between the persistence of F-waves and NIHSS scores was not signiicant in the inal model of regression in this study. Some studies have reported diferences in F-wave laten
-cies observed on the normal side versus the paretic side18,
whereas other studies did not observe any diferences between the normal and paretic sides19,20,21. In this study, we
did not ind any diferences in F-waves latencies between the normal and paretic sides.
Regarding the biochemical variables in our study, the majority of patients presented with hyperglycemia in the acute phase of stroke. his efect may be related to the elevation of catecholamines during ischemia or alterna
-tively the activation of the hypothalamic-pituitary axis and suprarenal glands, which can lead to activation of the
Table 1. Characteristic of participants (n = 20).
Variable Participants
Age (years) 66 (26-88)¹
Gender
Male 10 (50.0%)
Female 10 (50.0%)
Race
Non-Caucasian 3 (15.0%)
Caucasian 17 (85.0%) NIHSS
1-7 15 (75,0%)
9-23 5 (25.0%)
Glycemia (mg/dL) 96.5 (61.0–172.0)¹
HbA1c (%) 5.6 (5.2–6.0)¹
CPK (xx) 86.5 (24.0–225.0)¹
Type of stroke
Ischemic 15 (75.0%)
Hemorrhagic 5 (25.0%) F-waves
Persistence (%) 81.2 (8.0–100.0)¹
Latency (ms) 43.7 (30.7–50.0)¹
1Values in median; HbA1c: glycated hemoglobin; NIHSS: National Institutes of Health Stroke Scale.
Table 2. Association between F-waves and clinical and laboratory exams.
cPK (U/L) Persistence p Latency p
Age (years) r = 0.31 0.181 r = -0.008 0.975
Race
Non-caucasian (n = 3) 87.5 (81.2–84.0)
0.241 42.5 (41.1–48.4) 0.791
Caucasian (n = 17) 80.0 (8.0–100.0) 44.3 (30.7–50.0)
NIHSS
1-7 (n = 15) 65.0 (8.0–84.0)
0.004 44.7 (30.7–50.0) 0.407
9-23 (n = 5) 100 (81.3–100.0) 43.2 (37.0–44.8)
Glycemia (mg/dL) r = 0.71 < 0.001 r = 0.10 0.672
CPK (U/L) r = -0.32 0.158 r = 0.30 0.188
Type of stroke
Ischemic (n = 15) 80.0 (8.0–100.0)
0.292 43.2 (30.7–48.4) 0.965
Hemorrhagic (n = 5) 81.2 (40–100.0) 44.3 (37.0–50.0)
sympathetic nervous system, elevated glucocorticoid pro
-duction, and stimulates the production of glucose by glyco
-genolysis, glyconeogenesis, proteolysis and/or lipolysis22,23.
Hyperglycemia in the acute phase of stroke may play a role in ischemic neuronal damage24 and, additionally, hypergly
-cemia is associated with a poorer long-term prognosis25,26,27.
Hyperglycemia has been reported to alter nerve conduc
-tion in some preclinical studies28,29. In clinical studies, acute
hyperglycemia did not alter nerve conduction velocities and amplitudes30, but chronic hyperglycemia has been hypoth
-esized to be more detrimental to nerves31. he relationship
between hyperglycemia and nerve conduction is therefore con
-troversial in the literature, and no study to date has reported a relationship between the persistence of F-waves and an acute glucose disorder. herefore, we postulate the hypothesis that hyperglycemia leads to neuronal hyperexcitability and exacer
-bated brain damage after cerebral ischemic injury.
he suggestion that F-waves are a useful prognostic indicator in the acute phase of stroke requires further study in a larger patient sample and with follow-up examination of patients in the chronic phase of stroke. he principal lim
-itation of our study is the small sample size. he method
-ological rigor of the adopted inclusion criteria was a barrier to the recruitment of patients. Additionally, electrophysi
-ological evaluations were operator-dependent and there
-fore limited our ability to screen patients. he long-term prognosis was not evaluated in this manuscript. Despite the limitations of our study, we report a novel inding in a Brazilian population of the principal alterations of F-waves in the acute phase of stroke, and these results provide useful parameters for future research studies.
We conclude that increases in the persistence of F-waves are associated with hyperglycemia in the acute phase of stroke.
References
1. Feigin VL, Forouzanfar MH, Krishnamurthi R et al. Global and regional burden of stroke during 1990-2010: indings from the Global Burden of Disease Study 2010. Lancet. 18;383(9913):245-54. doi:10.1016/S0140-6736(13)61953-4
2. Rafin CN, Fernandes JG, Evaristo EF, Siqueira Neto JI, Friedrich M, Puglia P et al. Revascularização clínica e intervencionista no acidente vascular cerebral isquêmico agudo: opinião nacional. Arq Neuropsiquiatr. 2006;64(2A):342-8. doi:10.1590/S0004-282X2006000200034
3. McComas AJ, Sica RE, Upton AR, Aguilera N. Functional changes in motoneurones of hemiparetic patients. J Neurol Neurosurg Psychiatry. 1973;36(2):183-93. doi:10.1136/jnnp.36.2.183
4. Lukács M, Vécsei L, Beniczky S. Changes in muscle iber density following a stroke. Clin Neurophysiol. 2009;120(8):1539-42. doi:10.1016/j.clinph.2009.06.001
5. Lukács M. Electrophysiological signs of changes in motor units after ischaemic stroke. Clin Neurophysiol. 2005;116(7):1566-70. doi:10.1016/j.clinph.2005.04.005
Table 3. Linear regression adjusted to account for the F-wave persistence as a function of glycemia and NIHSS.
Variable β SE p CI 95%
Glycemia 0.594 0.070 < 0.001 0.448 0.741
NIHSS (9-23) 17.921 14.645 0.237 -12.848 48.689
R2aj = 82.1; pSW = 0.261; NIHSS: National Institutes of Health Stroke Scale; β: estimated coeficient; SE: standard error; CI: conidence interval. Figure. (A) Scatterplot of F-waves versus glycemia; (B): Boxplot of the association between F-waves and stroke severity.
F waves (%)
Glycemia (mg)
100
8.0 12.5 20.0 40.0 60.0 65.0 80.0 81.2 81.3 87.5 94.0
61 76 78 83 89 92 93 94 96 97 98 106121141144172
NIHSS at admission
100.0
25.0 50.0 75.0
1-7 9-23
6. Brown WF, Snow R. Denervation in hemiplegic muscles. Stroke. 1990;21(12):1700-4. doi:10.1161/01.STR.21.12.1700
7. Benecke R, Berthold A, Conrad B. Denervation activity in the EMG of patients with upper motor neuron lesions: time course, local distribution and pathogenetic aspects. J Neurol. 1983;230(3):143-51. doi:10.1007/BF00313625
8. Chroni E, Katsoulas G, Argyriou AA, Sakellaropoulos GC, Polychronopoulos P, Nikiforidis G. Level of consciousness as a conditioning factor of F wave generation in stroke patients. Clin Neurophysiol. 2006;117(2):315-9. doi:10.1016/j.clinph.2005.10.018
9. Kimura J. Electrodiagnosis in diseases of nerve and muscle: principles and practice. 3rd ed. New York: Oxford University Press; 2001. p. 439-49.
10. Mesrati F, Vecchierini MF. F-waves: neurophysiology and clinical value. Neurophysiol Clin. 2004;34(5):217-43. doi:10.1016/j.neucli.2004.09.005
11. Rickham PP. Human experimentation: code of ethics of the World Medical Association: declaration of Helsinki, BMJ. 1964;2(5402):177. doi:10.1136/bmj.2.5402.177
12. Genuth S, Alberti KG, Bennett P, Buse J, Defronzo R, Kahn R et al. Follow-up report on the diagnosis and classiication of diabetes mellitus. Diabetes Care. 2003;26(11):3160-7. doi:10.2337/diacare.26.11.3160
13. Milanov IG. A comparison of methods to assess the excitability of lower motoneurones. Can J Neurol Sci. 1992;19(1):64-8. doi:10.1017/S0317167100042554
14. Fisher MA, Shahani BT, Young RR. Assessing segmental
excitability after acute rostral lesions. I. The F response. Neurology. 1978;28(12):1265-71. doi:10.1212/WNL.28.12.1265
15. Drory VE, Neufeld MY, Korczyn AD. F-wave characteristics following acute and chronic upper motor neuron lesions. Electromyogr Clin Neurophysiol. 1993;33(7):441-6.
16. The National Institute of Neurological Disorders; Stroke rt-PA Stroke Study Group. Tissue plasminogen activator for acute ischemic stroke. N Engl J Med. 1995;333(24):1581-7. doi:10.1056/NEJM199512143332401
17. Hacke W, Kaste M, Bluhmki E, Brozman M, Dávalos A, Guidetti D et al. Thrombolysis with alteplase 3 to 4.5 hours after acute ischemic stroke. N Engl J Med. 2008;359(13):1317-29. doi:10.1056/NEJMoa0804656
18. Fisher MA. F response latencies and durationS in upper motor neuron syndromes. Electromyogr Clin Neurophysiol. 1986;26(5-6):327-32.
19. Liberson WT, Chen LCY, Fok SK, Patel KK, Yu GH, Fried P. “H” relexes and “F” waves in hemiplegics. Electromyogr Clin Neurophysiol 1977;17(3-4):247-64. doi:
20. Bischoff C, Stålberg E, Falxk B, Puksa L. Signiicance of A-waves recorded in routine motor nerve conduction studies. Electroencephalogr Clin Neurophysiol. 1996;101(6):528-33. doi:10.1016/S0013-4694(96)96553-4
21. Chroni E, Argyriou AA, Katsoulas G, Polychronopoulos P. Ulnar F wave generation assessed within 3 days after the onset of stroke in patients with relatively preserved level of consciousness. Clin Neurol Neurosurg. 2007;109(1):27-31. doi:10.1016/j.clineuro.2006.04.008
22. Helgason CM. Blood glucose and stroke. Curr Treat Options Cardiovasc Med 2012;14(3):284-7. doi:10.1007/s11936-012-0178-5
23. Luitse MJ, Biessels GJ, Rutten GE, Kappelle LJ.
Diabetes, hyperglycaemia, and acute ischaemic stroke. Lancet Neurol. 2012;11(3):261-71. doi:10.1016/S1474-4422(12)70005-4
24. Yamazaki Y, Harada S, Tokuyama S. Post-ischemic hyperglycemia exacerbates the development of cerebral ischemic neuronal damage through the cerebral sodium-glucose transporter. Brain Res. 2012;1489:113-20. doi: 10.1016/j.brainres.2012.10.020
25. Muir KW, McCormick M, Baird T, Ali M. prevalence, predictors and prognosis of post-stroke hyperglycaemia in acute stroke trials: individual patient data pooled analysis from the Virtual International Stroke Trials Archive (VISTA). Cerebrovasc Dis Extra. 2011;1(1):17-27. doi:10.1159/000324319
26. Rosso C, Pires C, Corvol JC, Baronnet F, Crozier S, Leger A et al. Hyperglycaemia, insulin therapy and critical penumbral regions for prognosis in acute stroke: further insights from the INSULINFARCT trial. PLoS One. 2015;10:e0120230. doi:10.1371/journal.pone.0120230
27. Yoo DS, Chang J, Kim JT, Choi MJ, Choi J, Choi KH et al. Various blood glucose parameters that indicate hyperglycemia after intravenous thrombolysis in acute ischemic stroke could predict worse outcome. PLoS One. 2014;9(4):e94364. doi:10.1371/journal.pone.0094364
28. Shirabe S, Kinoshita I, Matsuo H, Takashima H, Nakamura T, Tsujihata M et al. Resistance to ischemic conduction block of the peripheral nerve in hyperglycemic rats: an electrophysiological study. Muscle Nerve. 1988;11(6):582-7. doi: 10.1002/mus.880110610
29. Erdoğan C, Cenikli U, Değirmenci E, Oğuzhanoğlu A. Effect of hyperglycemia on conduction parameters of tibial nerve’s ibers to different muscles: a rat model. J Neurosci Rural Pract. 2013;4(1):9-12. doi:10.4103/0976-3147.105602
30. Halonen JP, Rönnemaa T. Peripheral nerve conduction in healthy subjects during short-term hyperglycemia. Electromyogr Clin Neurophysiol. 1998;38(6):355-8. doi: