Clinical evaluation, biochemistry and genetic polymorphism analysis for the diagnosis of lactose intolerance in a population from northeastern Brazil
Texto
Imagem


Documentos relacionados
tain amount of lactose by individuals with lac- tose intolerance, information on the presence and amount of lactose in processed food labels should be mandatory in
pylori EIA presented high sensitivity and specificity when employed for a population in Brazil, permitting the use of the test both to confirm the clinical diagnosis and to
Indeed, for 50 years pyridoxine dependent epilepsy has been a clinical diagnosis based on the clinical effect of pyridoxine and conirmation of the diagnosis by a trial of
To investigate changes regarding the fish assemblages, we used several diversity indices (taxonomic – species richness, Shannon-Wiener, Simpson and Pielou’s evenness;
The diagnosis of infection from implant requires the presence of clinical manifestations and pathogens in surgical specimens, and blood cultures may be negative in cases
Doctor Esteves and colleagues, from Brazil and USA, summarized the results from the current literature of sperm retrieval as well as the clinical outcome of ICSI in the
O valor de referência em matéria de eficiência para a produção separada de calor (usando gás natural) é de 90%, conforme indicado no anexo II da Directiva 2004/8/CE. O
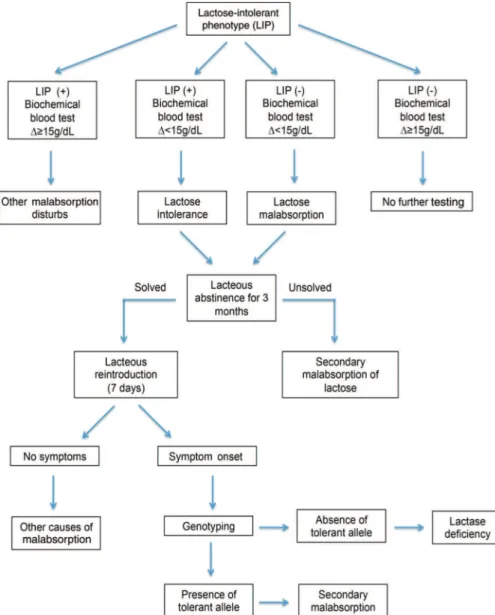
Figure 3 - Flow chart suggesting a clinical protocol for the diagnosis of lactose intolerance by combining clinical symptoms, biochemical blood test results and single
