Partition study of textile dye Remazol Yellow Gold RNL in aqueous
two-phase systems
Juliana Maria de Alvarenga
a, Renata Aparecida Fideles
a, Maira Vieira da Silva
a,
Gabriella Frade Murari
a, Jason Guy Taylor
a, Leandro Rodrigues de Lemos
b,
Guilherme Dias Rodrigues
c, Aparecida Barbosa Mageste
a,*
aDepartamento de Química, ICEB, Universidade Federal de Ouro Preto, Campus Morro do Cruzeiro, CEP 35400-000 Ouro Preto, MG, Brazil bDepartamento de Química, FACET, Universidade Federal dos Vales do Jequitinhonha e Mucuri
–Diamantina, MG, Brazil
cLaboratório de Soluções Analíticas Verdes (LaSAV), Departamento de Química, Instituto de Ciências Exatas (ICEx), Universidade Federal de Minas Gerais (UFMG)–Belo Horizonte, MG, Brazil
A R T I C L E I N F O
Article history:
Received 10 December 2014
Received in revised form 21 January 2015 Accepted 26 January 2015
Available online 28 January 2015
Keywords:
Aqueous two-phase systems Remazol Yellow Gold RNL Ionic liquids
Partition Green chemistry
A B S T R A C T
The removal of organic dye pollutants from wastewater produced by the textile industry is a complex problem that presents potential health risks to the general public. Remazol Yellow Gold RNL (YR) dye is readily used to dye cellulose base materials and the methods developed for its removal from aqueous systems are either inefficient or too expensive to be adopted by smaller textile manufactures. Our approach is based on aqueous two-phase system (ATPS) using salts and either polymers or ionic liquids to extract Remazol Yellow Gold RNL from wastewater. Parameters such as the nature of the electrolyte, molecular mass of polymer and tie line length (TLL) on the dye partition coefficient (KYR) were all evaluated. A phase diagram for the polyethylene glycol (PEG 4000 g mol 1) and magnesiumsulfate system at 298.15 K was obtained and used to study the partitioning of YR. TheKYRvalues demonstrate the potential of both systems for the removal of dyes from industrial effluents. The partition mechanism was discussed based on the Haynes model and using the of Gibbs standard energy change (DtrG). The driving force (enthalpy and/or entropy) that governs the partitioning of the dye depends on the nature of the ATPS. The optimized conditions that gave the best system was successfully applied to the removal of YR from wastewater obtained from a local textile manufacturer. The highKYRvalues in the presence of the effluent demonstrate the potential and robustness of the ATPS for the treatment of effluents from textile industries.
ã2015 Elsevier B.V. All rights reserved.
1. Introduction
Dyes are organic compounds that give color to materials and are used extensively in various industries such as textiles, cosmetics, paper and plastic industries[1]. Despite the wide application of dyes, their disposal into the environment and contamination of water is a major problem that has aroused concern due to their adverse effects on human health, to fauna and toflora[2,3]. In view of the toxicity and undesirable effects to aquatic environments, environmental regulations have become increasingly stricter[4] and spurred a demand for efficient methodologies for the removal of toxic waste products.
The removal of dyes from wastewater is a complex problem to resolve and different physicochemical processes such as [5]; adsorption [6], electrokinetic coagulation [7], ion exchange[8], electrochemical oxidation[9]and photocatalytic degradation[10] studies are routinely carried out to find solutions to this environmental problem[5]. However, these methodologies have their drawbacks, amongst which, the generation of hazardous waste or secondary intermediates, slow degradation rates and high costs are limitations that stand out. In this sense, new and more efficient methods that are cleaner, safer and economically viable are required for removing dyes from industrial effluents before releasing them into water bodies.
Aqueous two-phase system (ATPS) may be formed by mixing aqueous solutions of an electrolyte and a polymer. Alternatively, aqueous solutions of two chemically different polymers can be mixed to prepare ATPS or they may be formed from two kinds of
* Corresponding author. Tel.: +55 31 3559 1707; fax: +55 31 3559 1707.
E-mail address:[email protected](A.B. Mageste).
http://dx.doi.org/10.1016/j.fluid.2015.01.022
0378-3812/ã2015 Elsevier B.V. All rights reserved.
Contents lists available atScienceDirect
Fluid Phase Equilibria
salts mixed under certain thermodynamic conditions, e.g. temper-ature, pressure and composition[11]. In recent years, new type of ATPS containing salts and ionic liquid (IL) (IL–ATPS) have been investigated[12]. The resulting system consists of two immiscible phases, with the major component of these systems being essentially water. ATPS are environmentally safe, recyclable, economical viable, quick and scalable for application in industrial processes[13].
Mageste et al.[14,15]evaluated the partition behavior of natural dye carmine and norbixin in different ATPS systems formed from polymer and salts. A significant transfer of dyes to the upper phase of the ATPS was observed and thus demonstrating the potential of these systems for purification applications. ATPS systems formed by potassium salts and polyethylene glycol (PEG) using ionic liquids as adjuvant have also been reported by Souza et al.[16]for the partitioning of dyes chloranilic acid and rhodamine 6G. Recently, Ferreira et al.[4]achieved extraction efficiencies of 100% when employing IL–ATPS for the extraction of dyes chloranilic acid, indigo blue and sudan III. In respect of these systems, little is known about the driving force that dictates how these dyes partition between the phases. Understanding these parameters is of fundamental importance to allow the full potential use of ATPS systems in large scale to be realized.
To the best of our knowledge, there are no reports in the literature concerning the use of ATPS for the removal of dye Remazol Yellow Gold (RNL or YR), also known as Remazol Golden Yellow (Fig. 1) from wastewaters. This dye is commonly used in the textile industry for dyeing cellulosefibers. The removal of Remazol Yellow Gold RNL from aqueous solutions has been accomplished by adsorption [17], anaerobic degradation [18] and photocatalytic approaches[19].
Thus, the aim of this study was to investigate the driving forces that determine the partition behavior of YR in ATPS composed of either polymer + salt or salt + ionic liquid. Herein, we report the effects of the nature of the electrolyte, average molar mass of the polymer and the system composition on the dye extraction yield. Furthermore, a phase diagram for the PEG 4000 + magnesium sulfate salt + water at 298.15 K system was determined to study the effect of polymer molar mass. In order to demonstrate the robustness of ATPS, partition experiments were carried out using industrial (effluent) samples obtained from a local textile manufacturer in the city of Itabirito, Minas Gerais, Brazil.
2. Material and methods
2.1. Materials
Polyethylene glycol (PEG) with an average molecular weight of 1500, 4000 and 6000 g mol 1 were used. Ammonium sulfate
((NH4)2SO4), lithium sulfate monohydrate (Li2SO4
H2O), magnesiumsulfate heptahydrate (MgSO4
7H2O), sodium citrate (NaH2C6H5O7),sodium sulfate (Na2SO4) and sodium tartarate dihydrate
(Na2C4H4O6
2H2O) were purchased from Synth (SP, Brazil).n-Bromobutane, methylimidazole, sodium tetrafluoroborate, dichloromethane were purchased from Sigma–Aldrich (St. Louis,
MO, USA). Wastewater and dye YR, C16H18N4O10S3
Na2, were kindlyprovided by a textile manufacturer located in Itabirito city, MG, Brazil. The YR chemical structure is shown inFig. 1. Distilled water was used for every experiment. All chemicals used in this study were of analytical grade and used without further purification. Ionic liquid 1-butyl-3-methylimidazolium tetrafluoroborate ([Bmim] BF4) was synthesized in our laboratory and was purified according
to the methods reported in the literature[20].
2.2. Synthesis and spectral characterization of ionic liquid 1-butyl-3-methylimidazolium tetrafluoroborate
The method described by Burrell et al.[20]was adopted with minor modifications.n-Bromobutane (30 g) was slowly added by addition funnel to freshly distilled methylimidazole (25 g) in a 250 mL two-necked round-bottom flask fitted with a reflux condenser. An ice water bath was used to prevent the temperature of the solution rising above 40C. This mixture was then stirred with a magnetic stirrer at room temperature for 30 h. The ionic liquid was then dissolved in deionized water (300 mL) and decolorizing charcoal (10 g) was added to the solution, which was heated at 60C for 2 h. The mixture was then cooled to room temperature andfiltered. The colorless 1-butyl-3-methylimidazo-lium bromide solution was then poured into a solution of sodium tetrafluoroborate (34 g) in 250 mL of deionized water and stirred at room temperature for 3 h. The solution was transferred to separatory funnel and extracted with dichloromethane (370 mL). The organics were combined andfiltered through a plug of silica (100 g) to remove sodium bromide. The dichloro-methane solution was dried in vacuo to give neat 1-butyl-3-methylimidazolium tetrafluoroborate as a transparent viscous liquid (74% yield).
d
H(250 MHz, CDCl3): 8.85 (1H, s), 7.33–7.42 (2H,m), 4.19 (2H, t,J7.5), 3.96 (3H, s), 1.79–1.92 (2H, m), 1.30–1.41 (2H, m), 0.96 (3H, t,J7.3);
d
C(62.5 MHz, CDCl3): 136.6, 123.5, 121.9, 49.9,36.3, 31.9, 19.4, 13.3. Nuclear magnetic resonance (NMR) spectra were measured at 250 MHz (1H), on a Bruker 250 spectrometer. All NMR spectra were recorded in CDCl3, with reference to
tetrame-thylsilane. NMR data are in accordance with literature values[20]. The purity (>98%) of the ionic liquid was determined by integration of1H NMR signals.
2.3. Determination of ATPS phase diagrams
The systems used to evaluate partitioning behavior of the dye have been summarised in Table 1. Most of the phase diagrams pertinent to this study have been previously reported in the literature[21–27]. Phase diagrams for the PEG 4000 + magnesium sulfate + water system at 298.15 K were obtained and utilized in
[(Fig._1)TD$FIG]
NHCOCH
3NH
2SO
3Na
N
N
S
O
O O
S
ONa
O
O
Fig. 1. Chemical structure of Remazol Yellow Gold RNL dye.
Table 1
Summary of the ATPS utilized for the partitioning of YR.
ATPS
PEG 1500 + Li2SO4+ water*[23]
PEG 1500 + NaH2C6H5O7+ water*[25]
PEG 1500 + Na2C4H4O62H2O + water*[25]
PEG 1500 + Na2SO4+ water*[23]
PEG 1500 + (NH4)2SO4+ water*[27]
PEG 1500 + MgSO4+ water*[23]
PEG 4000 + MgSO4+ water
PEG 6000 + MgSO4+ water*[24]
PEG 4000 + Li2SO4+ water*[22]
PEG 6000 + Li2SO4+ water*[24]
([Bmim]BF4+ (NH4)2SO4+ water*[26]
([Bmim]BF4+ MnSO4+ water*[21]
*Phase diagrams were obtained from the literature [references].
YR partitioning studies. Stock solutions of the polymer and salt were prepared by weighing known quantities of the reagents on an analytical balance (Shimadzu, AG 220 with an uncertainty of
0.0001 g). This stock solution and water were then mixed in glass tubes. The tubes were vigorously shaken and kept in a thermostatic bath (Marconi, MA 184, with an uncertainty of0.1 K) at 298.15 K for at least 48 h to guarantee complete separation of the phases and the realization of a thermodynamic equilibrium. Next, the two phases were separately collected for analysis.
The composition of the each separated phases was quantified in two steps: (i) the phases were separately collected and diluted to determine the salt concentration by conductivity analysis per-formed at 298.15 K (Schott CG853, Germany). (ii) The water content was determined by volatilization gravimetry in an oven at 343.15 K until constant weight was achieved. The polymer concentration (WPEG) in the phases was determined by mass difference for each
component,wPEG¼wtotal wH2O wsaltwherewtotal= 1.00.
The tie line length (TLL) was calculated according to Eq.(1).
TLL¼ CTP CBP
2
þ CTS CBS
2
1=2
(1)
whereCT
PandCBPare the concentrations of polymer andCTSandCBS are the salt concentration in the top and bottom phases, respectively.
2.4. Partition experiments
2.4.1. Preparation of stock solutions
All PEG and salt concentrations in stock solutions are represented in weight percent. Appropriated amounts of PEG and salt were dissolved in distilled water to prepare the stock solutions. The dye solution was obtained by dissolving 0.4 g of YR in approximately 2.25 g of water. The resultant concentration was 3.13 mmol kg 1.
2.4.2. Preparation of aqueous two-phase systems (ATPS)
To achieve the desired compositional ratio for each ATPS[21– 26], appropriate amounts of [Bmim]BF4or PEG, salt stock solutions
and water were taken into a graduated centrifuge tubes. The tubes were shaken and left to stand in a thermostatic bath at 298.15 K, for a minimum of 48 h (Marconi, MA 184, with an uncertainty of
0.1 K). Once the system had achieved thermodynamic equilibri-um, the two phases were collected separately for partitioning experiments.
2.4.3. Partition behavior of Remazol Yellow Gold RNL in ATPS For partition studies of ATPS containing polymer + salt + water, the samples were prepared by mixing 3.0 g of both top and bottom phases of ATPS and adding 100 mg of dye solution. In the case of ATPS formed by IL, 0.033 g of YR solution was added to the system that contained 1.0 g of each phase. For each TLL and each ATPS, three systems were prepared: thefirst being a blank without the addition of the dye, a sample and a replica. The mixtures were stirred manually for 3 min until the solutions became cloudy and then maintained under controlled temperature in a thermostatic bath at 298.15 K. After a period of 48 h, phase separation occurred and the thermodynamic equilibrium was reached. Both phases were collected separately and diluted in order to determine the dye concentration. The dye was quantified in each phase using a UV–vis spectrophotometer (Hewlett Packard 8453) at a wavelength of 256 nm.
The partition coefficient for the dye (KYR) between the phases is
determined by the concentration ratio of the analyte in each phase of the ATPS as described in Eq.(2).
KYR¼
½YRT
½YRB (2)
where½YRTand½YRBexpress the dye concentration in the upper and lower phases respectively. In agreement with the Beer–
Lambert law, the absorbance of the analyte at a specific wavelength is directly proportional to the analyte concentration. Thus, the partition coefficient (KYR) can be given as described in
Eq.(3).
KYR¼AbsTfdTP AbsBfdBP
(3)
where AbsTand AbsBare the absorbance of the upper and lower phases respectively at the specified wavelength. TermsfdTPandfdBP
express the dilution factors for each phase.
2.5. Recovery experiments
2.5.1. Preparation of waste water solution and stock solutions The waste water wasfiltered and then diluted ten times. This waste water stock solution was then kept under refrigeration. Dye, PEG 1500 and lithium sulfate stock solutions were prepared using waste water stock solution as solvent in the same manner as described previously.
2.5.2. Recovery of YR in presence of waste water
To investigate the recovery of YR, a PEG 1500 + Li2SO4+ H2O
ATPS mixture doped with YR was used. The partition procedure was performed as previously described. After separation of the two-phases, the dye was quantified in each phase using a UV–vis spectrophotometer at a wavelength set at 256 nm. The concentra-tion of dye YR in each phase was determined from a linear calibration curve.
The recovery percentage (%R) of the YR was calculated by Eq.(4).
%R¼ nT
nTot100 (4)
wherenTis the amount of dye present in the top phase andnTotis
the total amount of dye added to the system.
2.6. Extraction efficiency of YR in ATPS
The extraction efficiency for YR in each ATPS is expressed by the relation between the amount of dye present in the upper phase to the total quantity of dye in the ATPS at thermodynamic equilibrium. This parameter is obtained as described by Eq.(5) [4].
%EYR¼ AbsTfdTP
wT
AbsTfdTPwT
ð Þ þðAbsBfdTBwBÞ100 (5)
where AbsTfdTPand AbsBfdTBare the absorbance’s of the superior and inferior phases andwTandwBrepresent the mass of the upper
and lower phases, respectively.
2.7. YR transfer Gibbs standard energy change (
D
trG)For all ATPS studied, the Gibbs standard energy change (
D
trG)was obtained following the thermodynamic relationship:
D
trG¼ RTlnKYR (6)whereRis the universal gas constant,Tis the absolute temperature andKYRis the dye partition coefficient.
The thermodynamic parameter
D
trGis the change in the Gibbsenergy of the system when 1 mol of dye, under infinite dilution is transferred from the bottom phase to the top.
3. Results and discussion
3.1. Phase diagrams
The phase compositions for the ATPS formed by PEG 4000 and magnesium sulfate salt are shown inTable 2. All concentrations are expressed in weight percent. This data is of fundamental importance for studying partition and extraction of solutes in ATPS. Water is the major component in both phases. The upper phase is enriched with polymer whereas the bottom phase is rich in salt. This behavior is in agreement with other observations made for polymer/salt ATPS systems[22–25].
3.2. The tie line length effect on the partitioning YR
The tie line length (TLL) is a line that connects the points of the diagram which represent the composition of the two phases at thermodynamic equilibrium. The TLL is an important thermody-namic parameter that indicates which distinct and intensive thermodynamic properties of the phases co-exist at equilibrium [14].
Fig. 2shows the partition coefficient values for YR at 298 K as a function of the tie line length in ATPS formed by PEG 1500 + sulfate salts + H2O. When analyzing the partition behavior of YR, it can be
seen that a rise in tie line length significantly increases the dye transference to the top phase of the ATPS. Furthermore, it is important to note that the YR preferentially partitions to the top phase. All of the systems formed by polymer + salt showedKYR
values greater than unity, indicating the affinity of the dye for the top phase of the system and the potential of ATPS for the extraction of this dye.
For a better understanding of the partition mechanism of YR in this ATPS, the thermodynamic parameter
D
trG was determined.The Gibbs standard energy change of transfer (
D
trG) at 298.15 K asa function of the TLL for all the ATPS studied are presented below (Table 3).
The negative values of
D
trGindicate that the partitioning of YRin ATPS formed by PEG + salts + H2O is spontaneous. Partitioning of
YR occurs when there is a decrease in the Gibbs energy of the system. We can understand why this dye prefers the top phase of the ATPS over the bottom phase by evaluating the factors that contribute to
D
trG, i.e. the contribution ofD
trH andD
trS. Ingeneral, results show a reduction in the
D
trGvalue with increasingTLL, except for the case involving ATPS containing ionic liquids ([Bmim]BF4+ MgSO4+ H2O. For ATPS with polymer, salt and water,
the
D
trG values are negative and demonstrate the spontaneoustransfer of the dye to the top phase of the system. As shown in Table 3, for ATPS formed from IL,
D
trGare positive due to inversionin the tendency of YR to partition to top phase.
The driving forces that direct the partition of the solute in the ATPS can be evaluated qualitatively by a simple model developed by Johansson et al., which is derived from the Flory–Huggins theory [28]. This model relates the partition coefficient of the solute to enthalpic and entropic contributions.
The entropic contribution for solute partitioning is described by Eq.(7).
lnKYR¼MYR
r
nT VT
nB VB
(7)
whereMYRis the molecular weight of the solute partitioned,nTand
nBare the total number of molecules in the top and bottom phases
and are divided by theVTandVBdensity number of each phase. Finally,
r
is the number of lattice sites per unit volume.This equation shows that in the absence of an enthalpic contribution, the heterogeneous distribution of a solute between the phases will occur if there is a density difference between the phases. In the more dense phase, there are a greater number of different configurations to distribute the molecules that constitute the ATPS and the solute[28]. In ATPS formed by PEG + salts + H2O,
the number density in the bottom phase is higher than the top phase due to the higher water content of the salt-rich phase
[(Fig._2)TD$FIG]
30 35 40 45 50 55 60 0
300 600 900 1200 1500
TLL / (% w/w) KYR
Fig. 2.Effect of cation of the salt forming ATPS on the YR partition behavior: (&) PEG 1500 + Li2SO4+ H2O, () PEG 1500 + MgSO4+ H2O, (~) PEG 1500 + (NH4)2SO4+
H2O, (^) PEG 1500 + Na2SO4+ H2O.
Table 3
Variation of Gibbs standard free energy,DtrG, (kJ mol 1) of transfer YR for all
systems at 298.15 K and different TLL values.
ATPS TLL 1 TLL 2 TLL 3 TLL 4 TLL 5 PEG 1500 + Li2SO4 12.12 13.91 15.95 17.61
PEG 1500 + NaH2C6H5O7 8.901 10.11 11.87 13.43 14.89
PEG
1500 + Na2C4H4O62H2O
7.82 10.14 12.03 12.93 13.35
PEG 1500 + Na2SO4 10.08 10.89 12.32 13.75 14.33
PEG 1500 + (NH4)2SO4 9.74 13.44 14.97 16.89
PEG 1500 + MgSO4 11.03 12.29 12.91 13.56 14.33
PEG 4000 + MgSO4 13.09 13.36 14.19 14.83 15.28
PEG 6000 + MgSO4 9.88 10.68 11.48 12.46 13.16
PEG 4000 + Li2SO4 13.91 15.20 16.63 17.38
PEG 6000 + Li2SO4 14.16 14.67 15.97 17.12
IL + (NH4)2SO4 8.501 6.39 5.89
IL + MnSO4 4.139 4.413 4.994 5.030 5.823
Table 2
Equilibrium data for PEG 4000(wPEG) + magnesium sulfate (wS) + water (wW) system to 298.15 K.
Overall Top phase Bottom phase
TLL 100wPEG 100wS 100ww 100wPEG 100wS 100ww 100wPEG 100wS 100ww
43.85 22.05 8.91 69.04 41.44 0.81 57.75 1.81 19.57 78.62
48.12 24.59 9.48 65.93 45.00 0.53 54.47 1.26 20.58 78.16
50.53 25.82 9.82 64.36 46.59 0.44 52.97 1.23 22.71 76.06
53.31 26.69 10.80 62.51 49.87 0.31 49.83 1.96 23.69 74.36
55.28 28.60 11.53 59.87 51.33 0.19 48.48 2.29 25.70 72.00
Standard deviations of the salt and polymer concentration are lower than0.76 and2.2, respectively.
(Table 4). In accordance with Eq.(7), there is a strong entropic contribution for solute partitioning to the bottom phase. However, the experimental results demonstrate that when the dye is introduced into this system, it moves to the top phase and thus decreases the entropy of the system.
Once the dye transfer process to the top phase becomes entropically unfavorable, enthalpy should be the driving force that governs dye partitioning to the polymer-rich phase. The enthalpic contribution is expressed in the Johansson et al. model[28], by
lnKYR¼ MYR RT
Xm
i¼1ði6¼YRÞð
F
T iF
B iÞWiYR h
Xm i¼1ði6¼YRÞ
Xm 1 j¼iþ1ðj6¼YRÞð
F
T i
F
T j
F
B i
F
B jÞWij
i
(8)
where
F
Ti andF
Bi are the volume fraction of components that form the ATPS top and bottom phases, respectively,wijis the energy involved in the formation of effective pair potential which is defined as: wij=z[
e
ij (1/2)(e
ii+e
jj)], z is the number of close neighbors, ande
ijis the potential energy of the pairi–j.The enthalpic driving force for solute partitioning is composed of two terms: (i) The first, Pm
i¼1ði6¼YRÞð
F
T iF
B
iÞWiYR, is the summation of the energy involved in the interaction between the YR solute and every component present in each phase of the ATPS. The second,Pm
i¼1ði6¼YRÞ Pm 1
j¼iþ1ðj6¼YRÞð
F
T iF
T j
F
B i
F
B
jÞWij, rep-resents the self-energy of the phase and an equivalent to the sum of the energy of the interaction between all the potential pairs formed by combination of the components in each phase in the absence of solute. The transfer of solute molecules from one phase to another changes the self-energy of the phase by breaking interactions between the components and concurrently forming new solute–component interactions. In other words, the parti-tioning of the dye requires breaking interactions between the original components to create a cavity into which the dye mayfit. Eq.(8)predicts that the solute will favor partitioning to the phase where the component most strongly interacts and prefers the phase where there is less energy expenditure to form the cavity in which it is to be housed.
The fact that the dye displays higher affinity for the top phase (KYRvalues greater than one) is explained by a specific interaction
between polymer and YR molecules and the lower energy required to form a cavity that accommodates the dye in the top phase. As clearly observed in Fig. 2, an increase in the TLL leads to a significant increase inKYRvalues. Given that TLL increases as a
function of polymer and salt concentration, it seems reasonable to suggest that preferential migration to the top phase is due to interactions with polymer macromolecule and therefore giving rise to the formation of polymer–dye complexes in the top phase.
3.3. Effect of ATPS-forming electrolyte on the extraction of YR
Several researchers have studied the influence of the type of salts in ATPS on the extraction of solute[14,15,29]. PEG 1500 and sulfate salt were used for YR partition to investigate the effect of different cations on ATPS partitioning. The results are summarized in Fig. 2and indicate that ATPS formed by lithium salt is more efficient in the transfer of YR to the top phase.
This cation effect may be explained by the model of da Silva and Loh[30], which suggests that when mixing the polymer and salt, the cation of the salt and the macromolecules interact to release water molecules that were previously solvating such components and therefore increase the entropy of the system. As the concentration of the electrolyte increases, the process continues until it reaches an energetic saturation. This is due to the effect of repulsive forces between polymer cation complexes and the added salts. Once the saturation point is reached, the addition of more electrolyte ions causes them to group together in a region furthest away from the macromolecule–ion complex. The addition of more electrolyte forms two phases and lowers the Gibbs energy of the system. When compared to other cations, the model indicates that a higher concentration of Li+is necessary to energetically saturate
the polymer chain. Thus, the macromolecule structure of the polymer is more positively charged in the ATPS when composed of Li2SO4 and this enables a stronger electrostatic interaction
between the polymer-cation and YR in the Li2SO4system.
3.4. Molecular mass polymer effect
Fig. 3shows the partition behavior of YR in the aqueous two-phase systems formed by sulfate salts and polymer PEG with different molecular masses. If the polymer molecular weight is increased, the entropy of mixing solute and polymer will be reduced in the phase containing polymer. Moreover, there will be a reduction in the number of possible configurations for the dye molecules in the top phase, which thereby improves solute partition to the bottom phase [31]. Furthermore, the polymer becomes more hydrophobic with increasing molecular weight and increasing the hydrophobicity of the upper layer of ATPS. The YR is a highly hydrophilic species, so KYR tends to decrease with
increasing molar mass of the macromolecule. However, as can be observed inFig. 3, there is no significant effect of the macromo-lecular size on the YR partitioning behavior. This partitioning behavior reinforces the idea that the YR transfer process to the top phase of the ATPS is enthalpy driven.
Table 4
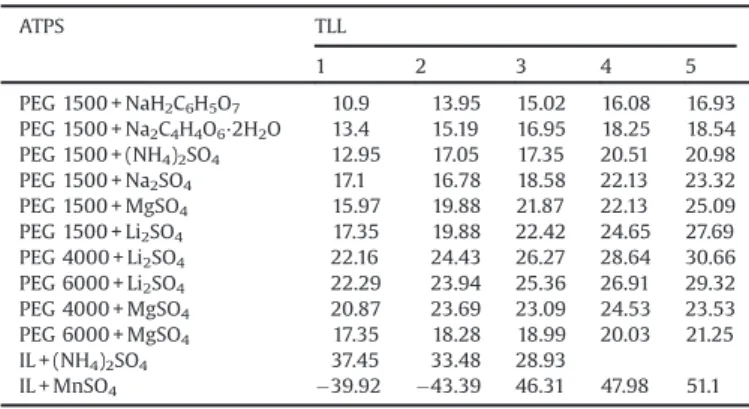
Difference in the concentration of H2O between the bottom and top phases of the
ATPS, at 298.15 K.
ATPS TLL
1 2 3 4 5
PEG 1500 + NaH2C6H5O7 10.9 13.95 15.02 16.08 16.93
PEG 1500 + Na2C4H4O62H2O 13.4 15.19 16.95 18.25 18.54
PEG 1500 + (NH4)2SO4 12.95 17.05 17.35 20.51 20.98
PEG 1500 + Na2SO4 17.1 16.78 18.58 22.13 23.32
PEG 1500 + MgSO4 15.97 19.88 21.87 22.13 25.09
PEG 1500 + Li2SO4 17.35 19.88 22.42 24.65 27.69
PEG 4000 + Li2SO4 22.16 24.43 26.27 28.64 30.66
PEG 6000 + Li2SO4 22.29 23.94 25.36 26.91 29.32
PEG 4000 + MgSO4 20.87 23.69 23.09 24.53 23.53
PEG 6000 + MgSO4 17.35 18.28 18.99 20.03 21.25
IL + (NH4)2SO4 37.45 33.48 28.93
IL + MnSO4 39.92 43.39 46.31 47.98 51.1
[(Fig._3)TD$FIG]
30 35 40 45 50
0 250 500 750 1000 1250
KYR
TLL / (% w/w)
Fig. 3.Effect of PEG molar weight forming ATPS on the YR partition behavior: (&) PEG 1500 + Li2SO4+ H2O, (&) PEG 4000 + Li2SO4+ H2O, (!) PEG 6000 + Li2SO4+ H2O.
3.5. Anion effect
Effect of anion on the partition of YR in ATPS formed by PEG 1500 and sodium salts are shown inFig. 4.
Results suggest that changing the anion of the salt does not significantly alter the partition behavior in the ATPS. This fact confirms the initial hypothesis that the partitioning of the dye occurs preferentially to the top phase due to a specific interaction between this solute and the polymer macromolecule.
3.6. Partition behavior of YR in IL–salt aqueous two-phase system (IL– ATPS)
After their application in 2003 [12], the IL–ATPS system has aroused much interest in the scientific community. They have been successfully employed to separate several solutes such as: sulfonamides in milk [32], cytochrome C [33], bovine serum albumin[34], antibiotics in honey[35], textile dyes[4], among others.
Fig. 5shows the partition behavior of YR in IL–ATPS where the ionic liquid used is [Bmim]BF4and salts include (NH4)2SO4 and
MnSO4. Unlike the previously mentioned polymer based ATPS, YR
partitions preferentially to the bottom phase in the IL–ATPS. To understand the variation ofKYRvalues with respect to TLL, it
is necessary evaluate both the entropic and enthalpic contribu-tions. As the TLL increases, so does the concentration of the components in each phase and therefore there is a greater number of interactions between YR and the main interacting component.
This will therefore modify thefirst term of Eq.(6), by increasing the enthalpic contribution of theKYRvalue.
On the other hand, the difference in the amount of water between the bottom and top phase is altered (Table 4); conse-quently, the term ((nT/VT) (nB/VB)) in Eq. (7) becomes more
negative or more positive, changing entropic contribution for transfer of YR between phases of the ATPS.
In [Bmim]BF4+ (NH4)2SO4+ water ATPS, the top phase is rich in
IL, the bottom phase rich in salt and water is the predominant component in both phases. The YR partition behavior in this system is attributed to an entropic contribution resulting in an increase in the dye partition coefficient with increasing TLL.
However in [Bmim]BF4+ MnSO4+ water KYR decreases with
increasing TLL. This surprising partitioning behavior can be rationalized by considering that this system exhibits phase inversion. Therefore, the IL-enriched phase which is the less dense top phase, becomes the bottom phase for TLL 3–5[21].
At smaller TLL values, partitioning of YR is enthalpically driven and for this reason, this dye tends to migrate preferential to the bottom phase due to interactions with the IL. Interestingly, when the TLL increases, the number density of the salt-rich phase is higher than that of IL-rich phase (Table 4) due to the major water content in the bottom phase. Thus, the entropic contribution predominates with regard to the enthalpic contribution, resulting in a decrease inKYRvalues.
Previous studies by Ferreira et al.[4]demonstrated that textile dyes chloranilic acid, indigo blue and sudan III migrate to the superior phase of the IL–ATPS formed from a combination of different IL and electrolytes. Ventura et al. [36] also observed partition coefficient values greater than unity for natural red colorants isolated from fermented broth. These results show the enormous potential of IL for the removal of dyes from industrial effluents.
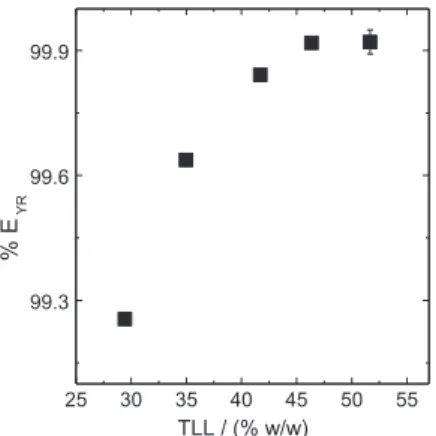
3.7. Extraction efficiency of YR in ATPS
The extraction efficiency (%EYR) of YR is an important parameter
used to evaluate the capacity of ATPS to extract this dye from aqueous matrices to the upper phase of the ATPS. For all of the ATPS composed of polymer and salt, the %EYRobtained was equal to
superior than 97% and highlighting furthermore the potential of this method. The only exception was the TLL 1 to the system PEG 1500 + sodium tartrate + water, which was 87%. The %EYRin the
system formed from PEG 1500 + LiSO4+ H2O as a function of the TLL
is shown inFig. 6.
For this system, the %EYRvalues are superior than 99% and show
clearly the high capacity of the ATPS to remove and extract YR.
[(Fig._4)TD$FIG]
25 30 35 40 45 50 55 0
100 200 300 400
KYR
TLL / (% w/w)
Fig. 4.Effect of anion of the salt forming ATPS on the YR partition behavior: (^) PEG 1500 + Na2SO4+ H2O, (b) PEG 1500 + NaH2C6H5O7+ H2O, (^) PEG
1500 + Na2C4H4O62H2O + H2O.
[(Fig._5)TD$FIG]
40 45 50 55 60 65 0.04
0.08 0.12 0.16 0.20
KYR
TLL / (% w/w)
Fig. 5.Effect of cation of the salt forming ATPS on the YR partition behavior: (") [Bmim]BF4+ MnSO4+ H2O, (") [Bmim]BF4+ (NH4)2SO4+ H2O.
[(Fig._6)TD$FIG]
25 30 35 40 45 50 55 99.3
99.6 99.9
% E
YR
TLL / (% w/w)
Notably, at thefirst TLL, the %EYRis 99.2. This is a very positive
result when we consider future applications on a large industrial scale given how at the first TLL, the concentration of the components that form the ATPS are lower and so improve the cost benefit of the process for treating effluents.
On the other hand, in the case of IL–ATPS when the TLL increased, the %EYRalso increased from 7.07 to 9.12 in [Bmim]
BF4+ (NH4)2SO4+ water and decreased from 15.8 to 8.65 in [Bmim]
BF4+ MnSO4+ water, demonstrating the potential removal of YR in
aqueous matrices to the lower phase of the IL–ATPS. 3.8. Recovery of YR in presence of waste water
To determine the concentration of YR in the presence of textile effluent without matrix effects, the standard addition method was performed. The waste water stock solution was used as solvent to prepare the ATPS. The partition coefficients revealed the dye partitions toward the top phase of the ATPS, as shown inFig. 7.
Table 5shows the results for our recovery studies in wastewater samples. The results indicate that in the case of the effluent sample, in spite of the presence of other components (i.e. metals, surfactants and other dyes) this ATPS is able to remove the dye with extraction efficiency close to 100% for all TLL evaluated.
4. Conclusion
This work demonstrates the possible use of ATPS as a methodology for the removal of the synthetic dye YR from wastewater. Several parameters were evaluated in order to understand the partitioning of YR in ATPS. Thermodynamic parameters such as
D
trGwere determined and used inconjunc-tion with the Johansson model to explain particonjunc-tioning behaviors. This model reveals that the higher concentration of YR in the top phase in polymer–ATPS systems is enthalpically directed. In contrast, the dye moves to the bottom phase of ATPS that contain IL. Interestingly, the driving force that governs this process depends on the salt that is utilized in this mixture and the difference between the intensive thermodynamic properties of ATPS phases (TLL).
Maximum values forKYRwere observed for ATPS formed by PEG
1500 + Li2SO4+ H2O and for this system, a strong Li+cation effect
was noted. The molecular mass of the polymer and the nature of the anion showed no significant effect on the YR partitioning behavior. This system was applied with success to the removal of YR from wastewater. The highKYRvalues in the presence of the
effluent demonstrate the potential of the ATPS in the treatment of effluents from textile industries.,
Acknowledgements
The authors are thankful to the Rede Mineira de Química (RQ-MG),Fundação de Amparo à Pesquisa do Estado de Minas Gerais (FAPEMIG) and Conselho Nacional de Desenvolvimento Científico e Tecnológico (CNPq) under project code 472370/2013-8 for finan-cial support. Authors gratefully acknowledge the generous financial support from the Universidade Federal de Ouro Preto and the Conselho Nacional de Desenvolvimento Científico e Tecnológico (CNPq) for graduate research studentships and bursaries.
References
[1]Z. Aksu, Process Biochem. 40 (2005) 997–1026. [2]D. Charumathi, N. Das, Desalination 285 (2012) 22–30.
[3]W.T. Tsai, C.Y. Chang, C.H. Ing, C.F. Chang, J.,Colloid Interface Sci. 275 (2004) 72–78.
[4]A.M. Ferreira, J.A.P. Coutinho, A.M. Fernandes, M.G. Freire, Sep. Purif. Technol. 128 (2014) 58–66.
[5]T. Robinson, G. McMullan, R. Marchant, P. Nigam, Bioresour. Technol. 77 (2001) 247–255.
[6]N.K. Rotte, S. Yerramala, J. Boniface, V.V.S.S. Srikantha, Chem Eng. J. 258 (2014) 412–419.
[7]K. Govindan, Y. Oren, M. Noel, Sep. Purif. Technol. 133 (2014) 396–406. [8]Q. Wang, D.H. Zhang, S. Tian, P. Ning, J. Appl. Polym. Sci. 131 (2014)
41029.
[9]A. Mukimin, H. Vistanty, N. Zen, Chem. Eng. J. 259 (1) (2015) 430–437. [10]S. Danwittayakul, M. Jaisai, J. Dutta, Appl. Catal. B Environ. 163 (2015) 1–8. [11]G.D. Rodrigues, M.C.H. da Silva, L.H.M. da Silva, F.J. Paggioli, L.A. Minim, J.S.D.
Coimbra, Sep. Purif. Technol. 62 (2008) 687–693.
[12]K.E. Gutowski, G.A. Broker, H.D. Willauer, J.G. Huddleston, R.P. Swatloski, J.D. Holbrey, R.D. Rogers, J. Am. Chem. Soc. 125 (2003) 6632–6633.
[13]Y.F. Deng, T. Long, D.L. Zhang, J. Chen, S.C. Gan, J. Chem. Eng. Data 54 (2009) 2470–2473.
[14]A.B. Mageste, L.R. de Lemos, G.M.D. Ferreira, M.D.H. da Silva, L.H.M. da Silva, R.C.F. Bonomo, L.A. Minim, J. Chromatogr. A 1216 (2009) 7623–7629. [15]A.B. Mageste, T.D.A. Senra, M.C.H. da Silva, R.C.F. Bonomo, L.H.M. da Silva, Sep.
Purif. Technol. 98 (2012) 69–77.
[16]R.L. de Souza, V.C. Camposa, S.P.M. Ventura, C.M.F. Soares, J.A.P. Coutinho, A.S. Lima, Fluid Phase Equilibr. 375 (2014) 30–36.
[17]E.B. Júnior, M.S. Matsuo, M. Walz, A.F. da Silva, C.F. da Silva, Acta Sci. Technol. 31 (2009) 185–193.
[18]B.E.L. Baeta, H.J. Luna, A.L. Sanson, S.Q. Silva, S.F. Aquino, J. Environ. Manag. 128 (2013) 462–470.
[19]H.B. Sales, V. Bouquet, S. Deputier, S. Ollivier, F. Gouttefangeas, M. Guilloux-Viry, V. Dorcet, I.T. Weber, A.G. de Souza, I.M.G. dos Santos, Solid State Sci. 28 (2014) 67–73.
[20]A.K. Burrell, R.E. Del Sesto, S.N. Baker, T.M. McCleskey, G.A. Baker, Green Chem. 9 (2007) 449–454.
[21]B.G. Alvarenga, L.S. Virtuoso, N.H.T. Lemes, P.O. Luccas, J. Chem. Thermodyn. 61 (2013) 45–50.
[22]C.P. Carvalho, J.S.R. Coimbra, I.A.F. Costa, L.A. Minim, L.H.M. Silva, M.C. Maffia, J. Chem. Eng. Data 52 (2007) 351–356.
[23]J.P. Martins, C.P. Carvalho, L.H.M. da Silva, J.S.R. Coimbra, L.H.M. da Silva, G.D. Rodrigues, L.A. Minim, J. Chem. Eng. Data 53 (2008) 238–241.
[24]J.P. Martins, F.C. de Oliveira, J.S.R. Coimbra, L.H.M. da Silva, M.C.H. da Silva, I.S.B. do Nascimento, J. Chem. Eng. Data 53 (2008) 2441–2443.
[25]P.R. Patrício, A.B. Mageste, L.R. de Lemos, R.M.M. de Carvalho, L.H.M. da Silva, M.C.H. da Silva, Fluid Phase Equilibr. 305 (2011) 1–8.
[26]Y. Wang, X.H. Xu, Y.S. Yan, J. Han, Z.L. Zhang, Thermochim. Acta 501 (2010) 112–118.
[27]L.R. de Lemos, P.R. Patrício, G.D. Rodrigues, R.M.M. de Carvalho, M.C.H. da Silva, L.H.M. da Silva, Fluid Phase Equilibr. 305 (2011) 19–24.
[28]H.O. Johansson, G. Karlstrom, F. Tjerneld, C.A. Haynes, J. Chromatogr. B 711 (1998) 3–17.
[29]G.D. Rodrigues, L.R. de Lemos, L.H. da Silva, M.C. da Silva, J. Chromatogr. A 1279 (2013) 13–19.
[30]L.H.M. da Silva, W. Loh, J. Phys. Chem. B 104 (2000) 10069–10073. Table 5
Recovery values of the YR for PEG 1500 + Li2SO4+ H2O ATPS at 298 K.
TLL (%m/m) Top phase recovery (%)
29.43 100.50.5
34.97 103.20.9
41.71 94.70.7
46.36 99.70.3
51.67 98.20.7
[(Fig._7)TD$FIG]
25 30 35 40 45 50 55 0
200 400 600 800 1000
TLL / (% w/w)
K
YR
Fig. 7.Partition behavior of YR in presence of wastewater.
[31]P.A. Albertsson, A. Cajarville, D.E. Brooks, F. Tjerneld, Biochim. Biophys. Acta 926 (1987) 87–93.
[32]M.Y. Shao, X.L. Zhang, N. Li, J.Y. Shi, H.J. Zhang, Z.B. Wang, H.Q. Zhang, A.M. Yu, Y. Yu, J. Chromatogr. B 961 (2014) 5–12.
[33]Y.M. Lu, W.J. Lu, W. Wang, Q.W. Guo, Y.Z. Yang, Talanta 85 (2011) 1621–1626.
[34]U. Novak, A. Pohar, I. Plazl, P. Znidarsic-Plazl, Sep. Purif. Technol. 97 (2012) 172–178.
[35]X. Yang, S.H. Zhang, W. Yu, Z.L. Liu, L. Lei, N. Li, H.Q. Zhang, Y. Yu, Talanta 124 (2014) 1–6.
[36]S.P.M. Ventura, V.C. Santos-Ebinuma, J.F.B. Pereira, M.F.S. Teixeira, A. Pessoa, J.A.P. Coutinho, J. Ind. Microbiol. Biotechnol. 40 (2013) 507–516.