Thermodynamics and optimization of norbixin transfer processes in aqueous
biphasic systems formed by polymers and organic salts
Aparecida Barbosa Mageste
a, Tonimar Domiciano Arrighi Senra
a, M. Carmo Hespanhol da Silva
a,
Renata Cristina Ferreira Bonomo
b, Luis Henrique Mendes da Silva
a,⇑aGrupo de Química Verde Coloidal e Macromolecular, Departamento de Química, Ciências Exatas e Tecnológicas, Universidade Federal de Viçosa, Av. P.H. Rolfs s/n, Viçosa,
MG 36560-000, Brazil
bLaboratório de Engenharia de Processos, Universidade Estadual do Sudoeste da Bahia, Brazil
a r t i c l e
i n f o
Article history:
Received 3 January 2012
Received in revised form 3 June 2012 Accepted 8 June 2012
Available online 21 June 2012
Keywords:
Aqueous two-phase systems Norbixin
Purification Partition Green chemistry
a b s t r a c t
Partitioning of the natural dye norbixin has been studied in aqueous two-phase system (ATPS) that are formed by mixing aqueous solutions of a polymer (or copolymer) and an organic salt (sodium tartrate or succinate). In this work, the norbixin partition coefficient (KN) was optimized, taking into account the variables of polymer concentration, salt concentration and pH. It was found thatKNis highly depen-dent on the electrolyte nature, system hydrophobicity and TLL values. Testing producedKNvalues between 8 and 130, indicating the great potential of ATPS as a method for norbixin pre-concentration/ purification. Thermodynamic transfer parameters (DtrG,DtrH,DtrS) indicate that the preferential concen-tration of norbixin in the top phase is favored by enthalpic and entropic contributions.
Ó2012 Elsevier B.V. All rights reserved.
1. Introduction
Annatto is a natural dye obtained from the pericarp of the seeds ofBixa orellana L. This tropical tree is native to the forests of Central and South America and is widely used in many industrial sectors
[1–3]. It can also be found as a component of dye-sensitized cells
(DSC)[4,5], and some experiments report the biological activity of these cells against certain microorganisms that act on the fermentation of industrial products[2]. Currently, Brazil is the larg-est producer of annatto seeds, where it accounts for approximately 70% of all annatto produced worldwide.
The main pigments extracted form annatto seeds are the carote-noids cis-bixin and cis-norbixin (Fig. 1). The first is a fat-soluble compound and is a major component in the extracts obtained when preparing oily suspensions or organic solvents. Cis-norbixin is a water-soluble compound and is thus found mainly in the form of alkaline solution extracts[2].
The extraction of annatto pigment is accomplished by mechan-ical (e.g., spouted bed) or solvent extractions[6,7]. However, these processes do not ensure standardization of the final product or yield a high-purity extract. Therefore, new techniques for the extraction and purification of annatto have been pursued. This trend has been
observed for various dyes of natural origin; these new methods pro-vide improved efficiency and are more environmentally friendly
[6,8–13].
Techniques for liquid–liquid extraction, especially with the use of organic solvents, are effective to separate and pre-concentrate compounds of interest[14]. However, this water/oil biphasic sys-tem has a large disadvantage in its use of organic solvents, which may cause environmental and health problems because many are toxic, flammable and carcinogenic. Thus, there is an increased search for alternative processes for bixin (or norbixin) liquid–liquid extraction. In the last decade, researchers have started using Aque-ous Two-Phase Systems (ATPS) for dye purification[8,13–16]. ATPS are liquid biphasic systems formed by mixing aqueous solutions of two chemically distinct polymers, or a combination of an aqueous solution of a polymer and an aqueous solution of certain types of electrolytes[17].
Recent studies have been carried out to apply ATPS for the extraction/purification of natural dyes [8,18–22]. However, none of the early studies determined the motriz power responsible for the spontaneous transference of natural dye in ATPS. The present work offers a thermodynamic study and optimization of the nor-bixin partition behavior in different ATPS as a function of the following factors: polymer concentration, salt concentration and pH of the system using a Central composite face-centered (CCF) design and response surface methodologies. Using this strategy, the key variables affecting the norbixin partition behavior were
1383-5866/$ - see front matterÓ2012 Elsevier B.V. All rights reserved.
http://dx.doi.org/10.1016/j.seppur.2012.06.012
⇑ Corresponding author. Tel.: +55 31 38993052; fax: +55 31 38992175.
E-mail address:[email protected](L.H.M. da Silva).
Contents lists available atSciVerse ScienceDirect
Separation and Purification Technology
identified optimizing the number of experiments required. In addi-tion, it was possible to establish mathematical models that consis-tently represent the processes used allowing the determination of independent variables maximizing or minimizing the variable responses values in the range studied. In these cases if the quadratic terms for the study variables are not significant this fact does not invalidate the use of models, as can be seen in several studies
[23–26]. This work is intended to provide a better understanding
of the factors that govern the partitioning of this dye to enable the development of a system that is as efficient as possible for the extraction/purification processing of norbixin.
2. Experimental section
2.1. Materials
Poly(ethylene oxide) (PEO), with molar masses of 1500 and 4000 g mol1, and poly(propylene oxide) (PPO), with a molar mass of 400 g mol1, were obtained from Isofar (Duque de Caxias, Brazil) and Sigma (St. Louis, MO, USA), respectively. The triblock copoly-mer L35 was purchased from Aldrich (St. Louis, MO, USA) and had an average molar mass of 1900 g mol1. This copolymer had the following nominal composition: (EO)11(PO)16(EO)11. All macromo-lecular compounds were used as purchased. The organic salts so-dium tartrate (tartNa; C4H4O6Na22H2O; 99%) and sodium succinate (succNa; C4H4O4Na26H2O; 99%) were purchased from Vetec (Rio de Janeiro, Brazil). All salts present were of analytical grade and were used without prior purification. Distilled water was used in all experiments. The alkaline solution of annatto was courtesy of Hansen Ind. Com. Ltda. (Valinhos, SP, Brazil).
2.2. Aqueous two-phase systems and norbixin partition coefficient
The global compositions of ATPS (PEO1500 + sodium tar-trate + H2O, PEO1500 + sodium succinate + H2O, PEO4000 + sodium tartrate + H2O, PPO400 + sodium tartrate + H2O, and L35 + sodium tartrate + H2O) were obtained from their phase diagrams, as found in the literature [27–29]. Solutions of specific concentrations of polymer (or copolymer) and salt (sodium tartrate or sodium succi-nate) were prepared to yield a total of 6.00 g of an ATPS that fea-tured the desired overall composition. Then 0.0120 g of NaOH (3.00 mol L1) and 0.300 g of alkaline extract of annatto were added
to the system to enable quantification of the annatto extract in two phases. The ATPS was shaken manually for 30 s and allowed to stand for 24 h until reaching thermodynamic equilibrium. For each global composition, the overall procedure was carried out in triplicate.
Aliquots of the top and bottom phases were collected and diluted with distilled water at 20 and 1.2 times, respectively. The absorbance of the diluted aliquots at 482 nm was determined using a UV–Vis spectrophotometer (2500 Shimadzu). The norbixin partition coefficient (KN) was calculated using following equation:
KN¼
AbsU482 nm
fdU
AbsL482 nm
ðfdLÞ ð
1Þ
whereAbsU
482 nm andAbs L
482 nm are the absorbance values from the top and bottom phase of the norbixin andfdUandfdLare the dilu-tion factors of the phases, respectively.
2.3. Optimization of the norbixin partition
Optimization of the norbixin partition in ATPS PEO1500 + so-dium tartrate + H2O, PEO1500 + sodium succinate + H2O and PPO400 + sodium tartrate + H2O at the studied conditions was per-formed using a central composite face-centered (CCF) design and response surface analysis[24]. The CCF design is suitable to verify the influence of electrolyte and polymer concentrations, as well as the system pH, on the norbixin distribution in the ATPS. Each factor was assessed at three levels (1, 0, + 1) and planning consisted of 18 experimental points, as shown inTable 1. Based on the behavior ofKNas a function of the experimental section, a mathematical
Fig. 1.Chemical structure of apocarotenoids cis-bixin (A) and cis-norbixin (B),
which are the main pigments of the annatto seed pod.
Table 1
Values of the non-coded and coded variables of the ATPS.
Variables Level and range
1 +1
Concentration of sodium tartrate (X1, %) 11.43 13.93
Concentration of PEO1500 (X2, %) 18.25 24.68
pH (X3) 10.50 12.00
Concentration of sodium succinate (X1, %) 12.91 13.78
Concentration of PEO1500 (X2, %) 23.35 25.27
pH (X3) 10.50 12.00
Concentration of sodium tartrate (X1, %) 6.74 8.81
Concentration of PPO400 (X2, %) 27.22 42.01
pH (X3) 10.50 12.00
Table 2
Response obtained for the ATPS studied at different levels of polymer/salt. Test Treatment X1 X2 X3 PEO=KtartNa
N
PEO=succNa
KN
PPO=tartNa
KN
model (Eq.(2)) was developed to describe the value ofKNas a func-tion of factors.
K¼bOþXbiXiþ
X
biiX2
i þ
X
bijXiXj ð2Þ
wherebo,bi,biiandbijrepresent the constant effect of the process, linear, quadraticXiand the effect of interaction betweenXiandXjin the partition coefficient, respectively.
2.4. Thermodynamic parameters of the norbixin partition
2.4.1. Norbixin transfer Gibbs free energy change (DtrG)
The Gibbs free energy change (DtrG) was calculated from values of the norbixin partition coefficient (KN), which were obtained for all points of the ATPS studied, through the following thermody-namic relationship
D
trG¼ RTlnKN ð3ÞwhereDtrGis the Gibbs free energy change due to the process of 1 mol of norbixin transfer from the bottom to the top phase of the ATPS;Tis the absolute temperature, at which the experiment was performed (298 K);Ris the real gas constant; andKNis the nor-bixin partition coefficient.
2.4.2. Norbixin enthalpy change of transfer (DtrH)
Isothermal titration calorimetry (ITC) measurements were con-ducted in a microcalorimeter CSC-4200 (Science Corp. Calorimeter) to determine the norbixin enthalpy change of transfer from the bottom phase to the top phase. The experimental procedure con-sisted of adding 0.900 mL of bottom phase and 0.900 mL of top phase to the reference and sample cells of the microcalorimeter. Subsequently, two 100-
l
L additions of a mixture of FI and annatto extract (100:1 m/m) were added to the sample cell. The flow of en-ergy registered during the whole process was regarded as numer-ically equal to the enthalpy change of the system,DobsH. Division ofDobsHby the amount of norbixin transferred resulted in the en-thalpy change of transfer of norbixin[30].2.4.3. Norbixin entropy change of transfer (DtrS)
The norbixin entropy change of transfer was determined from the following classic thermodynamics relationship:
D
trG¼D
trHTD
trS ð4ÞwhereDtrGand the values ofDtrHare known.
3. Results and discussion
3.1. Optimization of the norbixin partition coefficient
Table 2presents the experimental coded points, as well as the
values ofKNobtained at each point, for the three ATPS evaluated. A quick analysis of these data reveals that an increase in electrolyte concentration (tests 1 and 5) caused an increase inKNfor ATPS PEO1500 + sodium tartrate + H2O and PPO400 + sodium tar-trate + H2O, as well as a reduction ofKNfor the ATPS PEO1500 + so-dium succinate + H2O, where the values of the partition coefficient changed from 25.8, 36.1 and 7.88 for 123, 17.0 and 32.0, respec-tively. The effect of polymer concentration onKNvalue can be seen in tests 1 and 3, where again there was an increase in the value ofKN for the first two ATPS and a reduction ofKNfor the last ATPS. In this case, theKNvalues were 25.8, 7.88 and 36.1 for 164, 20.3 and 31.4, respectively. The influence of system pH on the norbixin partition was observed through tests 1 and 2, which exhibited a reduction in theKNvalue for the ATPS PEO1500 + sodium tartrate + H2O and an increase inKNfor the ATPSs PPO400 + sodium tartrate + H2O
and PEO1500 + sodium succinate + H2O, as the values ranged from 25.8, 7.88 and 36.1 to 12.4, 10.8 and 93.4.
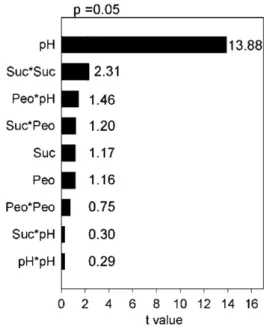
Pareto charts (Figs. 2–4) were drawn from a statistical analysis of the results inTable 2. This type of chart shows what variables and interaction effects influence the norbixin partition [26,31]. From an analysis of the Pareto charts, it is clear that there is an influence by the polymer and electrolyte concentrations and an interaction effect between them on the norbixin distribution behavior in the ATPSs PEO1500 + sodium tartrate + H2O and PPO400 + sodium tartrate + H2O. In the ATPS PEO1500 + sodium succinate + H2O, the norbixin distribution is affected by the pH of the system and by the square of the electrolyte concentration.
Based on information from the Pareto chart for each ATPS, a reduced linear mathematical model was developed (Table 3); such models describe the value ofKNas a function of variables[32,33].
Fig. 2.Pareto chart of the variables analyzed for the partition of norbixin in the
ATPS PEO1500 + sodium tartrate + H2O.
Fig. 3.Pareto chart of the variables analyzed for the partition of norbixin in the
The statistical significance of each model was assessed by an anal-ysis of variance (ANOVA) using Ficher’s statistical test (Table 4–6). The models for all systems were found to be statistically valid,
exhibitingp-values less than 0.05. A lack-of-fit test was evaluated and, in some cases,p-values greater than 0.05 were obtained, show-ing that the lack-of-fit was not significant.
3.1.1. Response surface analysis
Using mathematical models, it was possible to obtain a response surface for the norbixin partition (Figs. 5–7)[23,34]. As shown inFig. 5,KNwas found to increase with rising concentrations of PEO1500 and sodium tartrate, where a value of 23.8 was found with the lowest concentrations of PEO1500 and sodium tartrate. For the largest concentration values of these compounds, aKNof 188 was observed. A more detailed analysis ofFig. 5indicates that the norbixin partition coefficient in ATPS PEO1500 + sodium tar-trate + H2O can be improved because of the linear relationship be-tween polymer and electrolyte concentrations and the value ofKN. However, practical issues do not enable the construction of ATPS with polymer and electrolyte concentrations higher than those dem-onstrated here. Thus, an overall composition equal to 25.0% (m/m) by weight of polymer and 14.0% (m/m) of sodium tartrate was found to represent the optimal condition for the norbixin partition.
Identical behavior was observed for ATPS PPO400 + sodium tar-trate + H2O (Fig. 7), where theKNvalue was equal to 7.80 when the ATPS had low polymer and electrolyte concentrations. On the other hand, the ATPS formed with the largest concentration of macromol-ecule and salt had aKNvalue equal to 23.3. Again, this system is
Fig. 4.Pareto chart of the variables analyzed for the partition of norbixin in the
ATPS PPO400 + sodium tartrate + H2O.
Table 3
Mathematical models adjusted for the evaluated factors and the partition coefficient of norbixin (KN).
KPEO/TartNa=1979.85715 + 142.86000X1+ 83.61790X25.50928X1X2
KPEO/SuccNa= 6492.132561029.26712X1+ 42.16603X3+ 38.33456X1X1
KPPO/TartNa=58.86750 + 7.65124X1+ 1.67108X20.15675X1X2
whereX1: tartNa concentration % (m/m);X2: PEO concentration % (m/m),X3: pH;
KPEO/TartNa,KPEO/SuccNa,KPPO/TartNa: partition coefficient of the norbixin on the ATPS
PEO1500 + tartNa + H2O; PEO1500 + succNa + H2O e PPO400 + tartNa + H2O,
respectively.
Table 4
ANOVA results for the ATPS PEO1500 + sodium tartrate + H2O.
Source DF Variation (sum of squared deviations)
Mean-squared deviation
Fcalc p-Value
Model 14 32951.000 10984.000 20.99 <0.0001 Error 3 7326.992 523.357 – – Lack of
adjust
11 2322.912 211.174 0.13 0.9956 Residual
error
3 5004.079 1668.027 – –
Total 17 40277.673 – – –
Table 5
ANOVA results for the ATPS PEO1500 + sodium succinate + H2O.
Source DF Variation (sum of squared deviations)
Mean-squared deviation
Fcalc p-Value
Model 14 10306.000 3435.262 68.33 <0.0001 Error 3 703.813 50.272 – – Lack of
adjust
11 623.128 56.648 2.11 0.294 Residual
error
3 80.686 26.895 – –
Total 17 11009.599 – – –
Table 6
ANOVA results for the ATPS SAB PPO400 + sodium tartrate + H2O.
Source DF Variation (sum of squared deviations)
Mean-squared deviation
Fcalc p
-Value Model 14 176.462 58.821 9.01 0.0014 Error 3 91.404 6.529 – – Lack of
adjust
11 72.645 6.604 1.06 0.54 Residual
error
3 18.759 6.253 – –
Total 17 267.865 – – –
Fig. 5.Response surface for theKNin ATPS PEO1500 + sodium tartrate + H2O as a
impractical for the formation of an ATPS with polymer and electro-lyte concentrations higher than the constructed figures, which do not allow a partition coefficient greater than 23.3. Thus, the optimal point for the ATPS PPO400 + sodium tartrate + H2O was found to be with an overall composition of 42.0% (m/m) PPO400 and 8.70% (m/ m) sodium tartrate.
Fig. 6shows the response surface for the ATPS PEO1500 +
so-dium tartrate + H2O as a function of system pH and electrolyte con-centration, with the polymer concentration fixed at 23.3% (m/m) by mass. Higher system pH values were found to result in greater values ofKN. Furthermore, the lowest and highest concentrations
of electrolyte [i.e., 12.8% (m/m) and 13.8% (m/m), respectively] pro-vided the highest partition coefficient values. Thus, with a salt concentration equal to 12.8% (m/m) and system pH at 10.5, the
KNvalue would be equal to 36.1. Likewise, raising the pH to 12.5 while maintaining a fixed electrolyte concentration would increase the value ofKNto 93.4. This yields the optimal point for the nor-bixin partition, in which the ATPS can be improved by increasing the working pH and keeping the polymer and electrolyte concen-trations equal to 23.3% (m/m) and 12.8% (m/m), respectively.
3.2. Thermodynamic parameters of norbixin transfer
Fig. 8shows the values of the norbixin Gibbs free energy change
of transfer (DtrG) at 25°C as a function of the TLL value for all the ATPS studied. These results show a reduction in theDtrGvalue with increasing TLL, except for the ATPS PPO400 + sodium tartrate + H2O. For the ATPS PEO1500 + sodium succinate + H2O, a critical TLL value was observed, from which there was a slight increase in the value of DtrG. Despite this, we found that the polymer size did not signifi-cantly influence the norbixin partition (Fig. 8). As shown inFig. 8, there was a decrease in the tendency of norbixin to partition into a top phase because of the presence of segments of propylene oxide (DtrGPEO<DtrGL35<DtrGPPO) for the succinate anion (DtrGtartrate<DtrGsuccinate).As is well known, the Gibbs free energy change of transferðDtrGÞcan be divided into two contributions: (1) the enthalpy change (ðDtrHÞ) and (2) the entropy change (ðDtrSÞ).
Fig. 6.Response surface for theKNin ATPS PEO1500 + sodium succinate + H2O as a
function of salt concentration and pH, as expressed in non-coded levels.
Fig. 7.Response surface for theKNin ATPS PPO400 + sodium tartrate + H2O as a
function of PEO1500 concentration and salt concentration, as expressed in non-coded levels.
30 45 60 75
-12 -10 -8 -6
∆
tr
G /
(
kJ mol
-1 )
TLL / % (m/m)
Fig. 8.Variation of Gibbs free energy of transfer for norbixin depending on the
value of the Tie Line Length (TLL). ATPS: (j) PEO1500 + tartNa + H2O; (h)
PEO1500 + succNa + H2O; (N) PEO4000 + tartNa + H2O; () PPO400 + tartNa + H2O;
(s) L35 + tartNa + H2O, at 25°C.
Table 7
Thermodynamic parameters obtained for the transfer of norbixin for all ATPS studied. ATPS TLL Thermodynamic parameters
DtrG
(kJ mol1)
DtrH
(kJ mol1)
TDtrS
(kJ mol1)
PEO1500/tartNa 28.80 7.55 ± 0.35 3.69 ± 0.61 3.86 ± 0.70 50.34 11.95 ± 0.96 6.88 ± 0.70 5.07 ± 1.19 PEO1500/
succNa
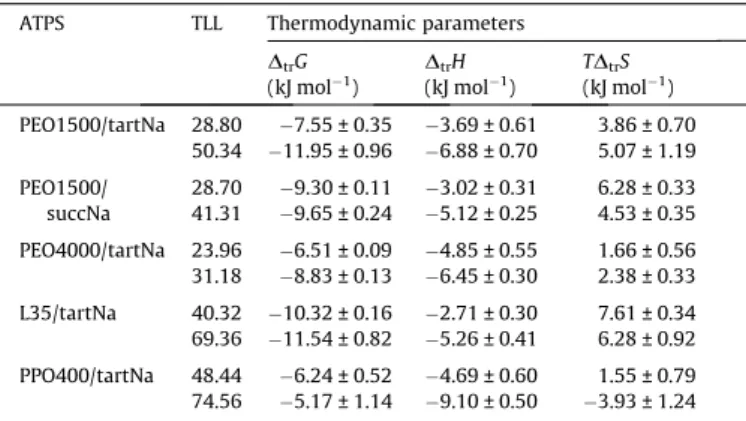
Table 7shows the thermodynamic parametersDtrG,ðDtrHÞandDtrS obtained for the first and last TLL values for all of the systems in place. As shown, it was observed that the norbixin transfer process from the bottom phase to the top phase was favored by both enthal-pic and entroenthal-pic factors.
The results ofðDtrHÞ, as obtained by microcalorimetry experi-ments, revealed that the transfer process studied is exothermic. These results show energy values ranging from2.71 kJ mol1on the first TLL of ATPS L35 + sodium tartrate + H2O to9.10 kJ mol1 on the fifth TLL of the ATPS PPO400 + sodium tartrate + H2O. An-other trend that was observed for ðDtrHÞ was an increase in its modulus with increasing TLL. In other words, there was a greater release of energy when the systems were prepared from higher global compositions. The distribution of solutes between the ATPS phases can be understood in terms of the destruction/formation of intermolecular interactions that occurs during the norbixin trans-fer process [35,36]. The associated enthalpy change mainly in-volves four pairs of interaction terms (Eq.(5)).
D
trH¼D
N—SHþD
w—SHþD
N—MacroHþD
w—MacroH ð5ÞwhereDijHrepresents the enthalpy of interaction between compo-nentsiandj. These components are water (w), salts (S), macromol-ecules (Macro) and norbixin (N).In the process of norbixin transfer from the bottom phase (salt-enriched) to the top phase (polymer-enriched), interactions are formed between dyes/macromolecules and water/salts. Thus, the termsDw—SH andDN—MacroHcontribute to a reduction of the system total enthalpy, as these promote the re-lease of energy. The termsDN—SHandDw—MacroHrepresent interac-tions that are broken in the transfer process and therefore contribute to an increase in system enthalpy. Based on the negative microcalorimetricDtrHresults, the following relationship between the interaction terms can be drawn:
j
D
w—MacroHþD
N—SHj<jD
N—MacroHþD
w—SHj ð6ÞThus, analysis of the DtrH values for the first TLL of ATPS PEO1500 + sodium tartrate + H2O and PEO1500 + sodium succi-nate + H2O shows that the presence of the first anion instead of the second promotes a lesser release of energy. This lowering is due to an H2O–S interaction that is stronger and/or N–S that is weaker for the tartrate anion than for the succinate anion. Analysis of the first TLL of ATPS PEO1500 + sodium tartrate + H2O and the fifth TLL of the ATPS PPO400 + sodium tartrate + H2O revealed that interactions between the macromolecule and the chemical species (H2O or ions) were enthalpically less intense for the second system. This effect is mainly due to the presence of propylene oxide seg-ments. Thus, when calculating the sum of the energy released and absorbed (Eq.(6)) during the transfer process, the obtained va-lue ofDtrHis more negative for the system formed by PPO400 + so-dium tartrate + H2O.The term DtrS relates to an increase or decrease in the number of different possibilities for distributing the components present in the system, which occurs due to the transfer of norbixin molecules from the bottom phase to the top phase. As shown inTable 7, the transfer process was observed to occur withDtrS> 0.
D
trS¼D
trSNþD
trSChem:specie ð7ÞwhereDtrSNis the variation of entropy due to the transference of norbixin molecules from the bottom phase to the top phase, and DtrSChem:specie is the entropy change due to chemical species (e.g., water, polymer, salt) that move between phases simultaneously to norbixin transfer process.To analyze these thermodynamic trans-fer parameters (DtrHandDtrS), we used the thermodynamic model of Johansson et al.[37], which describes the distribution of solutes in ATPS as a function of the enthalpic and entropic drives. The idea of this model is to separately evaluate the enthalpic and entropic
contributions for the partition coefficient of the solute. The contri-bution of entropy for the norbixin partition is given by following equation:
lnKN¼
MN
q
nU VU nL VLð8Þ
whereMNis the norbixin molecular weight;nUandnLare the total number of molecules in the top and bottom phases, respectively, which are divided by theVUandVLstem density number of each phase; and
q
is the total number density of the system, which is determined by the ratio between the total number of particles pres-ent and the total volume occupied by the system.The enthalpic factor related to the same thermodynamic pro-cess is given by the equation below:
lnKN¼
MN
RT Xm
i¼1ði–NÞ
U
UiU
LiWiN
X
m
i¼1ði–NÞ
X
m1
j¼iþ1ðj–NÞ
U
UiU
UJU
LiU
Lj
Wij ð9Þ
whereUUi andU L
i are the volume fractions of components that form the ATPS top and bottom phases, respectively;WIJis the energy in-volved in the formation of the effective pair potential, which is de-fined as Wij¼z½
e
ij ð1=2Þðe
iiþe
jjÞ; z is the number of close neighbors; ande
ijis the potential energy of the pairij.This ther-modynamic model is very useful because inferences can be made about the thermodynamic factor that governs a given thermody-namic process of the partition using simple equations. From Eq.(7), we see that the first term on the right (DtrSN) contributes to the reduction of entropy (Eq.(1)), as the dye is coming from a region of higher number density (bottom phase) and going to a region of lower number density (top phase). The second term of Eq. (7)
(DtrSChem:specie) contributes to the increase of entropy. For example, chemical species (H2O or ions) that were interacting with the mac-romolecule are released into the solution because of the arrival of the solute and migrate to the higher-number-density bottom phase, thus increasing the configurational entropy of the system.After eval-uating the norbixin enthalpy- and entropy-related transfer pro-cesses in these ATPS we conclude that both thermodynamic parameters favor the preferential accumulation of this compound in the top phase. However, the second factor had a greater emphasis on the systems PEO1500 + sodium tartrate + H2O, PEO1500 + so-dium succinate + H2O and PPO400 + sodium tartrate + H2O, with the ATPS showing the greatest value ofDtrSbeing the one with the high-est concentration of norbixin top phase (KPEOþsuccinate> KPEOþtartrate>KPPOþtartrate).This divergence was observed when com-paring the values ofDtrSthat were experimentally obtained by mic-rocalorimetry, as well as theDtrSpredicted by the Johansson model. This effect is produced because the change in thermodynamic entro-py predicted by the model is taken as negative when the solute pref-erentially partitions for the polymeric phase. However, the noted divergence occurs because this model considers only the process of solute molecule transfer toward the evaluation of the total entro-py change of transfer. Yet, the entropic contribution of chemical spe-cies that are affected by the process of norbixin partition should be considered for this thermodynamic parameter.
3.2.1. Effect of polymer size on norbixin partition behavior
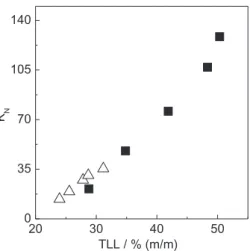
Fig. 9shows the influence of polymer molar mass on the value
of the norbixin partition coefficient in systems such as PEO + so-dium tartrate + H2O. In some results obtained in the literature is observed that, the distribution of a solute in different ATPS is affected by the molar mass of the polymer constituent of the ATPS
[8,37]. In general, an increase in polymer size reduces the solute
caused by a reduction in the solute configurational entropy of transfer because of the increase in the polymer molar mass. How-ever, as noted inFig. 9, no significant change in the value ofKNwas found, which leads us to believe that the enthalpic factor directs the preferential distribution of norbixin to the top phase, and that the entropic contribution is associated mainly with water and ions transference from the top phase to the bottom phase.
3.2.2. Effect of different electrolytes on the partition of norbixin
It is know that the modifications of ATPS components can dras-tically affect the behavior of the solute partition[38,39]. This effect is shown inFig. 10, which assesses the influence of electrolyte an-ion of ATPS on the value ofKNfor different values of TLL. As can be
seen in the ATPS with the tartrate anion (Fig. 11A), theKNvalues increases with increasing TLL values. For the succinate anion
(Fig. 11B), the KN values increased for higher TLL values until
TLL = 36.5% (m/m), and a declining trend for KNvalues was ob-served for TLL values higher than 36.5% (m/m).Fig. 10also shows the balance between enthalpy and entropy that occurs in any ther-modynamic process. The observed trend of increase in KN with increasing TLL value for ATPS PEO1500 + sodium tartrate + H2O is taken to be a demonstration of an enthalpy-governed process. This effect is produced because the values ofKNare always greater than 1.00 and tend to increase with increasing TLL. This behavior occurs because the increasing TLL raises the polymer concentration in the top phase, making the term½Pm
i¼1ði–NÞðU U i U
L
iÞWiNstand on other factors that may influence the partition of the solute of interest. However, for the system PEO1500 + sodium succinate + H2O, en-thalpy prevailed only for smaller values of TLL [at 36.5% (m/m)], and for greater TLL values the entropy began to contribute more significantly to the process of norbixin transfer. This effect was seen in the reduction inKNwith increasing TLL.Increasing the TLL tends to intensify the difference in the amount of water between the top and bottom phases (Table 8), and the termðnU
VUn L VLÞof Eq. (8)becomes more negative in this case. As a consequence of this effect, the transfer of norbixin molecules to the top phase is entro-pically less favored. As shown inTable 8, for similar TLL values the variation in water concentration is higher when the succinate anion is present. Thus, the term related to the entropy was greater in this system than that observed for the system that had the tar-trate anion.
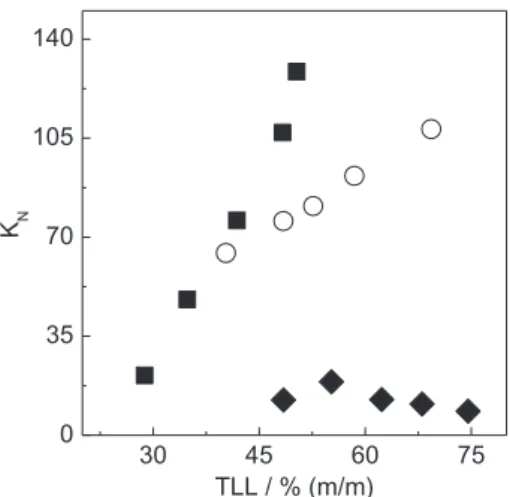
3.2.3. Effect of hydrophobicity on the partitioning of norbixin
Fig. 12shows the dependence of the norbixin partition
coeffi-cient on the length of the Tie Line Length (TLL) for the ATPSs PEO1500 + sodium tartrate + H2O, L35 + sodium tartrate + H2O and PPO400 + sodium tartrate + H2O. This effect can be seen in the norbixin transfer from the bottom to the top phases. This trans-fer is reduced with increasing hydrophobicity of the polymeric phase. The increase in hydrophobicity is related to the content of propylene oxide (–PO–) segments in the macromolecules, and the abundance of –PO– in the polymer/copolymer is given in the following order: PPO > L35 > PEO. The addition of –PO– segments in the macromolecule ultimately generates a reduction in the mac-romolecule charge density. This effect is the same as that for the cations present in the environment, which tend to interact with
20 30 40 50
0 35 70 105 140
KN
TLL / % (m/m)
Fig. 9.Effect of the polymer molecular weight of PEO on the partition coefficient of
norbixin (KN) according to the Tie Line Length (TLL). ATPS: (j) PEO1500 +
tart-Na + H2O and (D) PEO 4000 + tartNa + H2O.
30 40 50
0 35 70 105 140
KN
TLL / % (m/m)
Fig. 10.Influence by the nature of ATPS electrolyte formation on the partition
behavior of the norbixin (KN) according to the Tie Line Length (TLL). ATPS: (j)
PEO1500 + tartNa + H2O and (e) PEO1500 + succNa + H2O.
Fig. 11.Chemical structures of the anions: (A) tartrate and (B) succinate.
Table 8
Difference in the concentration of H2O between the bottom and top phases of the
ATPS, at 25°C.
TLL D½H2O ¼ ½H2OB ½H2OT%ðm=mÞ
TartNa SuccNa
segments of ethylene oxide (–EO–), as evidenced in the calorimet-ric studies carried out by da Silva and Loh[40]. This interaction creates a structure of high positive charge density, which is called a pseudo-polycation. This structure enables interaction with com-pounds that are negatively charged and thus enables its purifica-tion/partition. Thus, the decrease in the partition coefficient of norbixin with increasing hydrophobicity of the polymer is reflected in the reduction of positive charge density experienced by the pseudo-polycation.
4. Conclusion
This study demonstrates the possible use of ATPS as a methodol-ogy for the extraction/partition of the natural dye norbixin, due to the high value found in the dye partition coefficient (8 <KN< 130) in such systems. The optimization of this process by developing mathematical models and graphical response surfaces shows that increases in the concentrations of polymer and electrolyte typically promote increases in the value ofKN. Thermodynamic parameters of transfer (DtrG,DtrH,DtrS) determined in this study reveal that a concentration of norbixin in the top phase is favorable from the standpoint of enthalpy and entropy, and the spontaneity of this top phase concentration increases with increasing difference be-tween the intensive thermodynamic properties of ATPS phases (TLL). Properties such as the polymer hydrophobicity and anionic nature were found to significantly influence the value ofKN.
Acknowledgements
The authors are thankful to the Fundação de Amparo à Pesquisa do Estado de Minas Gerais (FAPEMIG), Conselho Nacional de Desenvolvimento Científico e Tecnológico (CNPq) and Instituto Nacional de Ciências e Tecnologias Analíticas Avançadas (INCTAA) for financial support. A.B.M. is thankful to the Coordenação de Aperfeiçoamento de Pessoal de Nível Superior (CAPES) and T.D.A.S. acknowledges CNPq for scholarships.
References
[1] A.D.O. Rios, A.Z. Mercadante, C.D. Borsarelli, Triplet state energy of the carotenoid bixin determined photoacoustic calorimetry, Dyes Pigments 74 (2007) 561–565.
[2] P.G.P. Rao, T. Jyothirmayi, K. Balaswamy, A. Satyanarayana, D.G. Rao, Effect of processing conditions on the stability of annatto (Bixa orellana L.) dye incorporated into some foods, LWT-food, Sci. Technol. 37 (2005) 779–784.
[3] V. Galindo-Cuspinera, A.S. Rankin, Bioautography and chemical characterization of antimicrobial compound(s) in commercial water-soluble annatto extracts, J. Agric. Food Chem. 53 (2005) 2524–2529.
[4] N.M. Gomez-Ortiz, L.A. Vazquez-Maldonado, A.R. Perez-Espadas, G.J. Mena-Rejon, J.A. Azamar-Barrios, G. Oskam, Dye-sensitized solar cells with natural dyes extracted from achiote seeds, Sol. Energy Mater. Sol. Cell 94 (2010) 40–44. [5] R. Parimalan, P. Giridhar, T. Rajasekaran, G.A. Ravishankar, Annatto fruit pericarp: newer source as a potential fuel, Energy Fuel 21 (2007) 1181–1182. [6] R.W. Alves, A.A.U. de Souza, S.M.D.G.U. de Souza, P. Jauregi, Recovery of norbixin from a raw extraction solution of annatto pigments using colloidal gas aphrons (CGAs), Sep. Purif. Technol. 48 (2006) 208–213.
[7] M.J. Scooter, L.A. Wilson, G.P. Appleton, L. Castle, Analysis of annatto (Bixa orellana L.) food coloring formulations. Determination of coloring components and colored thermal degradation products by high-performance liquid chromatography with photodiode array detection, J. Agric. Food Chem. 46 (1998) 1031–1038.
[8] A.B. Mageste, L.R. de Lemos, G.M.D. Ferreira, M.D.H. da Silva, L.H.M. da Silva, R.C.F. Bonomo, L.A. Minim, Aqueous two-phase systems: an efficient, environmentally safe and economically viable method of purification of natural dye carmine, J. Chromatogr. A 45 (2009) 7623–7629.
[9] M.K. Purkait, S. Dasgupta, S. De, Determination of thermodynamic parameters for the cloud point extraction of different dyes using TX-100 and TX-114, Desalination 244 (2009) 130–138.
[10] S.A.B.V. Melo, G.M.N. Costa, A.C.C. Viana, F.L.P. Pessoa, Solid pure component property effects on modeling upper crossover pressure for supercritical fluid process synthesis: a case study for the separation of annatto pigments using SC-CO2, J. Supercrit. Fluid 49 (2009) 1–8.
[11] E. Akama, A.J. Tong, M. Ito, S. Tanaka, The study of the partitioning mechanism of methyl orange in an aqueous two-phase system, Talanta 48 (1999) 1133– 1137.
[12] G. Muthuraman, K. Palanivelu, Selective extraction and separation of textile anionic dyes from aqueous solution by tetrabutyl ammonium bromide, Dyes Pigments 64 (2005) 251–257.
[13] J.G. Huddleston, H.D. Willauer, K.R. Boaz, R.D. Rogers, Separation and recovery of food coloring dyes using aqueous biphasic extraction chromatographic resins, J. Chromatogr. A 711 (1998) 237–244.
[14] G. Muthuraman, Extractive removal of astacryl blue BG and astacryl golden yellow dyes from aqueous solutions by liquid–liquid extraction, Desalination 277 (2011) 308–312.
[15] J.G. Huddleston, H.D. Willauer, R.D. Rogers, Solvatochromic studies in polyethylene glycol-salt aqueous biphasic systems, J. Chromatogr. B 743 (2000) 137–149.
[16] M.E. Silva, T.T. Franco, Liquid–liquid extraction of biomolecules in downstream processing – a review paper, Braz. J. Chem. Eng. 17 (2000) 1–17.
[17] G.D. Rodrigues, M.D.H. da Silva, L.H.M. da Silva, F.J. Paggioli, L.A. Minim, J.S.D. Coimbra, Liquid–liquid extraction of metal ions without use of organic solvent, Sep. Purif. Technol. 62 (2008) 687–693.
[18] Y. Xu, M. Vitolo, C.N. de Albuquerque, A. Pessoa, Purification of glucose-6-phosphate dehydrogenase from baker’s yeast in aqueous two-phase systems with free triazine dyes as affinity ligands, Appl. Biochem. Biotechnol. 105 (2003) 853–865.
[19] A.J. Tong, Y. Wu, L.D. Li, Y. Akama, S. Tanaka, Aqueous two-phase system of cationic and anionic surfactant mixture and its application to the extraction of porphyrins and metalloporphyrins, Anal. Chim. Acta 369 (1998) 11–16. [20] P. Vazquez-Villegas, O. Aguilar, M. Rito-Palomares, Study of biomolecules
partition coefficients on a novel continuous separator using polymer-salt aqueous two-phase systems, Sep. Purif. Technol. 78 (2011) 69–75.
[21] A.J. Tong, J.J. Dong, L.D. Li, Aqueous two-phases extraction system of sodium perfluorooctanoate and dodecyltriethylammonium bromide and its application to porphyrins and dyes, Anal. Chim. Acta 390 (1999) 125–131. [22] A.E. Visser, S.T. Griffin, D.H. Hartman, R.D. Rogers, Naphthol- and
resorcinol-based azo dyes as metal ion complexants in aqueous biphasic systems, J. Chromatogr. B 743 (2000) 107–114.
[23] Y.Q. Ling, H.L. Nie, S.N. Su, C. Branford-White, L.M. Zhu, Optimization of affinity partitioning of papain in aqueous two-phase system using response surface methodology, Sep. Purif. Technol. 73 (2010) 343–348.
[24] S.A.M. Martins, D.M.F. Prazeres, L.P. Fonseca, G.A. Monteiro, Application of central composite design for DNA hybridization onto magnetic microparticles, Anal. Biochem. 391 (2009) 17–23.
[25] A.L. Ahmada, C.J.C. Dereka, M.M.D. Zulkali, Optimization of thaumatin extraction by aqueous two-phase system (ATPS) using response surface methodology (RSM), Sep. Purif. Technol. 68 (2008) 702–708.
[26] A.M. Azevedo, P.A.J. Rosa, I.F. Ferreira, M.R. Aires-Barros, Optimization of aqueous two-phase extraction of human antibodies, J. Biotechnol. 132 (2007) 209–217.
[27] J.P. Martins, A.B. Mageste, M.D.H. da Silva, L.H.M. da Silva, P.D. Patrício, J.S.D. Coimbra, L.A. Minim, Liquid–liquid equilibria of an aqueous two-phase system formed by a triblock copolymer and sodium salts at different temperatures, J. Chem. Eng. Data 54 (2009) 2891–2894.
[28] M.T. Zafarani-Moatar, S. Hamzehzadeh, S. Hosseinzadeh, Phase diagrams for liquid–liquid equilibrium of ternary poly(ehtylene glycol)sodium tartrate aqueous system and vapor-liquid equilibrium of constituting binary aqueous systems atT= (298.15, 308.15 and 318.15) K. Experiment and correlation, Fluid Phase Equilib. 268 (2008) 142–152.
[29] P.D. Patricio, A.B. Mageste, L.R. de Lemos, R.M.M. de Carvalho, L.H. M da Silva, M.C.H. da Silva, Phase diagram and thermodynamic modeling of PEO + organic
30 45 60 75
0 35 70 105 140
KN
TLL / % (m/m)
Fig. 12.Effect of hydrophobicity on the partition coefficient of norbixin (KN)
according to the Tie Line Length (TLL). ATPS: (j) PEO1500 + tartNa + H2O; ()
salts + H2O and PPO + organic salts + H2O aqueous two-phase systems, Fluid
Phase Equilib. 305 (2011) 1–8.
[30] A.M. Barbosa, I.J.B. Santos, G.M.D. Ferreira, M.D.H. da Silva, A.V.N.D. Teixeira, L.H.M. da Silva, Microcalorimetric and SAXS determination of PEOSDS interactions: the effect of Cosolutes formed by ions, J. Phys. Chem. B 114 (2010) 11967–11974.
[31] B. Mutel, M. Bigan, H. Vezin, Remote nitrogen plasma treatment of a polyethylene powder optimization of the process by composite experimental designs, Appl. Surf. Sci. 239 (2004) 25–35.
[32] Q.K. Beg, V. Sahai, R. Gupta, Statistical media optimization and alkaline protease production fromBacillus mojavensisin a bioreactor, Process Biochem. 39 (2003) 203–209.
[33] M. Zabeti, W.M.A.W. Daud, M.K. Aroua, Optimization of the activity of CaO/ Al2O3catalyst for biodiesel production using response surface methodology,
Appl. Catal. A – Gen. 366 (2009) 154–159.
[34] D.L. Qiao, B. Hu, D. Gan, Y. Sun, H. Ye, X.X. Zeng, Extraction optimized by using response surface methodology, purification and preliminary characterization of polysaccharides fromHyriopsis cumingii, Carbohyd. Polym. 76 (2009) 422– 429.
[35] C.K. Su, B.H. Chiang, Partitioning and purification of lysozyme from chicken egg white using aqueous two-phase system, Process Biochem. 41 (2006) 257– 263.
[36] A. Boaglio, G. Bassani, G. Pico, B. Nerli, Features of the milk whey protein partitioning in polyethyleneglycol-sodium citrate aqueous two-phase systems with the goal of isolating human alpha-1 antitrypsin expressed in bovine milk, J. Chromatogr. B 837 (2006) 18–23.
[37] H.O. Johansson, G. Karlstrom, F. Tjerneld, C.A. Haynes, Driving forces for phase separation and partitioning in aqueous two-phase systems, J. Chromatogr. B 711 (1998) 3–17.
[38] L.H. Haraguchi, R.S. Mohamed, W. Loh, P.A. Pessoa, Phase equilibrium and insulin partitioning in aqueous two-phase systems containing block copolymer and potassium phosphate, Fluid Phase Equilibr. 215 (2004) 1–15. [39] L.H. Mendes da Silva, W. Loh, Sistemas Aquosos Bifásicos: Fundamentos e
Aplicações para Partição/Purificação de Proteínas, Quim. Nova 29 (2006) 1345–1351.