ABSTRACT:Introduction: In order to improve the quality of life and health of the population in recent years there have been several local social agendas, like Agenda 21 and Healthy Cities. Objectives: To identify how social agendas are impacting on the living conditions and health in municipalities of the ive regions of Brazil. Methods: Through an ecological longitudinal study, the social agendas’ efects on the Social Determinants of Health were measured in 105 municipalities, using indicators related to the eight dimensions of the Millennium Development Goals (MDGs). Indicators were also calculated for other 175 non-exposed municipalities. Descriptive statistics were calculated for each group of municipalities at three diferent moments: in the year of the agenda implementation, then 3 and 6 years later. The models were adjusted by the method of GEE to assess the efects of the agendas, time and their interaction. Nonparametric analysis of variance was used for the ordinal data with repeated measures. Results: Impacts of the agendas were detected for reduction of hunger and increase of universal access to education: ‘percentage of children under one year with protein/caloric undernourishment’ (interaction efect: p = 0.02) and ‘Age-grade distortion in the 8th grade of fundamental education’ (interaction efect: p < 0.001). Conclusion: The comparative discussion between model results and descriptive statistics recommends, at further research, extending the period of investigation, using compound indexes, improving the methodology for the apprehension of the impacts of the difuse social policies for development, as well as using ‘mixed methodologies’, integrating quantitative and qualitative tools. Keywords: Health Promotion. Quantitative research methods. Healthy Cities. Agenda 21. Millennium Development Goals. Social Determinants of Heath.
Impact of the Social Agendas – Agenda 21
and Healthy Cities – upon Social Determinants
of Health in Brazilian municipalities: measuring
the efects of difuse social policies through the
dimensions of the Millennium Development Goals
Impacto das agendas sociais – Agenda 21 e Cidades Saudáveis – nos
Determinantes Sociais de Saúde em municípios brasileiros: medindo os efeitos de
políticas sociais difusas por meio dos Objetivos de Desenvolvimento do Milênio
Paulo Roberto do NascimentoI, Marcia Faria WestphalI, Rafael da Silveira MoreiraII,
Valéria Troncoso BaltarIII, Simone Tetu MoysésIV, Fabiola ZioniI, Evelin MinowaI
IFaculdade de Saúde Pública da Universidade de São Paulo – São Paulo (SP), Brazil. IICentro de Pesquisas Aggeu Magalhães, Fundação Oswaldo Cruz – Recife (PE), Brazil.
IIIDepartamento de Epidemiologia e Bioestatística, Instituto de Saúde da Comunidade, Universidade Federal Fluminense – Niterói (RJ), Brazil. IVPontifícia Universidade Católica do Paraná – Curitiba (PR), Brazil.
Corresponding author: Paulo Roberto do Nascimento. Faculdade de Saúde Pública da Universidade de São Paulo. Avenida Dr. Arnaldo, 715. CEP 01246-904, São Paulo, SP, Brasil. E-mail: [email protected]
2
INTRODUCTION
Social agendas, as local or regional eforts directed to social development, are strategies that have been used in Brazil since the early 1990’s in two major areas of activity: sustainable environmental development, arising from 1992 Rio Conference regarding the construction of Agenda 211, and ‘Healthy Cities’, a proposal drawn up by the World Health Organization with the participation of the Pan-American Health Organization2,3. As they were based on speciic proposals, the social agendas arose in a way so that they would gradually enlarge their areas of activity, encompassing various sectors of the life of local and regional societies. The scope of their activities took place mainly in the local level.
The Millennium Development Goals (MDGs), a proposal of the United Nations4-6 to reduce global inequality, pointed out eight groups of activities agreed to by the signatory nations, that consists of a set of improvements to be achieved by the year 2015 on important sectors of life in society. Goals and indicators were proposed for the measurement of the achievements obtained by policies and actions to be undertaken across the world. The eight goals bring challenges regarding the reduction of poverty and hunger, of the inequality between men and women, the improvement in access to basic education, the improvement
of the health status of socially and epidemiologically vulnerable groups, environmental development and global integration by means of partnerships for globalization.
The Social Determinants of Health (SDH) constitute a central theme to the development of health, in accordance with a proposal of the General Assembly of the World Health Organization (WHO), which reinforce an indissoluble relationship between the health status of populations and the degree of human development7,8. In Brazil, after the constitution of the World Commission for the development of studies on SDH9,10, a National SDH Commission was installed11, whose work, guided by research in the quest for scientiic evidence, would be to present, based on the results, proposals for integrated actions seeking greater health equity in the country. After two years of work, the Commission obtained important data which conirmed the analysis of the SDH as constituting an important tool for the elucidation of the relationship between health and development. It clearly pointed out the need to overcome the barriers to intersectorial effort in order to improve the health status of populations. It also reairm, as in the Dahlgreen/Whitehead model adopted by the National Commission12, that sectorial health actions are only one of the many dimensions of life in society, from which emanate actions directed to social development and health.
Thus, while MDGs presuppose the undertaking of actions in all these dimensions, the proposals of Agenda 21 are very rarely restricted to actions in the traditional environmental sector; and, the Healthy Cities propose actions based on the SDH; all of them in accordance with the premise of multisectoriality.
This paper reports, on the thematic of the SDH, a quantitative methodological approach, as part of a multicenter studya using “mixed methods”, as proposed by Creswell et al.13, relating the efects of social agendas to the change of living conditions and the health status of the populations living in Brazilian municipalities. It also discusses limits and possibilities of the design used to evaluate and monitor the efects of interventions such as social development agendas.
METHODS
In order to demonstrate the impact of social agendas on MDG selected indicators in Brazilian municipalities, the research was developed in 3 phases.
First, a hundred and ive municipalities from the ive great regions of the country were identiied as having implemented social agendas (Agenda 21 and Healthy Cities) on the basis of an extensive survey conducted by Duarte3 and later literature, followed by telephone consultation to municipalities also indicated by national and regional government agencies such as Departments of Health, Environment and Cities14, responsible for the agendas program. The agendas’ existence, as indicated previously, was conirmed through inquiries at the oicial sites of the municipalities involved, and in some cases at sites held by the agendas.
aResearch Project funded through notice of Ministry of Science and Technology Edict – CNPq /
4
Telephone interviews were conducted in all the cities with the managers and some of the participants in order to assess the engagement with the agenda and to gather information on its deployment history, on which departments and institutions had taken part, as well as data about the local key person for its evolution. These were the procedures for conirming the existence of the agenda and registering its year of implementation. The selection of municipalities having agendas was made on the following criteria: agenda being actively applied during the time of the investigation; agenda implemented for at least ive years; operation of the agenda begun after 1996; and having a register document about the agenda available for analysis.
In the second phase, an ecological longitudinal study was designed on the basis of the epidemiological frame of reference15-17 to evaluate the association between municipalities with social agendas — Healthy Cities and Agenda 21b — and the MDG targets indicators. Then, a total of 105 municipalities which had taken the initiative of developing social agendas, implementing them efectively (exposed) were matched to a control group of 175 municipalities that did not implement social agendas (not exposed).
As it is considered that there would be diferences between pairs of cities with respect to some covariates, a representative sample of municipalities was used as a control group in the study design. The fundamental principle to avoid or minimize such bias was the maximum similarity between the groups, except with regard to the outcome19. Therefore, the control (not exposed) municipalities selection criteria should be similar to the studied exposed municipalities, except in regard to the exposure to social agendas and its possible results on MDG indicators, on the basis of the hypothesis that exposure represents health protection and quality of life.
The weighted Euclidean distance was then used to select the municipalities based on two variables: population size and Human Development Index (HDI). This distance was calculated within each federal state, avoiding regional disparity, between all state municipalities-case, and between all municipalities in the same state. The base year for this standardization was 2000.
The measure of variability for pairing was the variations between municipalities: the lesser the distance between a given pair of municipalities — exposed ones and eligible for control — the greater their similarity.
A list of ten municipalities eligible as controls was provided for each of the exposed municipalities, and the regional research teams were instructed to eliminate situations which presented considerable disparity, perhaps not covered by the variables used for pairing, as well as ascertaining that the social agenda had not been fulilled in these municipalities in the period stipulated.
bThe researchers started from the perception of the proximity of the three — social agendas, MDG, SDH —
epistemological propositions and also perceived similarities with the principles of Health Promotion from WHO, such as: holistic conception, intersectoriality, empowerment, social participation, equity, multi-strategic actions and sustainability. In fact, earlier research has detected the impact of these principles on local Brazilian programs not addressed to health problems, indicating their importance for community development7,18.The research group had also the intention to test and adapt the indicators internationally
Two controls were sought for each municipality exposed, though, the absence of a necessary criteria for pairing could mean that some of the exposed municipalities might be paired with only one control, and some of the controls with more than one of the exposed municipalities — yielding samples of different sizes, as between exposed and non-exposed. Then, 280 municipalities were selected for this phase of the study: 105 exposed and 175 controls.
Another important methodological decision was taken as regards the chronological follow-up of the indicators, which was not to be done by what was called “calendar year” — a ixed date or previously agreed year, as from which the municipalities could be compared by virtue of the variations presented by the indicators. The occasion for the beginning of the analysis was deined as the year in which the agenda was implemented, when it would not yet have produced any efects on the indicators. This was denominated time T0. For the control municipalities, the T0 would be that year in which the paired exposed municipality had actually implanted their agenda. As from T0, another two moments were deined: three and six years after the implementation, respectively denominated T3 and T6. That is to say, it was considered — arbitrarily and for methodological purposes only — that the implementation of the social agenda may present some efect after at least three years of activity. It was also determined that when six years had passed since the beginning, a new assessment would be carried out. In leaving aside the ‘calendar year’, a greater approximation to reality was sought, seeing that the moments T0, T3 and T6 of certain municipalities and their controls would not correspond to the same ‘calendar year’ of another municipality and its case studies, as the year of the implementation of the agenda will not necessarily be the same in both situations.
Once the exposed municipalities and their respective controls were defined, a set of 29 indicators of the living conditions and health status was collected for all 280 municipalities comprehending the period from 1997 to 2006. An efort was made to build a table of indicators that could be used in Brazilian follow-up programs to overcome inequities related to health and conditions of life in municipalities20. It was elaborated on the basis of the available data from the National Information Systems. For a detailed description of the information sources used and the indicators selection process refer to the research report14,20.
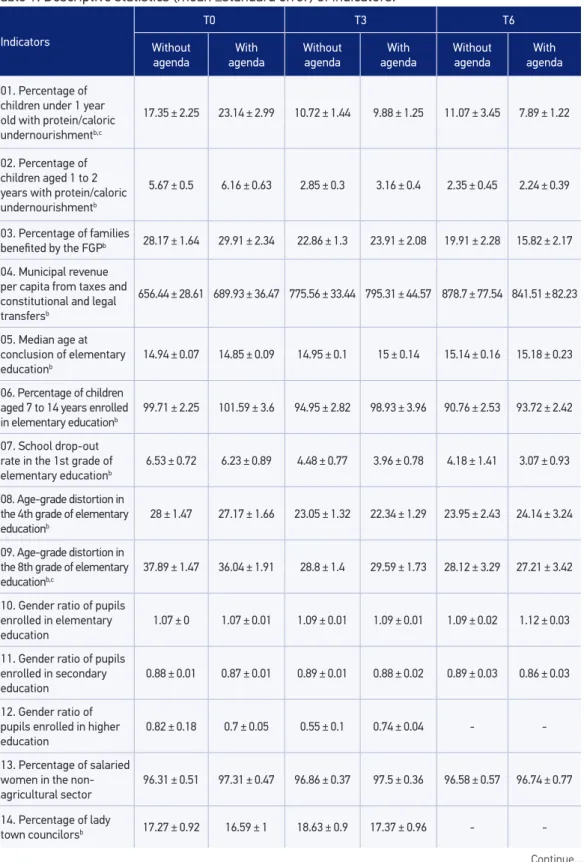
The descriptive statistics — measurements of the central tendency (means) and measurements of variability (Standard Error, SE) are presented in Table 1 for each group of municipalities (with or without agenda) and for each occasion: T0, T3 and T6. The analysis of the descriptive statistics conirmed the maintenance of the database, even in those cases in which discrepant values were identiied, as the consultation of the database and the adjustment of the non-parametric models showed that the values would not interfere in the analyses in a way they would afect the statistic inferences.
6
Table 1. Descriptive statistics (mean ±standard error) of indicators.
Indicators
T0 T3 T6
Without agenda With agenda Without agenda With agenda Without agenda With agenda
01. Percentage of children under 1 year old with protein/caloric undernourishmentb,c
17.35 ± 2.25 23.14 ± 2.99 10.72 ± 1.44 9.88 ± 1.25 11.07 ± 3.45 7.89 ± 1.22
02. Percentage of children aged 1 to 2 years with protein/caloric undernourishmentb
5.67 ± 0.5 6.16 ± 0.63 2.85 ± 0.3 3.16 ± 0.4 2.35 ± 0.45 2.24 ± 0.39
03. Percentage of families
beneited by the FGPb 28.17 ± 1.64 29.91 ± 2.34 22.86 ± 1.3 23.91 ± 2.08 19.91 ± 2.28 15.82 ± 2.17
04. Municipal revenue per capita from taxes and constitutional and legal transfersb
656.44 ± 28.61 689.93 ± 36.47 775.56 ± 33.44 795.31 ± 44.57 878.7 ± 77.54 841.51 ± 82.23
05. Median age at conclusion of elementary educationb
14.94 ± 0.07 14.85 ± 0.09 14.95 ± 0.1 15 ± 0.14 15.14 ± 0.16 15.18 ± 0.23
06. Percentage of children aged 7 to 14 years enrolled in elementary educationb
99.71 ± 2.25 101.59 ± 3.6 94.95 ± 2.82 98.93 ± 3.96 90.76 ± 2.53 93.72 ± 2.42
07. School drop-out rate in the 1st grade of elementary educationb
6.53 ± 0.72 6.23 ± 0.89 4.48 ± 0.77 3.96 ± 0.78 4.18 ± 1.41 3.07 ± 0.93
08. Age-grade distortion in the 4th grade of elementary educationb
28 ± 1.47 27.17 ± 1.66 23.05 ± 1.32 22.34 ± 1.29 23.95 ± 2.43 24.14 ± 3.24
09. Age-grade distortion in the 8th grade of elementary educationb,c
37.89 ± 1.47 36.04 ± 1.91 28.8 ± 1.4 29.59 ± 1.73 28.12 ± 3.29 27.21 ± 3.42
10. Gender ratio of pupils
enrolled in elementary education
1.07 ± 0 1.07 ± 0.01 1.09 ± 0.01 1.09 ± 0.01 1.09 ± 0.02 1.12 ± 0.03
11. Gender ratio of pupils
enrolled in secondary education
0.88 ± 0.01 0.87 ± 0.01 0.89 ± 0.01 0.88 ± 0.02 0.89 ± 0.03 0.86 ± 0.03
12. Gender ratio of
pupils enrolled in higher education
0.82 ± 0.18 0.7 ± 0.05 0.55 ± 0.1 0.74 ± 0.04 -
-13. Percentage of salaried women in the non-agricultural sector
96.31 ± 0.51 97.31 ± 0.47 96.86 ± 0.37 97.5 ± 0.36 96.58 ± 0.57 96.74 ± 0.77
14. Percentage of lady
town councilorsb 17.27 ± 0.92 16.59 ± 1 18.63 ± 0.9 17.37 ± 0.96 -
Table 1. Continuation.
asigniicant group efect; bsigniicant time efect; csigniicant efect of interaction between group and time; All statistical models
were Generalized Estimating Equation, with exception of ordinal data, where non-parametric ANOVA were performed. Indicators
T0 T3 T6
Without agenda
With agenda
Without agenda
With agenda
Without agenda
With agenda
15. Percentage of women among federal deputies elected by the stateb
4.34 ± 0.51 4.4 ± 0.65 7.67 ± 0.46 7.81 ± 0.62 7.55 ± 0.74 7.63 ± 1.01
16. Male/female ratio
among salaried workers 1.69 ± 0.06 1.67 ± 0.05 1.78 ± 0.11 1.8 ± 0.07 1.74 ± 0.09 1.94 ± 0.14
17. Proportional mortality of children under 1 year oldb
5.62 ± 0.29 5.48 ± 0.37 5.28 ± 0.4 5.33 ± 0.46 5.02 ± 0.58 3.95 ± 0.62
18. Coeicient of Infant
Mortality by moving average
18.67 ± 0.66 18.85 ± 0.83 19.46 ± 1.08 19.6 ± 1.72 16.03 ± 0.83 –
19. Maternal mortality ratio corrected by moving averageb
80.67 ± 9.79 70.59 ± 15.1 123.09 ± 22.94 95.06 ± 16.02 52.65 ± 15.44 102.85 ± 31.43
20. Percentage of
institutional deliveriesb 98.73 ± 0.38 98.84 ± 0.4 99.68 ± 0.06 99.38 ± 0.29 99.71 ± 0.11 99.46 ± 0.3
21. Proportion of coverage of pregnancies with 7 or more prenatal visitsb
54.71 ± 1.75 55.28 ± 2.13 59.62 ± 2.23 57.94 ± 2.61 64.5 ± 3.87 62.1 ± 3.83
22. HIV Mortality
Coeicient 4.85 ± 0.49 5.96 ± 0.82 6.12 ± 0.73 6.49 ± 1.01 6.54 ± 1.51 6.97 ± 1.91
23. Malaria prevalenceb 1.23 ± 0.39 1.83 ± 0.67 1.82 ± 0.49 2.67 ± 0.91
24. Tuberculosis prevalence
(conirmed cases)a,b
36.5 ± 2.69 42.57 ± 3.2 30.3 ± 2.62 43.27 ± 5.47 – –
25. Mortality from Diarrhea in children under 5 years
19.64 ± 3.38 19.48 ± 4.05 20.34 ± 5.53 14.27 ± 3.82 18.74 ± 8.05 9.98 ± 3.97
26. Cardiovascular
disease death rateb 179.31 ± 5.7 180.75 ± 7.92 193.85 ± 7.85 193.91 ± 10.44 217.46 ± 10.62 239.52 ± 22.04
27. Mortality rates due to
external causes 68.71 ± 2.72 71.9 ± 3.06 66.93 ± 3.58 70.09 ± 3.72 64.63 ± 5.16 77.38 ± 7.6
28. Percentage of the population with piped water supplyb
72.93 ± 3.02 81.03 ± 3.27 77.23 ± 2.55 85.93 ± 3.46 68.06 ± 4.23 76.86 ± 5.18
29. Percentage of young salaried workers aged 15 to 24 years
8
For both groups and in the three occasions — T0, T3 and T6 — ,the following hypotheses were tested: a) there is a time effect (difference between the statistics of the indicators over the three moments considered); b) there is an effect resulting from the existence of an agenda (the fact that the municipality’s implementation of an agenda is associated with some difference in relation to the group with no agenda); and c) there is an effect of the interaction between time and existence of agenda (the progress over these three moments is different between groups). The significance level was set at 5% for these tests.
RESULTS
Two indicators (1 and 9) had a significant effect of agenda through the years (significant interaction). The percentage of children under the age of one with protein/caloric undernourishment (Indicator 1) was reduced after three years; the effect of interaction (p = 0.02) suggests that another drop occurred in the municipalities with agendas. Three years later, i.e., between T3 and T6, the percentage of undernourishment increased in the group without agenda, whereas a decrease was observed in the group with agenda.
The ‘Age-grade distortion in the 8th grade of elementary education’ (Indicator 9) presented its greatest drop after three years, even though both groups did not present a significant reduction from T3 to T6.
It is also worth noticing that the percentage of families beneiting from the “Bolsa Família” (Family Grant Program – FGP) (Indicator 3) decreased in the period for both groups of municipalities. Among those with agenda, it departed from a level of 29.9% of beneiciary households at the time of the implementation of the agenda and, six years later, it was 15.8%. Among those with no agenda, it was from 28.2 to 19.9% (interaction efect: 0.096). The FGP is a federal compensatory policy program for the provision of income for families with per capita income below the poverty line. The behavior of the number of families at the time in each municipality expresses the growth or reduction of the percentage of poor individuals.
The coeicient of Tuberculosis prevalence (conirmed cases - Indicator 24), diminished after three years, both in the municipalities and without agendas. The median diminished from 32 to 26% in the municipalities with agendas and from 39% to 35% in the others. Among municipalities, the major alterations have generally occurred in the municipalities with agendas with higher initial rates. However, when the groups are compared in each occasion (at the beginning and three years later), the differences are not significant at the 5% level, but p values are below 10%; so there is evidence, though weak, of lower rates in the municipalities with no social agendas. (Group effect: 0.044)
Three other indicators only had significant results for time effect. Namely: The percentage of lady town councilors (Indicator 14) presented a significant increase over time regardless of agendas. (Time effect: 0.036). The proportional mortality of children under the age of one (Indicator 17) diminished after six years and dropped significantly between T3 and T6, regardless of agendas. (Time effect: 0.002). As regards the proportion of the coverage of pregnancies with seven or more pre-natal visits (Indicator 21), no differences were found in the values when compared at three-year intervals. From the results of the multiple comparisons, the only difference to be noted was that between T3 and T6, showing that, as from the beginning, there was an increase in the proportion value of the coverage over the six-year period (Time effect: 0.002).
DISCUSSION
The agendas results would be an improvement in the quality of life of the population in the municipalities where collective actions were implemented to attend to local needs, which is detectable by means of the indicators proposed to measure progress towards the MDGs. Setting up clear indicators to measure progress seems to be in line with Ashton’s ideas25 about the need, in the academic ield, to ‘develop robust methodologies’ aimed to deepen and to evaluate the efectiveness of the experiences of Healthy Cities. That is to say, the social forces, which are expressed in local daily life and compose the life of society, beyond (but also including) the health sector, constitute the social process of social production of health and of healthy living conditions. In this study, we sought to measure quantitatively the changes through the MDGs indicators as a methodology to improve the evaluation mechanisms of the agendas.
Regarding the results of descriptive statistics (Table 1), the performances achieved by the municipalities with and without agenda proved to be balanced in relation to the values of the 29 indicators mean variations: in 15 of them, the performance improved in both groups; in 10, it became worse; in 3, the performance improved only for those with no agenda; and, in one of the indicators, we abandoned the descriptive analysis because of a lack of data after three years had passed by (Indicator 12).
The greatest descriptive approximation of the positive performances (15 indicators) demonstrates that in 7 of them, the best performance occurred among those with agenda (indicators 1, 2, 3, 7, 17, 25 and 29); in 6, among those with no agenda (indicators 4, 8, 9, 14, 15 and 21); and in 2, the improvement was equal in both groups (indicators 5 and 20).
In other three indicators (13, 24 and 27) those with no agenda presented a positive performance, while those with agendas presented a negative one.
10
(indicators 6, 19, 22 and 23); with regard to five indicators (10, 11, 16, 26 and 28) the least accentuated worsening occurred among those with no agenda; and there was an equal worsening in both groups as regards indicator 18.
Those with an agenda presented better average values at T0 than those with no agenda with regard to 18 indicators and, on the final occasion (T3 or T6, according to the case) in regard to 15 indicators. Out of 15 situations in which worse values were presented at the end of the period, they had started out (T0) in a worse situation in seven cases (Indicators 14, 18, 22, 23, 24, 26 and 27).
Three observations need to be made at this point: A) it so happens that among 10 indicators concerning those with agendas that had presented worse average values in the beginning, seven of them had no inversion of the situation. Of these, with regard to 4 indicators (Indicators 18, 22, 23 and 26), there was a worsening in both groups; in 2 (Indicators 24 and 27), the worsening occurred only among those with agendas; and, in 1 (Indicator 14), both improved, with better performance than those without agendas. B) Among the 18 indicators, taking into account those with agendas that presented better positions in the initial average values compared to those with no agenda, only in 6 of them (Indicators 4, 8, 16, 19, 20, 21) those with agendas did come to the end of the period with worse values than those with no agenda. And even in those situations, with regard to four of the indicators (4, 8, 20 and 21) both groups presented an improvement in their average values. C) What is verified is that, according to this study, even when the performance over the period does not seem to favor those with agendas, they present better average behavior as to the values of the indicators than those without agenda.
In its turn, the statistical model, when applied to the twenty-nine indicators, did not reveal any significant evidence of the influence of an agenda on the results in the municipalities. Except for the effects of the group or interaction presented by indicators 1, 9, 24 and 28, which in general give only weak evidence of the effect, nothing more substantial expressed any impact of the agendas on living conditions and health status within the local situation.
In three other indicators significant evidence for the effect of time was found, however, without agenda efect: indicators 14, 17 and 21.
studies ‘has assessed whether there was a reduction of inequalities in nutritional status (or any other indicator) as a result of the program.’
The social agendas were brought together in an assessment research project which made use of the Health Promotion frame of reference, based on the presupposition that local initiatives in social development, as expressed by the agendas, should produce effects on the SDH. Here we adopt the approach of O’Neill and Simard26 on Healthy Cities, especially concerning the importance of searching for mechanisms to evaluate its effectiveness, and apply it to the models of the discussed agendas. It is relevant to mention the 15th recommendation of “Rio Political Declaration on Social Determinants on Health”27 — “To monitor progress and increase accountability: Acknowledging that monitoring of trends in health inequities and of impacts of actions to tackle them is critical to achieving meaningful progress, that information systems should facilitate the establishment of relationships between health outcomes and social stratification variables and that accountability mechanisms to guide policy-making in all sectors are essential, taking into account different national contexts”.
Then, the comparison of the descriptive results with the unconf irmed prior expectation that agendas of local social development, even when acting diffusely, could produce effects in terms of the indicators of living conditions and health status led to questioning as to the time necessary for such maturing as would permit the expected changes to express themselves25. The specificity which follows from the local reality of each experience, the one that each agenda takes on when promoting development, certainly points at actions directed more to some sectors of local life than others. This would tend to produce more results in some dimensions of social life than in others. The wide spectrum of dimensions of social life covered by the set of indicators would allow changes to be detected wherever they occurred, as their effects in social life sectors. In addition to this, the methodological option made in order to capture any effects resulting of a diffuse set of actions has favored the capture of the degree of deepening the effects achieved and, therefore, of the degree of deepening of the measures taken in each agenda, along with their chronological effectuation: the agendas were taken as a reality that, once started up, tends to spread and deepen, presenting more consistent effects according to the time of its existence.
Another relevant aspect that must be considered is the fact that other results, coming of specific policies that are not connected to the agendas, could be mistakenly taken as results produced by them. Again, the methodological choice has to be one that encompasses the set of municipalities with and without agenda, as well as the wide spectrum of indicators. The ecological and longitudinal character of the epidemiological design adopted favors, in this case, the search for wide spectrum effects resulting from broad policies that stimulate social development and quality of life.
12
development agenda, is a period too short to reveal out modifications in living conditions and health status indicators20.
The mechanism adopted for chronological comparison (T0, T3, T6) is an innovative tool that was imposed by the project design, which required measurements at moments which varied in accordance with the date of the actual implantation of the agenda. However, as we consider that three years is not enough to permit any quantitative efects on the indicators, the number of municipalities presenting six years of existence drops considerably and, thus, the number of cases for comparison also decreases. Thus, it is as certain that new measurements must be taken as it is imperative the agendas to be maintained and to produce the efects which they propose.
A theme which was not dealt with in this study is that of the discontinuity of the data available for study. Associated with this new fact, it is also worthy of mention that the descriptive statistics show a municipal situation very different from that depicted by the average national or regional results shown by the national or regional averages presented by the recent surveys of the MDGs. The difficulties arising from discontinuous historical series could be partially resolved by recourse to compound indexes.
In brief, we argue that to measure improvements arising from diffuse actions — the social process of construction of agendas — by means of indicators, which by definition express measurements of specific phenomena, demands the use of mixed methods — quantitative and qualitative methodologies as part of the same design — or the use of compound measuring instruments, such as compound indexes, which can combine a set of the dimensions of a social situation — the integrated use of discrete indicators and compound indexes; and a more extensive period of time, greater than the three years tested in our study, so that the changes achieved may in fact be detected by the indicators.
CONCLUSIONS
There are several challenges that present such a methodology. The first one consists in the fact it is a study based on secondary data. Although there was a collection of primary data on the existence of Social Agendas in development, through active search in the municipalities, the documentation of these agendas are diverse and information consistency can vary among municipalities. However, a standardized pre-tested instrument was used in an attempt to reduce these heterogeneities. The second challenge relates to the available indicators for measuring the MDGs. In addition to the serious problem of underreporting the main national database on health, the DATASUS, a lot of information are not broken down by municipality, the periodicity of the data is variable and not all indicators are available for all municipalities.
fact, controlling for other dimensions that could be related to the outcomes studied (MDGs), beyond the Social Agenda itself. While it is impossible to ensure this control with the same success in the traditional cohort studies (conducted with individuals), the results may indicate that the Social Agenda represents markers of protection for exposed municipalities. The joint analysis of other factors may suggest other dimensions, and features associated with MDGs could be considered in further actions for Health Promotion.
Social agendas, as potential promoters of human development, do not address any speciic dimension of social reality; they only produce difuse efects when they are not directed to a speciic sectorial purpose. Two doubts come up: on the one hand, the need for other studies which use both quantitative and qualitative methodologies in a complementary way, thus enhancing the possibility of detecting other efects. On the other hand, the need of making new assessments, after a long period of activity of the agendas. The quantitative measurement of difuse actions’ efectiveness remains to be demonstrated.
1. Cerqueira F, Facchina M. A Agenda 21 e os Objetivos de Desenvolvimento do Milênio: as oportunidades para o nível local. Cadernos de Debate Nº 7. Agenda 21 e Sustentabilidade. Ministério do Meio Ambiente. Secretaria de Políticas para o Desenvolvimento Sustentável. Brasília: Ministério do Meio Ambiente; 2005.
2. Westphal MF. O movimento Cidades/Municípios Saudáveis: um compromisso com a qualidade de vida. Ciência & Saúde Coletiva 2000; 5(1): 39-51.
3. Duarte MF. As agendas sociais brasileiras de desenvolvimento local: possibilidades de diálogo, articulações e de convergência. São Paulo, Faculdade de Saúde Pública/ USP, 2006. (Dissertação de Mestrado, 244 p.)
4. Organización de las Naciones Unidas. Resolución aprobada por la Asamblea General 55.2. Declaración del milenio. [on-line] Disponível em: http://www.un.org/ spnish/milleniumgoals/areas 552.html (acessado em 18 de junho de 2004).
5. United Nations. The Millennium Developments Goals Report 2007. New York, United Nations; 2007.
6. Presidência da República. Objetivos de Desenvolvimento do Milênio: relatório nacional de acompanhamento. Brasília, IPEA: Ministério do Planejamento, 2007.
7. World Health Organization. Bangkok Charter for Health Promotion. WHO: Geneva; 2005.
8. CSDH. Closing the gap in a generation: health equity through action on the social determinants of health. Final Report of the Commission on Social Determinants of Health. WHO: Geneva; 2008.
REFERENCES
9. CDSS – Comissão dos Determinantes Sociais da Saúde Rumo a um Modelo Conceitual para Análise e Ação sobre os Determinantes Sociais de Saúde. OMS: Genebra; 2005.
10. CSDH – Commission on Social Determinants of Health. A Conceptual framework for action on the Social Determinants of Health. CSDH, Discussion Paper, April 2007.
11. CNDSS – Comissão Nacional dos Determinantes Sociais da Saúde. As causas sociais das iniqüidades em saúde no Brasil. Relatório Final da Comissão Nacional sobre Determinantes Sociais da Saúde. Brasília, Ministério da Saúde, 2008.
12. Dahlgren G, Whitehead M. Policies and Strategies to promote social equity in health. Stockholm: Institute for Future Studies; 1991.
13. Creswell JW, Plano Clark VL. Designing and conducting Mixed Methods Research. California, EUA, Sage Publications, 2007.
14. Westphal MF (coord.). Relatório Final: Saúde e Desenvolvimento Local: análise dos progressos em relação aos Objetivos de Desenvolvimento do Milênio relacionados à saúde, nas cidades brasileiras que desenvolvem agendas sociais. São Paulo, Faculdade de Saúde Pública, CNPq; 2009 (Relatório de Pesquisa). Disponível em: http://www.cidadessaudaveis.org.br/Det_Projeto. aspx?ProjetoID=39
14
16. Lilienfeld A. Foundations of epidemiology. New York: Oxford University Press, 1976.
17. Almeida Filho N, Rouquayrol MZ. Elementos de metodologia epidemiológica. In: Rouquayrol MZ, Almeida Filho N. Epidemiologia e Saúde. 6 ed. Rio de Janeiro: Medsi; 2003.
18. Sícoli JL, Nascimento PR. Promoção de saúde: concepções, princípios e operacionalização. Interface – Comunic Saúde Educ 2003; 7(12): 101-23.
19. Rothman KJ, Greenland S. Modern Epidemiology. 2nd ed. Lipponcott-Raven, Philadelphia; 1998.
20. Westphal MF, Zioni F, Almeida MF, Nascimento PR. Monitoring Millennium Development Goals in Brazilian municipalities: challenges to be met in facing up to iniquities. Cad Saúde Pública 2011; 27 Suppl 2: S155-63.
21. Paula GA. Modelos de Reg ressão com apoio computacional. São Paulo: IME-USP; 2004.
22. Hardin J, Hilbe J. Generalized Estimating Equations. London: Chapman and Hall/CRC: 2003.
23. Brunner E, Langer F. Nonparametric analysis of ordered categorical data in designs with longitudinal observations and small samples sizes. Biometrical Journal 2000; 42(6): 663-75.
24. Rosa P. Análise não-paramétrica de dados ordinais com medidas repetidas. (Dissertação de Mestrado), IME-USP, 2001.
25. Ashton JR. From Healthy Towns 1843 to Healthy Cities 2008. Public Health 2009; 123(1): e11-3.
26. O’Neill M, Simard P. Choosing indicators to evaluate Healthy Cities projects: a political task? Health Promotion International 2006; 21(2): 145-52.
27. World Health Organization. Rio Political Declaration on Social Determinants of Health. Rio de Janeiro, Brazil, 21 October 2011. Rio de Janeiro, Brazil, WHO; 2011.
Received on: 04/28/2012