326 Radiol Bras. 2012 Nov/Dez;45(6):326–333
Dosimetry in abdominal imaging by 6-slice computed
tomography
*
Estudo da dose nos exames de tomografia computadorizada abdominal em um equipamento de 6 cortes
Sónia Isabel Rodrigues1, António Fernando Abrantes2, Luis Pedro Ribeiro3, Rui Pedro Pereira Almeida4
Objective: To determine the effective dose in abdominal computed tomography imaging and to study the influence of patients’ characteristics on the received dose. Materials and Methods: Dose values measurements were performed with an ionization chamber on phantoms to check the agreement between dose values and those presented by the computed tomography apparatus, besides their compliance with the recommended reference dose levels. Later, val-ues of dose received by physically able patients submitted to abdominal computed tomography (n = 100) were
mea-sured and correlated with their anthropometric characteristics. Finally, the dose to organs was simulated with the Monte Carlo method using the CT-Expo V 1.5 software, and the effect of automatic exposure control on such examinations. Results: The main characteristics directly influencing the dose include the patients’ body mass, abdominal perimeter and body mass index, whose correlation is linear and positive. Conclusion: The radiation dose received from abdomi-nal CT scans depends on some patient’s characteristics, and it is important to adjust the acquisition parameters to their dimensions.
Keywords: Computed tomography; Dosimetry; ALARA; CTDI; Optimization; Body mass index.
Objetivo: Determinar a dose efetiva recebida nos exames de tomografia computadorizada abdominal e estudar a in-fluência das características dos pacientes na dose recebida. Materiais e Métodos: Foram realizadas medições dos valores de dose com uma câmara de ionização em objetos simuladores, de forma a verificar se os valores obtidos estavam de acordo com os valores apresentados pelo equipamento de tomografia computadorizada e se estes não ultrapassavam os níveis de referência de dose recomendados. Posteriormente, foram medidos os valores de dose recebida pelos pacientes, com autonomia física, nos exames de tomografia computadorizada abdominal (n = 100) e
a relação existente com as suas características antropométricas. Por último, foi simulada a dose nos órgãos por meio do método de Monte Carlo utilizando o software de simulação CT-Expo V 1.5, e estudado o efeito do controle
automá-tico de exposição nestes exames. Resultados: As principiais características com influência direta na dose são a massa corporal, o perímetro abdominal e o índice de massa corporal do paciente, cuja relação é linear e positiva. Conclu-são: A dose de radiação recebida nos exames abdominais depende de algumas características dos pacientes, sendo importante ajustar os parâmetros de aquisição às suas dimensões.
Unitermos: Tomografia computadorizada; Dosimetria; ALARA; CTDI; Otimização; Índice de massa corporal. Abstract
Resumo
* Study developed at School of Health – University of Algarve, Portugal.
1. Master, Radiology Technician at Hospital de Faro, EPE, Pro-fessor, Department of Radiology, School of Health – University of Algarve, Portugal.
2. Master, Fellow PhD degree in Sociology, Member of Re-search Center CESNOVA – Nova Lisbon University, Professor, Department of Radiology, School of Health – University of Algarve, Portugal.
3. PhD, Member of Research Center CIDAF –University of Coimbra, Professor, Department of Radiology, School of Health – University of Algarve, Portugal.
4. Licenciate, Fellow PhD degree of Biomedicine at University of Beira Interior, Professor, Department of Radiology, School of Health – University of Algarve, Portugal.
Mailing Address: Prof. Rui Almeida. Avenida Doutor Adelino da Palma Carlos, 8000-510. Faro, Portugal.
Received June 11, 2012. Accepted after revision September 11, 2012.
Rodrigues S, Abrantes AF, Ribeiro LP, Almeida RPP. Dosimetry in abdominal imaging by 6-slice computed tomography. Radiol Bras. 2012 Nov/Dez;45(6):326–333.
by means of CT angiography, virtual endo-scopy, multiphase contrast-enhanced stud-ies and multiplanar volume reconstruc-tion(2,3).
With increasing number of applications, the relative contribution of CT to the dose resulting from medical procedures has pro-portionally increased(4). Due to the fact that such doses are relatively high, they end up having a significant impact on the doses on the population, thus the evaluation of medi-cal exposure in CT studies is of particular relevance(5). In 2007, in USA, the estimated effective collective dose for CT examina-tions, even after adjustment for the
popu-INTRODUCTION
lation size, was 440,000 Sv as compared with 18,000 Sv in the United Kingdom, with the radiation dose attributed to CT being 0.35 mSv per capita in the United Kingdom population and 1.5 mSv in the USA(5).
One of the biological effects of ioniz-ing radiation is cancer induction. Recent studies have concluded that there is a prob-ability of 1 in 1,000 of cancer induction for a 10 mSv exposure. In children, such a fact is even more critical, as the occurrence of cancer has a longer time to manifest(6).
For all those reasons, dose reduction in CT is extremely important, with assurance of appropriate justification for all studies, as well as the utilization of appropriate technical parameters, equipment quality control and utilization of the lowest pos-sible diagnosis reference levels(1).
On account of geometry and application of the CT technique, such a method com-prises a set of quantities to quantify the exposure to radiation, namely: computed tomography dose index (CTDI), dose-length product (DLP) and effective dose(7). In CT, dose measurements may be per-formed by means of the Monte Carlo simu-lation or by means of dosimeters, such as radiophotographic films, thermolumines-cent dosimeters and ionization chambers. Thus, following up on the previously mentioned facts, the present study was aimed at determining the received dose values at abdominal CT examinations and the relationship of such values with the an-thropometric characteristics of the patient, namely sex, age, body mass index (BMI), height, and abdominal perimeter.
The development of the present inves-tigation is considered to be of great rel-evance, as the abdominal studies are the most frequently performed among all CT studies, and also those which most contrib-ute to the received radiation dose. As a function of the obtained results, the present study is also aimed at presenting a set of recommendations for dose optimization in such type of examination.
MATERIALS AND METHODS
The target population of the present study consisted of patients who underwent abdominal CT examinations in the
Imag-ing Service of Hospital de Faro, EPE, lo-cated in Southern Portugal. The sample in-cluded 100 physically able patients (44 women and 56 men) with ages between 14 and 87 years, who underwent previously scheduled exams.
Previously to the determination of ab-sorbed dose by the study sample, dose value measurements were performed in phantoms by means of an ionization cham-ber, in order to verify whether the obtained values were compliant with those presented by the CT apparatus and whether such val-ues were within the diagnostic reference levels recommended by the European Guidelines(1).
Subsequently, the received dose values for abdominal CT were measured, and their relationship with the patients’ anthropo-metric characteristics was studied. Finally, the doses to organs were simulated by means of the Monte Carlo method with the CT-Expo V 1.5 software, and the effect of the automatic exposure control in such examinations was studied. The results were analyzed with the SPSS V16.0 software.
Verification of the CT apparatus dose value
The CTDIs of the CT apparatus were evaluated by means of dose measurements in acrylic phantoms, with an ionization chamber and an electrometer(8). The dose values were measured with the routine scan protocol for skull, chest, upper abdomen and pelvis. For the measurement of the dose In order to measure the dose in the skull scan, a head phantom with 16 cm in diameter and 15 cm in height was utilized, while for the chest, abdomen and pelvis scans a body phantom with 32 cm in diam-eter and 15 cm in height was utilized.
The value corresponding to CTDI100
was measured at the center of each phan-tom and at four different peripheral points, and from those values the weighted aver-age was calculated [CTDIW (equation 1)]
(7).
Finally, the CTDIVol was obtained,
tak-ing into consideration the pitch utilized in the images acquisition (equation 2)(7).
The DLP value was calculated by mul-tiplying the CTDIVol by the length of the
ac-quisition L (equation 3)(7). CTDIVol =
CTDIw
pitch
The effective dose (E) was calculated by multiplying the DLP value by a specific conversion factor for each region, EDLP
(equation 4)(7).
Measurement of anthropometric characteristics of the patients
The data related to the patients compris-ing the study sample were obtained by uti-lizing a bioelectrical impedance scale and measurement tapes: body mass, fat mass, lean mass, total body water, height, BMI and abdominal perimeter (at the level of the iliac crests). The patients were duly ap-proached with full explanation of the type of measurements to be performed and by requesting their consents for such.
Considering that the BMI corresponds to the body mass in relation to individual differences in height, it is an effective tool for identifying obesity, allowing for its clas-sification into subgroups, as follows(9): in-sufficient weight (< 18.5 kg/m2); normal
weight (18.6–24.9 kg/m2); excessive weight
(25.0–29.9 kg/m2); class I obesity (30.0–
34.9 kg/m2); class II obesity (35.0–39.9 kg/
m2); and class III obesity (> 40.0 kg/m2).
Determination of dose at abdominal CT scans
In the present study, the scans were per-formed in a Siemens Somatom Emotion 6 apparatus, a spiral multislice system (6 slices). For abdominal CT, two protocols were utilized, as follows: a) for a part of the sample (80 patients), a routine protocol of the service was utilized, with 130 kVp, reference of 100 mAs, 6 × 2.0 mm colli-mation, 1.25 pitch, rotation time of 0.6 s; b) for the remaining 20 patients, an earlier protocol was utilized, with 120 mAs refer-ence and 0.85 pitch, with the other param-eters unchanged. The utilization of such two protocols allowed a comparison of the dose values.
DLP = CTDIVol.L
E = EDLP.DLP
CTDIw= ( .CTDI100)centro+ ( . CTDI100)periferia
1 3
2 3
CTDI100 = ∫ D(z)dz
1 NT
50 mm
Some of the patients also underwent pelvic CT scans, besides the abdominal CT. The parameters from such pelvic CT scans were utilized to supplement the present study and to compare the dose values.
Most of the scans comprised two series, a non-contrast-enhanced (pre-contrast) and a contras-enhanced (post-contrast) series, depending on the clinical indications.
Determination of organ dose
The dose to organs was calculated only for those patients who underwent both ab-dominal and pelvic CT, by means of the simulation software CT-Expo V 1.5, based on the Monte Carlo method. All dose cal-culations were performed on mathematical phantoms where the male sex is repre-sented by a 1.70 m tall and 70 kg phantom, while the female sex is represented by 1.60 m tall and 60 kg phantom(10). The follow-ing acquisition parameters were introduced in the calculations: kVp, mAs, feed/rota-tion, collimafeed/rota-tion, beginning and end of the acquisition.
Effect of the automatic exposure control
The CT apparatus utilized in the present study was equipped with an automatic ex-posure control application, the CARE Dose 4D, which allows the tube current modu-lation according to the patient dimensions,
thus obtaining a balance between image quality and low radiation dose levels, i.e., allowing to reduce or increase the effective mAs values, depending upon the patient dimensions(11,12).
RESULTS
The main results obtained in the present study are described in the following para-graphs. Firstly, the results regarding the dose values measured by the CT appara-tus are presented, followed by the results regarding the anthropometric characteris-tics of the patients, the CT scans dose val-ues and the relationship between effective dose and anthropometric characteristics of the patients. Finally, the results regarding organ doses are demonstrated, as well as the effect of the automatic exposure con-trol.
Verification of the CT apparatus dose values
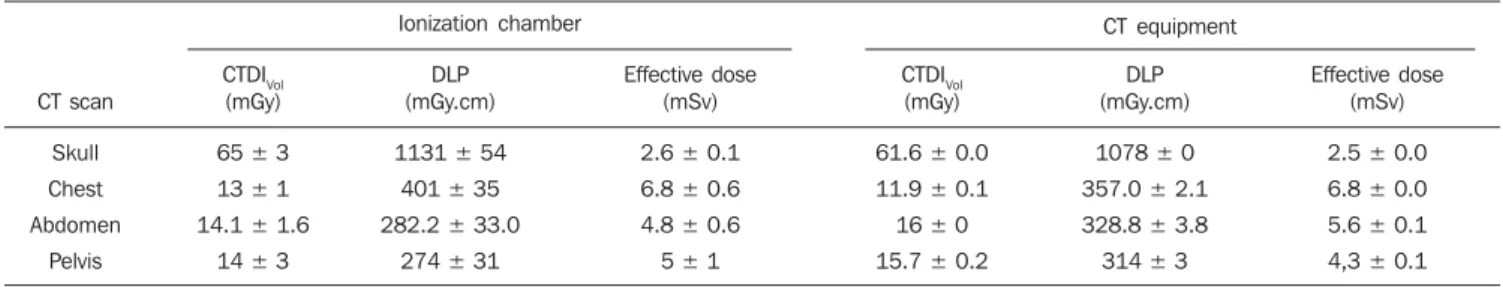
The dose values obtained with the ion-ization chamber and those obtained from the CT Siemens Somatom Emotion 6 ap-paratus on phantoms are presented on Table 1 for routine skull, chest abdomen and pel-vis scans. The reference dose values recom-mended by the European Guidelines are presented on Table 2.
Anthropometric characteristics of the patients
The ages of the patients included in the study sample ranged between 14 and 87 years, and 44 of them were women and 56, men. The patients’ body mass ranged be-tween 39.2 and 104.2 kg, and height ranged between 1.40 m and 1.82 m, with the BMI ranging between 15.9 and 45.4 kg.m2. The
mean values for anthropometric parameters of the sample are the following: 59.5 years of age, height of 1.55 m, 63.63 kg of body mass, 21.99 kg of fat mass, 41.64 kg of lean mass, 30.49 kg of total body water, 93 cm of abdominal perimeter and BMI of 26.51 kg.m2.
Abdominal CT scan dose
All the patients in the sample underwent abdominal CT; among tem 41 underwent only non-contrast-enhanced CT, while the remaining patients underwent both non-contrast-enhanced and non-contrast-enhanced CT. Additionally to the abdominal scan, 63 patients also underwent pelvic CT scans. Out of such patients, 29 underwent non-contrast-enhanced CT, 14 underwent only contrast-enhanced CT, and 20 patients un-derwent both the techniques.
The main clinical indication for such ex-aminations was the presence of a tumor (75%), particularly colon carcinomas
Table 2 CTDIVol, DLP and effective dose values for routine skull, chest, abdomen and pelvis CT scans,
as recommended by the European Guidelines(1).
CT scan Skull Chest Abdomen
Pelvis
Dose reference levels for CT scans in adult patients CTDIVol
(mGy) 60 30 35 35
DLP (mGy.cm)
1050 650 780 570
Effective dose (mSv)
2 12 13 10
(17%) and lung neoplasms (12%). Thus the main organs of interest for diagnosis at abdominal scans were the liver and adre-nal glands for investigation of metastases, while the main organ of interest at the pel-vic scans was the colon, once carcinoma in such an organ is the main clinical indica-tion.
As regards radiation dose received by patients during the abdominal and pelvic
Table 1 Results from the calculation of CTDIVol, DLP and effective dose values for routine skull, chest, abdomen and pelvis CT scans, measured with ionization
chamber and the CT equipment in phantoms.
CT scan Skull Chest Abdomen
Pelvis
Ionization chamber CT equipment
CTDIVol (mGy) 65 ± 3 13 ± 1 14.1 ± 1.6
14 ± 3
DLP (mGy.cm) 1131 ± 54
401 ± 35 282.2 ± 33.0
274 ± 31
Effective dose (mSv) 2.6 ± 0.1 6.8 ± 0.6 4.8 ± 0.6 5 ± 1
CTDIVol (mGy) 61.6 ± 0.0 11.9 ± 0.1 16 ± 0 15.7 ± 0.2
DLP (mGy.cm) 1078 ± 0 357.0 ± 2.1 328.8 ± 3.8 314 ± 3
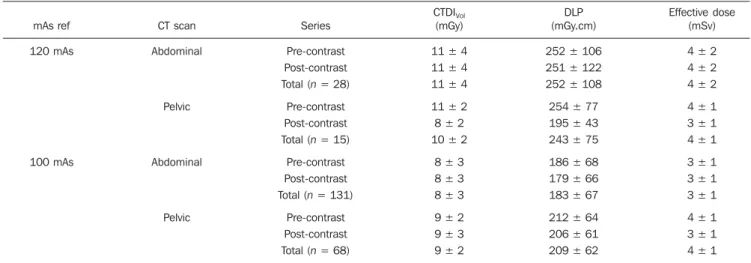
CT scans performed under the different protocols, the mean values for CTDIVol,
DLP and effective dose are presented on Table 3. The values for CTDIVol and DLP
were retrieved from the CT equipment pro-tocols and the effective dose was calculated by means of equation 4.
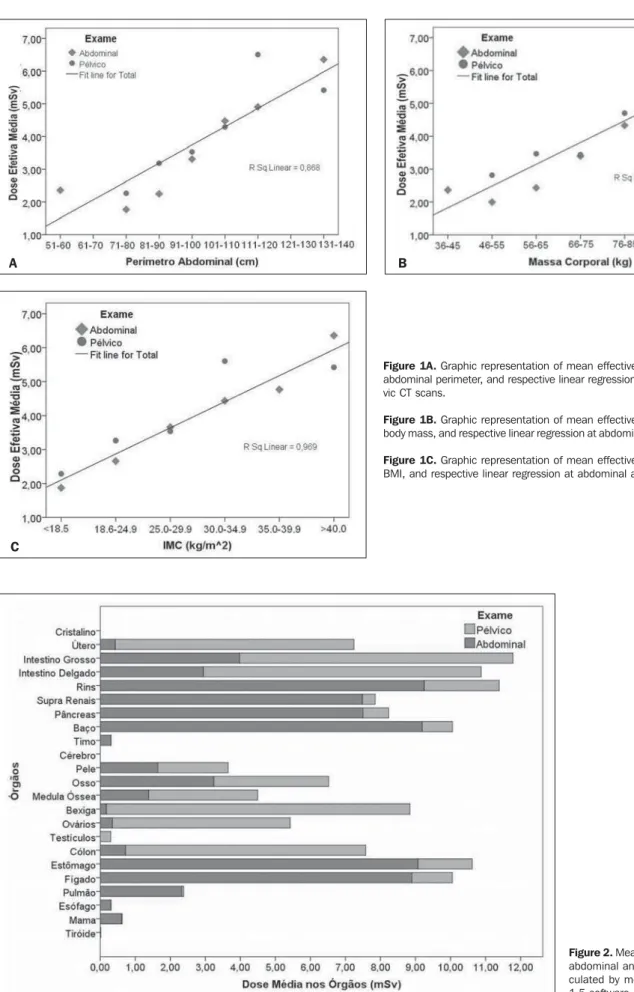
Relationship between effective dose and anthropometric characteristics
With the purpose of establishing the re-lationship between effective dose values (calculated according to equation 4) and patients’ anthropometric characteristics, statistical tests of correlation and linear regression were undertaken. Thus, the ef-fective dose was analyzed as a function of sex, age, height, abdominal perimeter, body mass, fat mass, lean mass, total body wa-ter and BMI. In the analysis as a function of sex, one observed that male patients re-ceived a higher dose during abdominal CT scans and a lower dose during pelvic CT scans, in relation to female patients. As regards age and height, no influence was observed on the effective received dose. As regards patients’ abdominal perimeter, one observed that such factor does influence the received dose, with the same being true with body composition, i.e., the effective dose increases as body mass, fat mass, lean mass, total body water and BMI increase. Figure 1 graphically represents the effec-tive received dose at abdominal and pelvic CT scans as a function of abdominal perim-eter, body mass and BMI. Such parameters are those which most influenced the
effec-tive dose, having been grouped in intervals in order to avoid some results dispersion. The mean effective dose is presented for every such intervals.
The linear regression (R2) results
be-tween effective dose and abdominal perim-eter, body mass and BMI were 0.868, 0.949 and 0.969, respectively, while the correla-tion (Pearson’s R) between the effective dose and such same parameters were 0.694, 0.754 and 0.695 respectively, for p < 0.01.
Dose to organs
As previously mentioned, the mean dose to organs was calculated for each type of scan based on the Monte Carlo method and is represented on the chart on Figure 2. In total, the organs receiving higher ra-diation doses are the large bowel, the small bowel, the kidneys, the adrenal glands, the pancreas, the spleen, the stomach and the liver. At pelvic scans, the organs receiving higher radiation doses are the uterus, the small bowel, the bladder, the ovaries and the colon.
Effect of the automatic exposure control
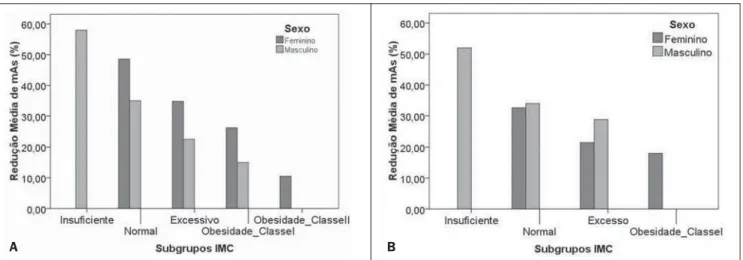
In the evaluation of the automatic expo-sure control, only the CT scans performed with the reference 100 mAs were analyzed. The utilization of the equipment’s software CARE Dose 4D, allowed the adjustment of mAs for the scans, considering the con-trast-enhanced and non-concon-trast-enhanced series, reducing such value in 173 of such series, while increasing it in 22 series and keeping it unchanged in only 4 series. At
the abdominal CT scans, where the mAs reduction occurred, the effective mAs val-ues ranged between 37.0 and 97.0 mAs, while at the pelvic CT scans, under the same conditions, the effective mAs values ranged between 48.0 and 96.0 mAs. The mean mAs reduction at the abdominal CT scans was 35.34%, and at the pelvic scans, the mean reduction was 31.03%. Figure 3 presents the charts of mAs values as a func-tion of patient’s BMI, at abdominal and pelvic CT scans.
As previously mentioned, the CARE Dose 4D software also allows to increase the mAs value in the case of patients with higher BMIs, in such a way to maintain a good diagnostic quality of the images. At the abdominal CT scans, the mAs values ranged between 104.0 and 146.0 mAs, while at the pelvic CT scans the values ranged between 107.0 and 148.0 mAs. The mean increase in mAs value at the abdomi-nal scans was 22.8%, while at the pelvic scans it was 20.1%.
DISCUSSION
Verification of the CT apparatus dose values
The results obtained for the CT equip-ment dose values measured by means of the ionization chamber on the head and body phantoms, demonstrated that the Siemens Somatom Emotion 6 apparatus utilized in the present study was calibrated according to the dose conditions applied in the rou-tine protocols for skull, chest, abdomen and
Table 3 Mean dose values: CTDIVol, DLPand effective dose, at non-contrast-enhanced (pre-contrast) and contrast-enhanced (post-contrast) series of ab-dominal and pelvic CT scans (confidence interval: 95%).
mAs ref 120 mAs 100 mAs CT scan Abdominal Pelvic Abdominal Pelvic Series Pre-contrast Post-contrast Total(n = 28)
Pre-contrast Post-contrast Total (n = 15)
Pre-contrast Post-contrast Total (n = 131)
Pre-contrast Post-contrast Total (n = 68)
CTDIVol
(mGy) 11 ± 4 11 ± 4 11 ± 4 11 ± 2 8 ± 2 10 ± 2
8 ± 3 8 ± 3 8 ± 3 9 ± 2 9 ± 3 9 ± 2
DLP (mGy.cm) 252 ± 106 251 ± 122 252 ± 108 254 ± 77 195 ± 43 243 ± 75 186 ± 68 179 ± 66 183 ± 67 212 ± 64 206 ± 61 209 ± 62
Figure 2. Mean dose to the organs for abdominal and pelvic CT scans, cal-culated by means of the CT-Expo V 1.5 software.
A B
C
Figure 1A. Graphic representation of mean effective dose as a function of abdominal perimeter, and respective linear regression at abdominal and pel-vic CT scans.
Figure 1B. Graphic representation of mean effective dose as a function of body mass, and respective linear regression at abdominal and pelvic CT scans.
pelvis. The results have also demonstrated that the dose values at such CT scans did not exceed the diagnostic reference levels recommended by the European Guide-lines(1).
Abdominal CT scan dose
Most of the patients underwent both contrast-enhanced and non-contrast-en-hanced CT scans (59 patients), and 63 also underwent pelvic CT scans, of which 20 patients were submitted to both series. Based on the dose results obtained at such scans, it was observed that a patient who underwent both abdominal and pelvic CT scans, both with two series, received a to-tal effective dose of 13.29 mSv. As previ-ously mentioned, such dose value repre-sents some risk for induction of cancer, as a dose of 10 mSv has a 1/1,000 probabil-ity of cancer induction(6).
In the present study, two different pro-tocols were utilized, one with 120 mAs and the other with 100 mAs. In the first case the mean effective dose was 4.28 mSv at the abdominal CT scan, and 4.12 mSv at the pelvic CT scan, while in the second case the mean effective dose was 3.12 mSv at the abdominal CT scan, and 3.55 mSv at the pelvic CT scan. With both protocols, the dose values are lower than the diagnostic reference levels (13.25 mSv for abdomen and 9.69 mSv for the pelvis). As expected, the lower the current × time (mAs) prod-uct is, the lower is the dose(7). At the pel-vic CT scans, the mean dose was higher than that at abdominal CT scans. Such
dif-ference is due to the presence of structures with different densities in those regions. The pelvic region is constituted by more bone structures than the abdominal region. Another o fact was that, at contrast-en-hanced scans, the mean effective dose was lower as compared with the non-contrast-enhanced scans. Such a fact is explained by a more restricted range adjustment (acqui-sition area) to the region of interest.
In a study developed in Malaysia on ab-dominal CT scan doses, the effective dose values were higher (7.2 mSv) than those obtained in the present study(13). Such a difference is essentially due to the equip-ment and acquisition protocols being dif-ferent.
Relationship between effective dose and anthropometric characteristics
In the evaluation of the relationship be-tween the effective dose and the patients’ anthropometric characteristics, the results demonstrated that the characteristic with greater relationship with effective dose is the body mass, with a high positive linear correlation (R = 0.754 with p < 0.01). Body mass index (R = 0.695), abdominal perim-eter (R = 0.694), fat mass (R = 0.634), to-tal body water (R = 0.502), lean mass (R = 0.482) and the percentage of fat mass (R = 0.399), in decreasing order, presented a moderate positive linear correlation (p < 0.01). As regards age and height, such char-acteristics did not present any statistical significance in the correlation with the ef-fective dose. The results for efef-fective dose
as a function of sex demonstrate that at the abdominal CT scans, men receive higher doses, while at the pelvic CT scans, women receive the higher doses. Such a fact is due to differences in anatomical shape, as while men present a larger abdominal perimeter than women, women have a higher pelvic perimeter than men.
In another study on the influence of pa-tients’ dimensions on the radiation dose, a positive linear correlation was equally ob-tained between patient’s body mass and tube current, i.e., with the effective dose(7,13).
Dose to organs
As regards the results for dose to organs, it was observed that the organs receiving the higher doses are small bowel, large bowel, uterus, kidneys, adrenal glands, pancreas, spleen, bladder, ovaries, colon, stomach and liver, since they are the main organs positioned in the region of interest and the most radiosensitive ones.
Toossi & Dastgherdi have studied the dose to organs at CT scans performed in Iran by means of the CT-Dose software, and concluded that the organs which re-ceived higher doses were the same as in the present study(14).
Effect of the automatic exposure control
In the present study, all the scans were performed with the automatic exposure control, utilizing the CARE Dose 4D ap-plication of the CT equipment. Such method allowed the reduction of the radia-tion dose by means of the decrease of mAs
Figure 3. Graphic representation of mean mAs reduction as a function of BMI subgroup at abdominal (A) and pelvic (B) CT scans performed at the 100 mAs reference, for both male and female patients.
value. The maximum reduction of the mAs value was 63.0% at the abdominal CT scans and 52% at the pelvic scans. The mAs reduction represents a reduction of the equivalent dose, as the dose linearly varies with mAs when all other acquisition pa-rameters are maintained at constant values. Notwithstanding such dose reduction, the application also allowed the increase in mAs values in the cases of patients with higher BMI, so as to maintain the good di-agnostic quality of the images, conse-quently increasing the dose to such pa-tients.
In a study developed by Tack et al., it was observed that the reduction in effective mAs was of 15% to 20%, and that such reduction was significantly lower in men than in women, with such a difference be-ing associated to BMI(15).
Recommendations for dose optimization
The present study has allowed the inves-tigation of the several factors which influ-ence the effective dose received by patients who undergo CT scans, making it possible to develop a set of recommendations in order to optimize the dose in such cases, as follows:
1) Detectors sensitivity – Upon the ac-quisition of CT equipment, it is important to raise questions on the performance of the system and on dose reduction. The appa-ratuses from different manufacturers are not similar in what concerns detector sen-sitivity and performance.
2) Maintenance and equipment quality control – The repetition of a scan due to equipment failure increases the dose with-out any benefit to the patient. The imple-mentation of a quality control program al-lows the minimization of such type of in-cident.
3) Justification for the scans – The risk/ benefit factor should be carefully studied, as well as the possibility of resorting to other imaging methods which does not rely on ionizing radiation.
4) Diagnostic reference levels – Such levels must be considered so as not to be exceeded during CT scans.
5) Limit the acquisition area to the re-gion of interest – a significant dose reduc-tion can be obtained by means of a correct range positioning.
6) Limit the number of series necessary for diagnosis – The performance of con-trast-enhanced or multi-phase scans of the liver and kidney automatically results in doubling or tripling the dose.
7) Reduce the exposure parameters – The dose to patients is directly related to mAs. However, some aspects regarding image quality (contrast resolution, for ex-ample) are affected by dose reduction. Thus a proper balance must be found between dose and image quality, where higher noise levels (lower dose) compatible with diag-nostic accuracy can be obtained.
8) Adjust the exposure parameters to the patient’s dimensions – The utilization of automatic exposure control applications is a way to reduce the dose according to the patient’s dimensions. In children, pediatric protocols should be utilized, with the ex-posure parameters adjusted to reduce the dose to such patients according to their ages.
9) Adjust the acquisition parameters to the type of scan – In follow-up CT scans, it is possible to reduce the dose, as the main objective of such scans is to monitor the progression of a known lesion. It is impor-tant to highlight that in such cases, the num-ber of series to be performed can be re-duced, for example, by performing the non-contrast-enhanced scan only for the liver.
10) Training and investigation – Review of the protocols utilized in the institution and comparison of image quality and dose with the ICRP recommendations. Training on dose reduction techniques is of utmost importance.
The present study should by supple-mented by further investigations with a larger sample, since time scarcity was a limiting factor faced by the authors. A study comprising other CT equipment models may also be developed, allowing a com-parison of data obtained with different ap-paratuses. The CT-Expo software also al-lows dose simulations in other apparatuses, as well as the utilization of other acquisi-tion parameters, allowing comparison be-tween results.
CONCLUSION
The results obtained in the present study lead to the conclusion that the received
radiation dose during abdominal CT scans depend upon some of the patients’ charac-teristics, making it important to adjust the acquisition parameters to the patient’s di-mensions. An effective method is the uti-lization of the automatic exposure control, which allows decreasing or increasing tube current according to the patient’s dimen-sions. However, in the case of children, such method alone is not enough. Because of such patients’ greater radiosensitivity, special attention should be placed on the utilization of pediatric protocols and in tak-ing all necessary precautions, as well as on complying with all the principles of radio-logical protection.
In some types of CT scans it is possible to perform the image acquisition with a lower dose to the patients. However, that leads to an increase in image noise. Such increased noise is acceptable, provided the images are sufficient to allow an efficient clinical diagnosis (ALARA principle – As Low As Reasonably Achievable).
Acknowledgements
The authors wish to thank the Radiol-ogy Department of Hospital de Faro, EPE, Dr. Maria Helena Gomes, the radiology technician Vítor Ferreira, Professors Con-ceição Abreu and Maria Palma and Engi-neer João Pires, for the valuable assistance.
REFERENCES
1. International Commission on Radiological Pro-tection. Managing patient dose in computed to-mography. ICRP Publication 87. Ann ICRP. 2000;30(4).
2. Paterson A, Frush DP. Dose reduction in paedi-atric MDCT: general principles. Clin Radiol. 2007;62:507–17.
3. Silva MSR, Khoury HJ, Borrás C, et al. Dosime-tria de pacientes e médicos em intervenções co-ronárias percutâneas em Recife, Pernambuco, Brasil. Radiol Bras. 2011;44:90–6.
4. Dalmazo J, Elias Jr J, Brocchi MAC, et al. Oti-mização da dose em exames de rotina em tomo-grafia computadorizada: estudo de viabilidade em um hospital universitário. Radiol Bras. 2010; 43:241–8.
5. European Medical ALARA Network. Optimisa-tion of Patient Exposure in CT Procedures. WG1 - SynthDoc - revised3-2011.
6. The National Academies Press. Health risks from exposure to low levels of ionization radiation: BEIR VII phase 2 (2006). [cited 2010 May 15]. Available from: http://www.nap.edu/openbook. php?isbn=030909156X
7. McNitt-Gray MF. AAPM/RSNA physics tutorial for residents: topics in CT. Radiation dose in CT. Radiographics. 2002;22:1541–53.
Ra-diation dose in CT. Radiographics. 1992;12: 1225–43.
9. World Health Organization. Global database on body mass index. BMI classification. 2008. [cited 2010 July 12]. Available from: http://www.who.int/ bmi/index.jsp?introPage=intro_3.html 10. Stamm G, Nagel HD. User’s guide CT-Expo V 1.5.
A tool for dose evaluation in computed tomogra-phy. Hannover-Hamburg; 2005.
11. Imhof H, Schibany N, Ba-Ssalamah A, et al.
Spi-ral CT and radiation dose. Eur J Radiol. 2003; 47:29–37.
12. Aldrich JE, Chang SD, Bilawich AM, et al. Ra-diation dose in abdominal computed tomography: the role of patient size and the selection of tube current. Can Assoc Radiol J. 2006;57:152–8. 13. Ali MH. Trends in CT abdominal doses in
Ma-laysian practices [tese de doutoramento]. Sidney: Faculty of Health Sciences, University of Sydney; 2005.
14. Toossi MT, Dastgherdi SM. An assessment of or-gan and effective dose of patients who undertake CT examinations in two teaching hospitals of Mashhad&Isfahan. 11th International Congress of International Radiation Protection Association; 2004 May 23-28; Madrid, Spain.