184
Handgrip Strength Evaluation on Tennis Players
Using Different Recommendations
ORIGINAL ARTICLE
Hugo Maxwell Pereira1,2
Maryela de Oliveira Menacho3,2
Ricardo Hisayoshi Takahashi4
Jefferson Rosa Cardoso5,2
1. Department of Physical Therapy Marquette University - USA 2. Master in Physical Education, State University of Londrina - UEL, Londrina PR, Brazil
3. Aparicio Carvalho Integrated Colleges - Porto Velho - RO 4. Self-employed physiotherapist São Paulo - SP
5. Physiotherapy Department and Laboratory of Kinesiological Electromyography and Kinematics of the State University of Londrina Londrina - PR
Mailing address:
Hospital Universitário Regional Norte do Paraná - Departamento de Fisioterapia - Laboratório de Eletromiografia Cinesiológica e Cinemática. Av. Robert Kock, 60 86038-440 - Londrina, PR. E-mail: jeffcar@uel.br
AbSTRAcT
It is important to assess the handgrip strength (HS) in competitive tennis players due to asymmetry between the dominant and contra lateral hands that players might develop. In order to assess HS, clinicians can use separate, already established protocols (from European Test of Physical Fitness Handbook [Eurofit] or American Society of Hand Therapists [ASHT]. The objective of this study was threefold: Firstly to compare the HS using the Eurofit and ASHT technique; secondly to compare HS between dominant/non-dominant hands, and last, to compare the handgrip between different ages of juvenile tennis player athletes. 137 male and 45 female tennis players (aged between 8 and 18 years) participated in the study. In order to assess HS following the Eurofit and ASHT recommendations, a Jamar dynamometer was used. None of the athletes had any injury that could compromise tests. There was no difference in handgrip strength between Eurofit and ASHT recommendations regardless of sex. The best curve to describe the regression of HS and age for both genders was a sigmoid function. Males presented a higher slope at 11 years and females had a higher slope at 10 years. Moreover, in male athletes dominant HS presented higher values than non-dominant HS beginning at 14 years. However, for the females the asymmetry in HS did not occur for any age until 18 years.
Keywords: Tennis, Hand strength, Child. Adolescent, Racket Sports.
LOcOMOTOR APPARATUS IN EXERcISE AND SPORTS
INTRODUcTION
Due to its simplicity, low cost and technique reproducibility, the handgrip strength measurement (HS) is widely used to
as-sess hand injuries(1,2). HS can be assessed on the patient’s first
visit to the clinician who, following predetermined standard parameters, can consequently plan the treatment. Interestingly, during HS the carpi extensors need to contract avoiding the flexor moment generated on the wrist; hence, individuals with lateral epicondylitis present pain during HS. Therefore, HS may be used as a functional outcome to help in the discharge after
a treatment(3,4). Using the HS it is also possible to estimate the
body composition and mortality rate(5,6). Some HS normality
values for subjects who do not present injuries have been
de-termined(7,8); however, the use of these values for tennis players
brings problems, because training with a racket may produce a neuromuscular adaptation which consequently increases the HS of the dominant hand.
Studies mention asymmetry between the dominant and
con-tralateral upper limbs for tennis players(9,10). Such asymmetry has
been attributed to intrinsic characteristics of the sports gesture and hampers the use of the contralateral limb as reference dur-ing a treatment. Moreover, a possible correlation between HS
and lateral epicondylitis of the humerus has been proposed(11,12).
This injury presents a long recovery process(13) and, therefore, it
is believed that the HS is very useful tool in the assessment of
these athletes(11). Nevertheless, specific HS values for the junior
tennis players have not been found.
In order to assess the HS there are two well-spread guidelines; one recommends the elbow evaluation in extension (European
Test of Physical Fitness – Eurofit)(14) while the other suggests
el-bow flexion (American Society of Hand Therapists – ASHT)(15).
Due to this divergence, there are studies such as the one by
Vianna et al.(8) and Chau et al.(16) which use in their evaluation
pro-tocol the elbow in extension, while other studies such as the ones
by Armstrong and Oldham(17), Figueiredo et al.(2) and Anakwe et
al.(18) that use the elbow in flexion. This disagreement between
references causes difficulties when comparing different studies. The elbow position may influence on the HS, since the mus-culature which moves the wrist also passes through the elbow; therefore, alterations in the flexors tension/length ratio could
alter the result of the test(11). Additionally, it should be considered
that in order to increase the HS is it necessary not only greater recruiting of flexor muscles, but also to increase the activity of the extensor muscles with the aim to keep the wrist in slight
extension(18). Thus, the alteration of the elbow position could
also alter the relation between the flexor and extensor muscles and allow better wrist functioning.
185
the individual, such as the muscular area of the forearm(18),
pres-ence of hormones(19), body composition(20) and physical fitness
(21). Thus, the existence of a HS reference value for tennis players
would be also valuable to track the development of adolescents from this modality.
Consequently, due to divergence between positioning guide-lines for HS assessment and the importance of this measure in tennis athletes, the aims of this study were: 1) to compare HS in the guidelines suggested by the Eurofit and ASHT; 2) to com-pare HS between the dominant and contralateral sides and 3) to evaluate the nature of the association between HS and age.
METHOD
PARTIcIPANTS
As inclusion criterion, the tennis players should be from the junior category affiliated with the Brazilian Tennis Confederation with regular participation in the championships organized by this entity. The individuals should have not presented any injury in the upper limbs for at least two months. 182 tennis players, 137 male (aged between nine and 18 years) and 45 female (aged between eight and 17 years) were evaluated. On average the tennis players trained 13 (SD = 3.5) hours / week. All of them were divided into the game categories 10, 12, 14, 16 and 18 years old (table 1). Training time of these athletes was categorized as follows: two to five years; six to nine years and over 10 years. The most recurrent frequency in the categories 10, 12, 14, 16 and 18 years was, respectively: two to five years; two to five years; six to nine years; six nine years and over 10 years. The parents or legal guardians of the participants signed a consent from according to resolution form the National Health Committee/Ministry of Health – 196/96, approved by the Ethics Committee of the in-volved Institution (190/06).
evaluator. Firstly, the tennis players performed one trial with each hand for familiarization. This trial was excluded in the analysis.
HS measurement with flexed elbow was performed follow-ing guidelines from the American Society of Hand Therapists (ASHT). The athlete was hence placed with adducted shoulder, elbow flexed at 90°, forearm at neutral position and wrist
be-tween 0° and 30° of extension(7,15). HS measurement with the
elbow in extension was obtained according to guidelines from the European Test of Physical Fitness (Eurofit) with the individ-ual standing and keeping the dynamometer in a comfortable
way without body contact(14). The order of the tests (Eurofit
or ASHT) was randomized. In both positions, the athlete was instructed to squeeze the dynamometer as strong as possible, for three consecutive times and the highest value was used
for the analyses(22).
Statistical analysis
Normality distribution was verified by the Shapiro-Wilk test. To compare HS between: dominant and contralateral hands; game categories; and guideline used, a 3 factor (2 x 5 x 2) analysis of variance was used with repeated measures on hand (dominant vs contralateral) and guideline used (Eu-rofit vs ASHT). Mauchly’s sphericity test was applied and, in case it was violated, technical corrections were performed by the Greenhouse-Geisser test. When the F test was significant, multiple comparisons were performed by the Bonferroni post hoc test. Interactions were also evaluated. Intraclass correlation coefficient (ICC) and Bland & Altman plots were used to verify the agreement between techniques (Eurofit versus ASHT) and agreement between hands (dominant versus contralateral). The sigmoid function best described the regression between the HS variation with age. Boundary age in the HS curve was de-termined using dummy variables. Significance was set in 5% (P ≤ 0.05) and the analysis were performed in the SPSS software, version 13.0. The plots were designed with the SigmaPlot 7.101 software. The MedCalc 11.3.0.0 software was used for Blant-Altman agreement analysis.
RESULTS
Table 2 shows the HS mean and standard deviation in the two different guidelines divided by category. For the male group, the comparisons between the dominant and contralateral hands did not present statistically significant differences in the categories 10 and 12 years in both guidelines of the test. However, in the categories 14, 16 and 18 years, the dominant hand presented greater HS compared to the contralateral, regardless of the guide-line used.
Table 2 also present that for the young males, comparison between Eurofit and ASHT guidelines did not show any statistical difference for any game category.
Furthermore, table 2 shows that no comparison for the female gender presented statistically significant difference; that is to say, the dominant side presents the same HS as the contralateral side and no difference was observed in the HS when guidelines were compared.
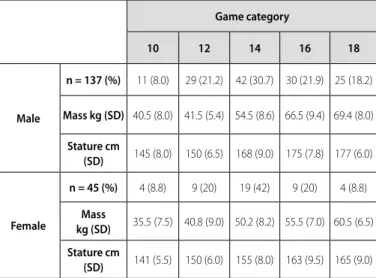
Table 1. Athletes distribution in gender and game categories.
Game category
10 12 14 16 18
Male
n = 137 (%) 11 (8.0) 29 (21.2) 42 (30.7) 30 (21.9) 25 (18.2)
Mass kg (SD) 40.5 (8.0) 41.5 (5.4) 54.5 (8.6) 66.5 (9.4) 69.4 (8.0)
Stature cm
(SD) 145 (8.0) 150 (6.5) 168 (9.0) 175 (7.8) 177 (6.0)
Female
n = 45 (%) 4 (8.8) 9 (20) 19 (42) 9 (20) 4 (8.8)
Mass
kg (SD) 35.5 (7.5) 40.8 (9.0) 50.2 (8.2) 55.5 (7.0) 60.5 (6.5)
Stature cm
(SD) 141 (5.5) 150 (6.0) 155 (8.0) 163 (9.5) 165 (9.0) Mass and stature are presented in mean and standard deviation (SD).
Test protocol and variables
186
Regarding the female gender, the HS comparisons between any game categories did not present statistically significant difference, regardless of the hand assessed or the protocol for assessing HS. Contrary to what occurred to the male group, no significant difference was observed in the HS between the younger game categories (10 or 12 years) compared to the older categories (16 or 18 years).
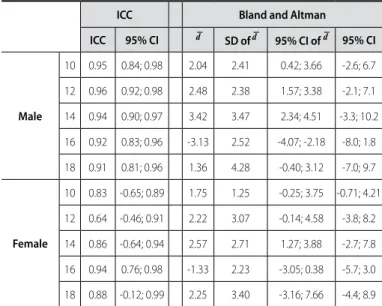
Tables 3-6 show the ICC values and the Bland & Altman agree-ment results. It is possible to observe that in the comparison between the dominant and contralateral sides, the ICC values are small and the Bland and Altman plot presents a large limit of agreement. When the techniques are compared (Eurofit vs. ASHT), regardless of the hand assessed (dominant or contralat-eral), the ICC values are higher and the Bland and Altman pre-sented smaller limits of agreement.
Table 2. HS comparison (kgf ) in the game categories.
HS – Mean (standard deviation)
ASHT Euroit
D hand ND hand D hand ND hand
Male
10 16.0 (6.8) a 16.6 (3.8) b 19.0 (5.1) 18.7 (8.1)
12 18.7 (4.2) a 13.5 (4.0) b 20.4 (5.0) 27.1 (32.5)
14 25.7 (7.2) a 15.5 (4.1) * b 29.6 (7.1) 18.3 (3.7) ‡
16 33.1 (5.7) a 22.2 (4.4) * b 38.1 (3.3) 24.1 (4.2) ‡
18 44.2 (7.4) a 20.1 (5.5) * b 48.4 (9.0) 21.5 (7.0) ‡
Female
10 11.0 (2.5) a 9.0 (2.9) b 14.0 (2.1) 10.7 (2.2)
12 16.5 (3.6) a 13.7 (4.2) b 18.5 (3.1) 14.2 (1.8)
14 20.2 (6.6) a 16.0 (7.0) b 23.5 (7.8) 19.0 (6.9)
16 27.5 (6.1) a 23.5 (5.5) b 31.5 (5.9) 25.7 (6.9)
18 32.5 (9.1) a 28.5 (6.3) b 34.7 (11.8) 30.7 (5.1)
D = dominant; ND = non-dominant.
* = P < 0.05 for D hand x ND hand in the ASHT guideline. ‡ = P < 0.05 for D hand x ND hand in the Eurofit guideline.
a = P > 0.05 in the comparison between D hand in the ASHT guideline and D hand in the Eurofit guideline. b = P > 0.05 in comparisom between ND hand in the ASHT guideline with the ND hand in the Eurofit guideline.
Table 3. Concordance values between dominant and contralateral hands using the ASHT guideline.
Icc bland and Altman
Icc 95% cI d SD of d 95% cI of d 95% cI
Male
10 0.33 -1.33; 0.81 -0.59 7.16 -5.40; 4.22 -14.6; 13.4
12 -0.22 -1.57; 0.42 -1.86 10.55 -5.85; 2.15 -22.5; 18.8
14 0.44 -0.20; 0;70 3.40 9.48 0.44; 6.36 -15.18; 22.0
16 -0.08 -1.10; 0.51 6.23 9.06 2.84; 9.61 -11.5; 24.0
18 -0.53 -0.76; 0.19 16.6 11.2 12.0; 21.3 -5.3; 38.7
Female
10 0.67 -0.31; 0.97 -2.00 1.41 -4.25; 0.25 -4.77; 0.77
12 0.70 0.17; 0.92 2.77 1.64 1.51; 4.03 -0.43; 6.00
14 0.69 0.23; 0.88 5.05 1.89 4.13; 5.96 1.32; 8.77
16 0.77 0.06; 0.94 2.55 4.41 -0.84; 5.95 -6.10; 11.21
18 0.74 -0.18; 0.98 5.00 3.55 -0.66; 10.66 -1.97; 11.97 ICC = intraclass correlation coefficient (one factor – random effect); d = mean difference; SD = standard deviation. CI = confidence interval and CT = concordance threshold.
Table 5. Concordance values between the ASHT and the Eurofit for dominant hand.
Icc bland and Altman
Icc 95% cI d
SD of d 95% cI of d 95% cI
Male
10 0.80 0.30; 0.94 2.90 2.66 1.12; 4.69 -2.3; 8.1
12 0.86 0.71; 0.93 2.55 2.59 1.56; 3.54 -2.5; 7.6
14 0.86 0.75; 0.92 3.50 3.18 2.50; 4.49 -2.7; 9.7
16 0.80 0.57; 0.90 4.83 4.01 3.33; 6.33 -3.0; 12.7
18 0.80 0.48; 0.90 4.72 5.01 2.65; 6.78 -5.1; 14.5
Female
10 0.50 -4.0; 0.96 3.00 1.41 0.74; 5.20 0.2; 5.7
12 0.82 0.26; 0.95 2.33 2.34 0.53; 4.13 -2.2; 6.9
14 0.80 0.47; 0.92 3.68 2.60 2.42; 4.93 -1.4; 8.7
16 0.81 0.24; 0.95 4.22 2.63 2.19; 6.24 -0.9; 9.3
18 0.94 0.48; 0.99 1.25 5.18 -7.00; 9.50 -8.9; 11.4 Icc = intraclass correlation coefficient (one factor – random effect); d = mean difference; SD = standard deviation. CI = confidence interval and CT = concordance threshold.
Table 6. Concordance values between the ASHT and the Eurofit for non-dominant hand.
Icc bland and Altman
Icc 95% cI d
SD ofd 95% cI of d 95% cI
Male
10 0.95 0.84; 0.98 2.04 2.41 0.42; 3.66 -2.6; 6.7
12 0.96 0.92; 0.98 2.48 2.38 1.57; 3.38 -2.1; 7.1
14 0.94 0.90; 0.97 3.42 3.47 2.34; 4.51 -3.3; 10.2
16 0.92 0.83; 0.96 -3.13 2.52 -4.07; -2.18 -8.0; 1.8
18 0.91 0.81; 0.96 1.36 4.28 -0.40; 3.12 -7.0; 9.7
Female
10 0.83 -0.65; 0.89 1.75 1.25 -0.25; 3.75 -0.71; 4.21
12 0.64 -0.46; 0.91 2.22 3.07 -0.14; 4.58 -3.8; 8.2
14 0.86 -0.64; 0.94 2.57 2.71 1.27; 3.88 -2.7; 7.8
16 0.94 0.76; 0.98 -1.33 2.23 -3.05; 0.38 -5.7; 3.0
18 0.88 -0.12; 0.99 2.25 3.40 -3.16; 7.66 -4.4; 8.9
ICC = intraclass correlation coefficient (one factor – random effect); d = mean difference; SD = standard deviation. CI = confidence interval and CT= concordance threshold.
Table 4. Concordance values between dominant hand and contralateral hand using the Eurofit guideline.
Icc bland and Altman
Icc 95% cI d
SD of d 95% cI of d 95% cI
Male
10 0.07 -2.79; 0.70 0.27 10.01 -6.45; 6.99 -19.3; 19.8
12 0.30 -1.72; 0.39 -6.13 25.69 -15.91; 3.63 -56.5; 44.2
14 0.45 -0.01; 0.70 3.47 11.19 -0.01; 6.96 -18.4; 25.4
16 0.23 -1.56; 0.41 7.93 9.51 4.38; 11.48 -10.7; 26.5
18 0.55 -6.75; 0.53 20.0 9.72 16.02; 24.05 -5.9; 32.1
Female
10 0.27 -6.22; 0.95 -3.25 1.50 -5.63; -0.86 -6.1; 0.31
12 0.65 -0.07; 0.90 2.88 2.08 1.28; 4.49 -1.2; 6.9
14 0.44 -0.41; 0.78 6.15 3.98 4.23; 8.08 -1.6; 13.9
16 0.52 -3.71; 0.96 -5.44 2.96 -7.72; -3.16 -11.2; 0.3
187
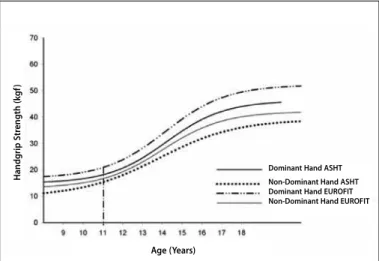
Figure 1 shows the HS variation according to age in the male group and depicts the 11 years old with steeper HS slope.
The equation which represents the HS of dominant side, ac-cording to the guidelines by the ASHT, is: HS = 14.99 + [31.19 /
(1+exp -(Age – 14.19) / 1.46)] with R2 = 0.67 (figure 1). While the equation
for the non-dominant side in the male gender is: HS = 9.80 +
[29.37 / (1+exp -(Age – 13.84) / 1.95)] with R2 = 0.63 (figure 1).
DIScUSSION
The main hypothesis of this study was that there was no difference between the guidelines to assess HS. The results pre-sented here support this hypothesis; however, we must consider the presence of type II error in the sample of the female gender. The data from the Brazilian Tennis Confederation presents the number of female tennis players as approximately one third of the male ones for the youth categories. This fact added to the inclusion criterion of the sample provided the difference between the number subject tested.
Other studies evaluated the difference in elbow position to assess the HS in non-athletes and the results are clashing. Kuzala
and Vargo(23) found greater HS with extended elbow for adults,
while Mathiowetz et al.(24) mentioned greater HS with elbow
flexed at 90 degrees in female occupational therapy students.
The study by Su et al.(25) refers greater HS value with elbow in
extension for Chinese adults. These authors also suggest that the ethnic variation is decisive for the chosen guideline for HS assessment. Other factors which should be considered in the HS evaluation are the sports activity and age, characteristics which are approached in the present study.
A condition which can influence the chosen test guideline is the presence of lateral epicondylitis of the humerus. De Smet
and Fabry(26) investigated the relation between this condition and
the chosen guideline to assess HS in non- athletes and found lower HS in elbow extension only in the limb with the condition. Due to the difficulty in choosing suitable treatment for lateral
epicondylitis of humerus in tennis players(26), the equations of the
present study are an interesting instrument for the estimation of the suitable HS value, which would enable adequate return to the sport based on HS evaluations specific to tennis players.
Some studies show that adult tennis players present
altera-tion in the body composialtera-tion of the dominant side(9,10); these
alterations are influenced by the hormonal presence, a fact which justifies the reason why the difference between limbs occurs from 14 years old in the male gender. Other aspects besides
hormonal ones, such as the enzymatic activity(27), muscle fiber
composition(28) and stage of maturation(29), also present
correla-tion with strength development in adolescents. Thus, the influ-ence of metabolic factors should be specifically investigated for tennis players under development in future studies.
HS difference between the dominant and contralateral limbs
has been approached by Lucki and Nicolay(30) in tennis players
aged between 19 and 24 years. These authors demonstrated greater HS of the dominant hand compared to the contralateral
one both for men and women. Sartorio et al.(31) studied a sample
of individuals from both sexes who did not practice sports and found greater HS of dominant hand from nine years old. How-ever, the metabolic factors of the difference between limbs and its variation according to age for adolescent tennis players have not been explored.
One of the indicators of the hormonal participation would be an increase in the HS strength. The study by Marrodán Serrano
et al.(20) presented greater HS increase for the female gender at
nine years of age, and at 13 years of age for the male gender. The test recommendation, according to the guidelines by the
Eurofit, has the equation HS = 16.82 + [35.35 / (1+exp-(age – 14.14) / 1.54)]
for the dominant side with R2 = 0.71. In the non-dominant side,
with the same guideline, the equation is: HS = 13.07 + [29.07 /
(1+exp-(Age – 14.00)/1.54)] with R2 = 0.66 for the male gender (figure 1).
Regarding the female group, 10 years old represents the steeper slope on HS (figure 2). The equation which define strength for the dominant side in this gender according to the ASHT is:
HS = 5.06 + [36.61/(1+exp-(age – 13.25)/2.51)] with R2= 0.70. While
for the non-dominant side, according to the ASHT, the
equa-tion is: HS = 6.81+ [27.01 / (1+exp-(age - 13.56)/1.81)] with R2 = 0.68.
The dominant side, according to the guidelines by the Eurofit, for the female gender, presents the equation HS = 10.30 + [26.72
/ (1+exp-(age-12.34) / 1.53)] with R2 = 0.64. The non-dominant side
presents HS = 7.01 + [31.25 / (1 exp-(age – 13.59)/2.31)] with R2 = 0.68.
All equations are represented by figures 1 and 2.
Figure 1. HS variation according to age in the male gender.
Handg
rip S
tr
ength (k
g
f)
Dominant Hand ASHT
Non-Dominant Hand ASHT Dominant Hand EUROFIT Non-Dominant Hand EUROFIT
Age (Years)
Figure 2. HS variation according to age in the female gender.
Handg
rip S
tr
ength (k
g
f)
Age (Years)
Dominant Hand ASHT
188
The comparison of boundary ages in the increase of HS strength with the present study could be an indication that the sports activity would be responsible for acceleration in maturation. Nevertheless, there is usually variability of this boundary ages
between studies. One example is shown by Sartorio et al.(31), in
which the increase in HS is steeper at 11 years old regardless of gender. Both authors evaluated individuals who do not practice any sports activity.
cONcLUSION
HS evaluation did not present difference between the test protocols suggested by the ASHT and the Eurofit. The dominant side of tennis players presented greater HS compared to the contralateral side only for the male gender from the category 14 years old, regardless of the protocol used for HS evalua-tion. Women did not present asymmetry in the HS
compari-son between sides, regardless of the type of protocol used for evaluation; however, one should consider the smaller number of female individuals assessed. HS presents a steep increase for11 years old in the male group and from 10 years old in the female group.
Subtitle: exp is approximately equal to: 2.718 (exp = exponential).
AcKNOWLEDGEMENT
The authors thank the researcher Lauro Casqueiro Vianna, a postdoctoral student in the Department of Pharmacology and Physiology of the University of Missouri-Columbia, for his help with the statistical analyses.
All authors have declared there is not any potential conflict of interests concerning this article.
REFERENcES
1. Innes E. Handgrip strength testing: A review of the literature. Aust Occup Ther J 1999;46:120-40. 2. Figueiredo IM, Sampaio RF, Mancini MC, Nascimento MC. Ganhos funcionais e sua relação
com os componentes de função em trabalhadores com lesão de mão. Rev Bras Fisioter 2006;10:421-7.
3. Rosenberg N, Soudry M, Stahl S. Comparison of two methods for the evaluation of treatment in medial epicondylitis: pain estimation vs grip strength measurements. Arch Orthop Trauma Surg 2004;124:363-5.
4. Olaussen M, Holmedal Ø, Lindbaek M, Brage S. Physiotherapy alone or in combination with corticosteroid injection for acute lateral epicondylitis in general practice: a protocol for a randomised, placebo-controlled study. BMC Musculoskelet Disord 2009;4;10:152.
5. Rebelatto JR, Calvo JI, Orejuela JR, Portillo JC. Influência de um programa de atividade física de longa duração sobre a força muscular manual e a flexibilidade corporal de mulheres idosas. Rev Bras Fisioter 2006;10:127-32.
6. Gale CR, Martyn CN, Cooper C, Sayer AA. Grip strength, body composition, and mortality. Int J Epidemiol 2007;36:228-35.
7. Mathiowetz V, Wiemer DM, Federman SM. Grip and pinch strength: norms for 6 to 19 year-olds. Am J Occup Ther 1986;40:705-11.
8. Vianna LC, Oliveira BR, Araujo CG. Age-related decline in handgrip strength differs according to gender. J Strength Cond Res 2007;21:1310-4.
9. Ducher G, Jaffre C, Arlettaz A, Benhamou CL, Courteix D. Effects of long-term tennis playing on the muscle bone relationship in the dominant and nondominant forearms. Can J Appl Physiol 2005;30:3-17.
10. Juzwiak CR, Amancio OM, Vitalle MS, Szejnfeld VL, Pinheiro MM. Effect of calcium intake, tennis playing, and body composition on bone-mineral density of Brazilian male adolescents. Int J Sport Nutr Exerc Metab 2008;18:524-38.
11. Dorf ER, Chhabra AB, Golish SR, McGinty JL, Pannunzio ME. Effect of elbow position on grip strength in the evaluation of lateral epicondylitis. J Hand Surg Am 2007;32:882-6. 12. Alizadehkhaiyat O, Fisher AC, Kemp GJ, Vishwanathan K, Frostick SP. Upper limb muscle
imbalance in tennis elbow: a functional and electromyographic assessment. J Orthop Res 2007;25:1651-7.
13. Silva RT, Cohen M, Matsumoto MH, Gracitelli GC. Avaliação das lesões ortopédicas em tenistas amadores competitivos. Rev Bras Ortop 2005;40;270-9.
14. Adam C, Klissouras V, Ravazzlo M, Renson R, Tuxworth W, eds. Eurofit: European test of physical fitness. Rome: Council of Europe and Italian National Olympic Committee, 1988. 15. American Society of Hand Therapists. Clinical assessment recommendations. Chicago; 1992. 16. Chau N, Pétry D, Bourgkard E, Huguenin P, Remy E, André JM. Comparison between estimates
of hand volume and hand strengths with sex and age with and without anthropometric data in healthy working people. Eur J Epidemiol 1997;13:309-16.
17. Armstrong CA, Oldham JA. A comparison of dominant and non-dominant hand strengths. J Hand Surg Br 1999;24:421-5.
18. Anakwe RE, Huntley JS, McEachan JE. Grip strength and forearm circumference in a healthy population. J Hand Surg Eur Vol. 2007;32:203-9.
19. Hansen L, Bangsbo J, Twisk J, Klausen K. Development of muscle strength in relation to training level and testosterone in young male soccer players. J Appl Physiol. 1999;87:1141-7. 20. Marrodán Serrano MD, Romero Collazos JF, Moreno Romero S, Mesa Santurino MS, Cabañas
Armesilla MD, Pacheco Del Cerro JL, González-Montero de Espinosa M. Handgrip strength in children and teenagers aged from 6 to 18 years: Reference values and relationship with size and body composition. An Pediatr (Barc) 2009;70:340-8.
21. Castro-Piñero J, Artero EG, España-Romero V, Ortega FB, Sjöström M, Suni J, Ruiz JR. Criterion-related validity of field-based fitness tests in youth: A systematic review. Br J Sports Med 2009;12 [in press].
22. Haidar SG, Kumar D, Bassi RS, Deshmukh SC. Average versus maximum grip strength: which is more consistent? J Hand Surg Br 2004;29:82-4.
23. Kuzala EA, Vargo MC. The relationship between elbow position and grip strength. Am J Occup Ther 1992;46:509-12.
24. Mathiowetz V, Rennells C, Donahoe L. Effect of elbow position on grip and key pinch strength. J Hand Surg Am 1985;10:694-7.
25. Su CY, Lin JH, Chien TH, Cheng KF, Sung YT. Grip strength in different positions of elbow and shoulder. Arch Phys Med Rehabil 1994;75:812-5.
26. De Smet L, Fabry G. Grip force reduction in patients with tennis elbow: influence of elbow position. J Hand Ther 1997;10:229-31.
27. Kaczor JJ, Ziolkowski W, Popinigis J, Tarnopolsky MA. Anaerobic and aerobic enzyme activities in human skeletal muscle from children and adults. Pediatr Res 2005;57:331-5.
28. Boisseau N, Delamarche P. Metabolic and hormonal responses to exercise in children and adolescents. Sports Med 2000;30:405-22.
29. Neu CM, Rauch F, Rittweger J, Manz F, Schoenau E. Influence of puberty on muscle develop-ment at the forearm. Am J Physiol Endocrinol Metab 2002;283:E103-7.
30. Lucki NC, Nicolay CW. Phenotypic plasticity and functional asymmetry in response to grip forces exerted by intercollegiate tennis players. Am J Hum Biol 2007;19:566-77.