*e-mail: [email protected]
1. Introduction
Magnesium alloy has a lot of unique advantages such as excellent speciic strength, high speciic modulus, superior damping capacity, high-thermal conductivity, and electromagnetic shielding performance etc., and magnesium alloy is one of the lightest structural metallic materials showing potential to replace aluminum and steel1-3. Magnesium alloy generally exhibits low ductility at room temperature due to the few slip systems in hexagonal close-packed lattice3. However, at the elevated temperatures, the workability of magnesium alloy increases with additional slip systems, namely, non-basal and (c + a) slip becomes available by heat activation4,5. Hence, industrial manufacturing is reliant on the excellent formability at elevated temperatures to produce magnesium alloy parts.
It is well known that the hot deformation behavior of magnesium alloy is sensitively dependent on deformation parameters involving strain, strain rate and temperature. The highly non-linear deformation behavior of magnesium alloy is always accompanied with work hardening (WH), dynamic recrystallization (DRX) and dynamic recovery (DRV). Accurate model of low stress becomes critical to improve numerical simulation accuracy in computer-aided engineering (CAE) software and optimize deformation parameter in related ields such as bulk forming6,7.Therefore, it is important to create a model to accurately model and predict the non-linear intrinsic relationships between low stress and the deformation parameters. In the past, many
studies have attempted to develop constitutive models of low behaviors of metals in hot deformation. So far there have been three representative constitutive models, i.e. analytical, phenomenological and empirical/ semiempirical ones8-13.
The physical-based analytical model involves the evolution of mobile dislocation density, and static and dynamic grain coarsening etc.14. The analytical models such as Fields-Backofen (FB) and Mechanical Threshold Stress (MTS) need clear and deep understanding of the evolution of microstructure, and then the models which reveal the evolution law of microstructures are incorporated into the analytical models15,16. Moreover, analytical models need a large number of experimental data from accurately controlled experiments and the construction of mathematical relations on intricate microscopic evolutions. Therefore, it has not been widely used in low stress prediction.
The phenomenological models were less strictly related to physical theories and employed extensively by many researchers with satisfactory precision in the modelling of hot deformation behavior. And the phenomenological models only need to calculate necessary material constants and develop multivariate nonlinear regression models based on the limited experimental results. Lately, the phenomenological models expressed by the hyperbolic laws in an Arrhenius-type equation and their modiied forms were used to predict the hot deformation behaviors of materials, such as Ti-6Al-4V[17], IMI834[18], and Ti60 etc.19. Slooff et al.20 designed a hyperbolic sine constitutive equation which takes into account strain to predict the low stress data in wrought magnesium alloy
Modelling the Hot Flow Behaviors of AZ80 Alloy by BP-ANN and
the Applications in Accuracy Improvement of Computations
Guo-Zheng Quana*, Zhi-hua Zhanga, Jia Pana, Yu-feng Xiaa
aState Key Laboratory of Mechanical Transmission, School of Material Science and Engineering,
Chongqing University – CQU, Chongqing 400044, China
Received: August 29, 2015; Revised: October 5, 2015
Hot compressions of as-cast AZ80 magnesium alloy in a wide temperature range of 523-673 K and strain rate range of 0.01-10 s–1 with a height reduction of 60% were conducted by a Gleeble-1500 thermo-mechanical test simulator. The hot low behaviors show highly non-linear intrinsic relationships with temperature, strain and strain rate. In order to model the complicated low behaviors, error back-propagation algorithm, a representative method to minimize the target error, was selected to train the artiicial neural network. A comparative study was made on the predictabilities of the improved Arrhenius-type and BP-ANN model by using two standard statistical parameters including correlation coeficient (R) and average absolute relative error (AARE). Comparison results show that the well-trained BP-ANN has higher prediction accuracy. Three highlight applications were presented. Firstly, the strain-stress data volume was expanded by BP-ANN predictions above experimental conditions. Secondly, the expanded data were applied in the simulations of isothermal compressions, and high simulation accuracy for the load-stroke curve was achieved. Thirdly, a three-dimensional (3D) interaction space of stress, strain, temperature and strain rate was constructed based on the intensive data, which supplies the stress data to arbitrary temperature, strain rate, and strain.
Mg-Al4-Zn1, obtaining more accurate prediction than the initial Arrhenius-type equation in which the effect of strain was not considered. Lin et al.21 and Quan et al.22 revised the strain-dependent hyperbolic sine constitutive models by incorporating the hot forming parameters (such as material constants n and a, and structure factor A, activation energy of deformation Q). Other kinds of phenomenological constitutive models include Khan-Huang-Liang (KHL), and Johnson-Cook (JC) etc., showing large differences of accuracy in different range of temperatures and strain rates16,23,24. However, the prediction accuracy of these phenomenological models are not high enough because the multivariate nonlinear regression models are dificult to accurately describe the highly non-linear deformation behavior. Another reason is that the phenomenological models lack physical backgrounds. And the phenomenological and empirical models need to be recalculated when new experimental data are added16,25.
Recently, the artiicial neural network (ANN) supplied a new method to predict low stress data by learning the non-linear relationships. The artiicial neural network (ANN) is an information processing system by imitating the behavior of biological neural systems, i.e. a data-driven black-box model13. The ANN model does not need to build intricate mathematical models. In addition, ANN model has eficient learning ability and accurate imitation, and a well-deined ANN model can achieve superior prediction precision13. Recently, because of the many advantages of ANN model, much attention has been paid to ANN model and their improved form in modelling hot deformation behaviors of several alloys26. Back propagation neural network model (BP-ANN model) is an improved neural network. The BP-ANN timely disposes training error, and reduces output error of the network to an acceptable level. When the actual output and the expected output are not the same, the BP-ANN enters into the stage of error back propagation. The errors in output layer modify the weights and biases of each layer, and pass inversely through the input layer and hidden layer27,28. N. Haghdadi et al.29 successfully designed an ANN to predict the low stress of A356 aluminum alloy. Mandal et al.30 applied an ANN to predict the deformation behavior of stainless steel type AISI 304L during hot torsion. Furthermore, the ANN models and BP-ANN models were applied to a variety of materials science, such as the prediction for processing map of hot working process31, the prediction for grain size in the primary á phase of TA15 titanium6, and the modelling of the composition-process-property relationships in austenitic stainless steels32. The above studies are complex and the mathematic relation among the variables are highly nonlinear, which show that the ANN models and BP-ANN models successfully predicted the complex nonlinear relationship, and the two models are gaining increasing attention.
In this study, a comparative study has been made on the performances of the improved Arrhenius-type constitutive model and BP-ANN in modelling the hot deformation behavior of AZ80 magnesium alloy. In order to evaluate the performances of the improved Arrhenius model and the BP-ANN model, several standard statistical parameters are applied, such as the correlation coeficient (R) and average absolute relative error (AARE). Comparisons of the results show that the well-trained BP-ANN has higher R-value and
lower AARE-value, which indicate that the BP-ANN has higher prediction accuracy than the improved Arrhenius-type constitutive model, and the results show that the BP-ANN can accurately predict the experimental data in a wide strain rate range and temperature range.
At present, most studies on inite element software mainly concentrate in mesh generation and post-processing, however, the low stress models in the FEM software have rarely been reported. In isothermal compression simulation, at a ixed strain rate, if the FEM software need to invoke low stress at unknown temperature, the system mainly calculates unknown low stress data by interpolation method based on stress-strain curves of a certain temperature range, and then the interpolations are invoked to continue the simulation. However, there is a large variance between low stress data at low and elevated temperatures, thereby, calculating unknown low stress by interpolation method will seriously affect the accuracy in different temperature ranges.
It is universally acknowledged that stress-strain data play important roles in many studies, for instance, inverse analysis of the stress-strain curve to determine work hardening (WH) and dynamic recovery (DRV)33, modelling for dynamic recrystallization evolution34, construction of processing maps35 and ductile fracture criteria36, etc. In the previous studies, Sun et al. and Sabokpa et al. only predicted low stress data of unknown temperature at the certain strain and strain rate6,12,30,37-39. Quan et al.13 developed discontinuously three-dimensional (3D) response plot of the experimental low stress data and predicted low stress data corresponding to strain and temperature at ixed strain rates. In this study, a novel continuous 3D prediction map of low stress was plotted, and it can represent corresponding low stress data at arbitrary temperature, strain and strain rate. In the novel continuous 3D prediction map of low stress, the predicted low stress data outside of experimental conditions articulate the similar intrinsic relationships with the experimental stress-strain curves. The full-scale database of low stress can improve the accuracy of inite element modelling and other related research ields such as processing maps and ductile fracture criteria etc., without resorting to expensive and time-consuming experiments.
2. Construction of BP-ANN Model for AZ80
Magnesium Alloy
2.1. Acquisition of experimental stress-strain data
and their characteristics
to assure a uniied temperature and decrease the material anisotropy, the samples were heated at a rate of 10 K/s and held at a certain temperature for 3 min. These specimens were compressed with a height reduction 60% at the temperatures of 523, 573, 623, and 673 K, and the strain rates of 0.01, 0.1, 1, and 10 s-1, and then the specimens were rapidly water quenched to retain the microstructures obtained at elevated
temperatures. In these compression tests, a computer equipped with an automatic data acquisition system was used to monitor the nominal stress and nominal strain continuously, and then these data were converted into true stress and true strain according to the following formulae: σT=σN
(
1−εN)
and εT= ln 1(
−εN)
, where εN is the nominal strain, σN thenominal stress, σT the true stress, and εT the true strain34.
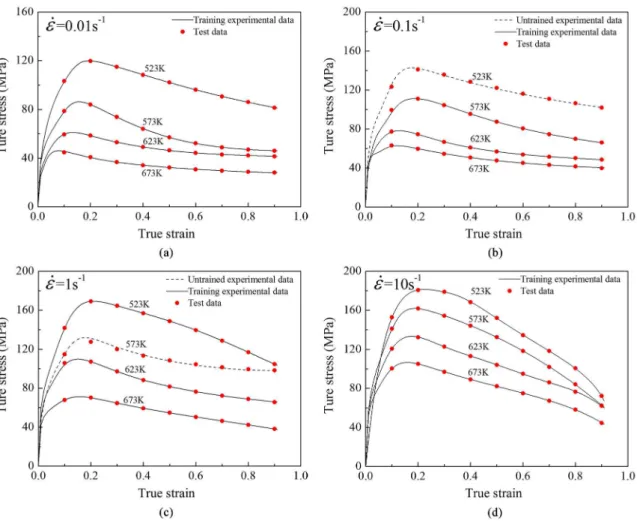
The true compressive stress-strain curves of AZ80 magnesium alloy at different temperatures and strain rates were illustrated in Figure 2. By comparing each other, it is summarized that, for a certain temperature, the low stress level increases with increasing strain rate; on the other hand, for a certain strain rate, the low stress level decreases markedly with increasing temperature. As for the stress evolution with strain, it exhibits three obvious stages. At the initial deformation stage where work hardening (WH) predominates, the low stress quickly increases to a critical value with increasing strain, meanwhile the stored energy in the grain boundaries grows quickly to DRX activation energy. If the critical driving force is achieved, the recrystallization nucleation starts to occur, which induces the softening of low stress. At the second stage, DRX is extending, and the growth rate of low stress is slowed down till a peak stress where DRX softening and dynamic recovery (DRV) are balanced with WH. At the third stage, DRX softening
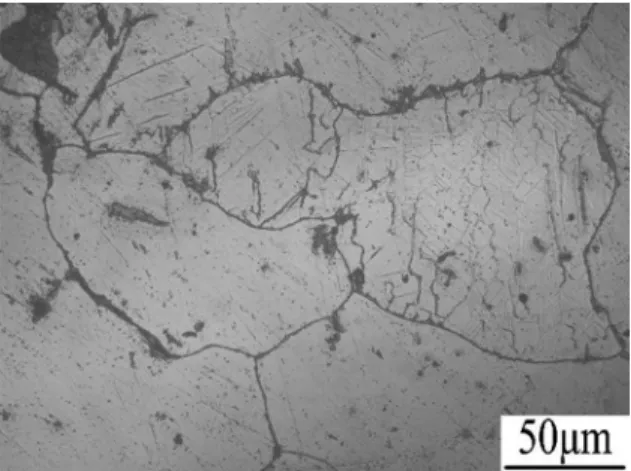
Figure 1. Microstructure of the as-received AZ80 magnesium alloy billet.
surpasses WH, and low stress decreases with increasing strain. The low stress evolution at the third stage shows two types as following: decreasing followed by a stable platform revealing a new dynamic balance between WH and DRX softening (573-673 K & 0.01 s–1, 623-673 K & 0.1 s–1, 573-673 K & 1 s–1), and the continuous decline with distinctly DRX softening (523 K & 0.01 s–1, 523-573 K & 0.1 s–1, 523 K & 1 s–1, 523-673 K & 10 s–1).
2.2. Construction process of BP-ANN model for
as-cast AZ80 magnesium alloy
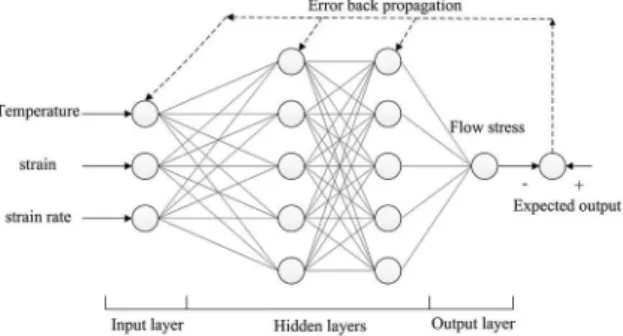
Error back-propagation algorithm is a representative method by adjusting the weights and biases to minimize the target error, which is selected to train the artiicial neural network, namely BP-ANN[19]. The BP-ANN is composed of input layer, middle layer (hidden layer) and output layer, and its structure diagram is shown as Figure 3. In this investigation, the input variables of the BP-ANN include strain (ε), strain rate (˙ε) and temperature (T), and the output variable aims to low stress (σ).
The information processing system includes the forward propagation process of information and the backward propagation of error. The neurons in input layer are responsible for receiving the input information from the outside world, and then the input information is transferred to the neurons in the intermediate layer which is responsible for information exchange. Based on different datasets, the middle layer can be set as a single hidden layer or multiple hidden layers. If there are deviations between the actual output and the expected output, the BP-ANN enters into the stage of error back propagation. The output layer timely modiies the weights and biases of each layer based on the error level to reduce the output error of the network till an acceptable level27,28. The forward propagation of information and the back-propagation of error constitute the training process of BP-ANN model, accompanying continuous adjustment of the weights and biases. This process will be stopped when the
output errors achieve an acceptable level, or the procedure arrives at a predetermined learning iteration.
The luctuant experimental data were itted to smooth stress-strain curves to minimize experimental error, and the smooth curves which show good regularity are helpful to improve the training precision. The sixteen stress-strain curves were divided into two sets, i.e., training dataset and independent test dataset, and this clariication was shown in Table 1. In this study, a total of 1180 input-output pairs were selected from the itted stress-strain curves to train and test the BP-ANN model. As shown in Table 1, among the 1180 nput-output pairs, 88.8% (1036) of them were used to train the BP-ANN model at the strain range of 0.09-0.91 with an interval of 0.01 which exclude the test data and the two untrained experimental stress-strain curves, and the remained 11.2% (144) low stress points at the strain range of 0.1-0.9 with an interval of 0.1 were not used for training but for testing the predictability of the developed BP-ANN model.
The experimental data were measured in different units involving temperature, strain, strain rate and stress, therefore, there were great discrepancies between different kinds of data. If the data in different sizes are simultaneously inputted to the input layer of the BP-ANN, the smaller data have little effect on the network, and such differences will decrease the convergence speed and precision in the network. Therefore, the input datasets and output datasets measured in different units should be normalized into the dimensionless units that in a small range to train the BP-ANN model, and then the convergence speed and accuracy of the BP-ANN model would be improved13. The input variables (temperature, strain and strain rate) and output variable (low stress) were normalized by the improved relation Equation 113,40. In order to narrow the range of the normalized values, a serious of empirical coeficients were adopted in Equation 113,40.
The input variables (temperature, strain and strain rate) and output variable (low stress) were normalized by the improved relation Equation 1. In order to narrow the range of the normalized values, a serious of empirical coeficients were adopted in Equation 1.
min
max min
0.95 0.05 0.25 *
.05 0.95
n
x x
x
1 x x
= +
−
(1)
where xn is the normalized value of x; x is the experimental data; xmax and xmin are the maximum and minimum value of x respectively.
Hornik et al.41 found that an ANN with single hidden layer can map many functions of practical problems, and was extensively used. Without limiting the neuron number in hidden layer, the BP-ANN model with two hidden layers or multiple hidden layers can achieve higher training Figure 3. Structure diagram of the BP-ANN model.
Table 1. The clariication of training dataset and test dataset.
Temperature (K) Strain rate/s
–1
0.01 0.1 1 10
523 Training Test Training Training
573 Training Training Test Training
623 Training Training Training Training
accuracy. For a particular dataset, the appropriate transfer function, training function, and appropriate neuron number etc. are often designed by a trail-and-error procedure. It is noteworthy that the neurons in the hidden layer cannot be too less, otherwise the trained network might not have suficient ability to learn the process. However, too more neurons in the hidden layer will lead to misconvergence or the training data may be over itted, as illustrated in reference42. Generally, the neuron number in each hidden layer should be increased with increasing training sample number13,42. And an empirical formula for neuron number of each hidden layer is expressed as Equation 2.
( i o)
k= m+m +b (2)
where k is the number of neuron node in hidden layers; mi is
the number of neuron node in input layer; mo is the number
of neuron node in output layer; b is an integer in the range of 2 to 28. Here, mi=3 and mo=1. In this investigation, the
selected transfer functions of the hidden layers and output layer are ‘tan sigmoid’ and ‘pure linear’ respectively, and the training function is ‘trainbr’.
In order to select the neuron number for each hidden layer and evaluate the performance of the BP-ANN model, an evaluator, mean square error (MSE) between experimental stress data and predicted stress data were introduced as Equation 343,44.
2 1 1
( )
N
i i
i
MSE E P
N =
= ∑ − (3)
where E is the sample of experimental value; N is the number of stress-strain samples of test dataset; P is the sample of the predicted value by BP-ANN.
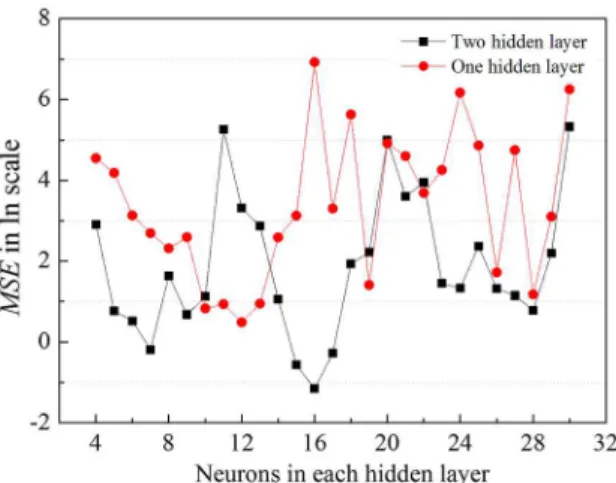
Here, the hidden neurons were scheduled in the range of 4-30 with an interval of 1. After calculation, the MSE-values of the different models are in the range of 0 to 1200. If the scale of MSE-value is too large, the small differences between similar data are not obvious in a igure. The ln MSE are in the range of –2 to 8 through a logarithmic transformation, and the small differences and variation trend can be visually displayed in a igure, and the corresponding ln MSE are shown in Figure 4. The results show that the minimum MSE-value of 0.3158 (ln MSE= –1.1526) is achieved when the neurons in two hidden layers meet 16 and 16 with the most appropriate b-value of 14. The rest of MSE-values are higher than 0.3158 and luctuated substantially, which show the instable convergence. In double hidden layers, each layer can contain various numbers of neurons and there are many combinations of neurons. In this model, the typically double hidden layers with the same neurons were simulated, and the prediction accuracy is outstanding to identical with expectation. Because the expected accuracy has been achieved, all the different combinations were not simulated.
A statistical index, the correlation coeficient (R) as Equation 443 was introduced to evaluate the degree of the close correlation between the experimental stress data and predicted stress data. An R-value near 1 indicates a well correlation between the experimental stress data and predicted stress data.
2 2
1 1
)( )
) ( )
N
i i
i
N N
i i
i i
(E E P P R
(E E P P
=
= =
− −
=
− −
∑
∑ ∑
(4)
where E is the sample of experimental value; P is the sample of the predicted value by BP-ANN; E and P are the mean value for E and P respectively; N is the number of stress-strain samples.
As shown in Figure 5, the R-value for the training samples and itted value of BP-ANN model is 0.9999. There are two singular points. The deformation conditions of the two singular points are on the edge of strain range corresponding to 523 K & 1 s–1 & 0.09 (ε) and 573 K & 10 s–1 & 0.09 (ε), which are prone to lack of learning ability of the BP-ANN. And the few singular points do not affect accuracy of the whole model.
3. Comparison of BP-ANN Model with
Improved Arrhenius-type Constitutive
Model
3.1. Existing improved Arrhenius-type
constitutive model for AZ80 alloy
The general Arrhenius-type constitutive relation was expressed by Equation 5 in which the effect of strain was not considered. However, strain shows a signiicant effect on low behaviors of magnesium alloy, thus the compensation
Figure 4. The mean square errors of single hidden layer and two hidden layers.
Figure 5. Correlation between experimental low stress data and
of strain should be considered. Lin et al.45,46 presented a modiied hyperbolic sine constitutive equation, in which the hot forming parameters (such as Q, n, a, and A) as functions of strain were incorporated in the improved the Arrhenius-type constitutive equation. Quan et al.22 calculated a series of coeficients (Q, n, A, and a) shown in Table 2 for the improved Arrhenius-type constitutive model of as-cast AZ80 alloy.
}
1/ 7.9064
2/ 7.9064 1/ 2 1
ln ( ) [( ) 1] 0.0129
Z Z
A A
σ = + +
(5)
exp[ / ]
Z=ε. Q RT (6)
where σ is flow stress (MPa) for a given strain; Q is the activation energy of hot deformation (kJ·mol–1); R is the universal gas constant (8.31 J·mol–1·K–1); T is temperature (K); ˙ε is strain rate (s–1); A is a structure factor; Z is Zener-Hollomon parameter considering the effects of temperature and strain rate47.
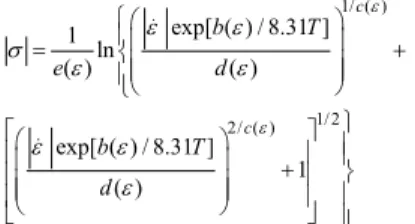
1/ ( )
1/ 2 2/ ( ) .
exp[ ( ) / 8.31 ] 1
ln
( ) ( )
exp[ ( ) / 8.31 ] 1 ( ) c . c b T e d b T d ε ε ε ε σ ε ε ε ε ε = + + (7)
where d(ε), e(ε), c(ε), and b(ε) are polynomial functions of strain for A, α, n, and Q respectively, as shown in Equation 8.
ln
2 3 4 5 6 7
0 1 2 3 4 5 6 7
2 3 4 5 6 7
0 1 2 3 4 5 6 7
2 3 4 5 6 7
0 1 2 3 4 5 6 7
2 3 4 5 6 7
0 1 2 3 4 5 6 7
Q B B B B B B B B
n C C C C C C C C
A D D D D D D D D
E E E E E E E E
ε ε ε ε ε ε ε
ε ε ε ε ε ε ε
ε ε ε ε ε ε ε
α ε ε ε ε ε ε ε
= + + + + + + +
= + + + + + + +
= + + + + + + +
= + + + + + + +
(8)
3.2. Comparison of the performance of
the developed BP-ANN and improved
Arrhenius-type models
A popular evaluator, relative error (δ) was introduced to evaluate the performance of the predicted work, as expressed by Equation 9.
( )
i i 100%i
E P % =
E
δ − × (9)
where E is the sample of experimental data; P is the sample of predicted data; N is the number of stress-strain samples of test dataset.
Comparisons of the stress data predicted by the improved Arrhenius-type constitutive model and BP-ANN model are shown in Table 3. From Table 3, it is found that the δ-values obtained from the improved Arrhenius-type constitutive model vary from –7.32% to 2.23%, while the δ-values are in the range from –2.88% to 0.80% for the BP-ANN model. Mean value (µ) is the average value of all the relative errors of test data, and N is the number of stress-strain samples of test dataset. The formula for µ-value is expressed by Equation 1030,43,47. Standard deviation (w) relects discrete degree of individual in the dataset. A large w represents a large difference in most of individual values and average value of the dataset, while a small w indicates most of values are close to the average value. And the formula for standard deviation is expressed by Equation 1113,43,48.
1 1 N i i N µ δ =
= ∑ (10)
2 1 1 ( ) ( 1) N i i w
N = δ µ
= −
− ∑ (11)
where δ is the sample of relative percentage error; μ is the mean value of δ-values; N is the number of stress-strain samples of test dataset.
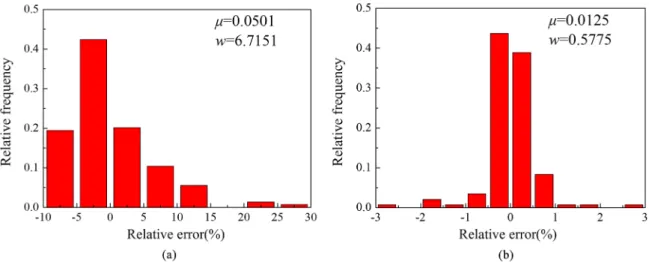
As shown in Figure 6, it can be summarized that the BP-ANN can track the stress-strain curves in a wide temperature range, strain range, and strain rate range. Figure 7a, b show the distribution of δ-values corresponding to the improved Arrhenius-type constitutive model and BP-ANN respectively. The height of each column diagram represents the relative frequency of each δ-level. The μ-value and w-value of the BP-ANN are 0.0125 and 0.5775 respectively, whereas the μ-value and w-value of the improved Arrhenius-type constitutive model are 0.0501 and 6.7151 respectively. In addition, it is found that the δ-values obtained from the improved Arrhenius-type constitutive model vary from –10% to 30%, while the δ-values obtained from the BP-ANN vary from-3% to 3%. Smaller μ-value and w-value of the BP-ANN show that the distribution of δ-values are more centralized, i.e. more predicted stress values are close to the experimental stress values.
Table 2. Polynomial itting results of Q, n, ln A and α for AZ80 alloy.
Q n ln A α
B0 127.62 C0 5.89 D0 –7.42 E0 0.07
B1 –280.90 C1 41.83 D1 593.38 E1 –1.22
B2 8664.94 C2 –505.22 D2 –4117.87 E2 10.73
B3 –53118.60 C3 2644.85 D3 16415.46 E3 –48.35
B4 156794.60 C4 –7163.31 D4 –38156.60 E4 122.08
B5 –252838 C5 10394.41 D5 49808.87 E5 –173.99
B6 213012.90 C6 –7637.83 D6 –33463.50 E6 130.58
Table 3. Comparisons between experimental and predicted low stress data at 523 K & 0.1 s–1 and 573 K & 1 s–1.
Strain
rate/s-1 Temperature /K Strain Flow stress (MPa) Relative error /%
Experimental BP-ANN Equation
prediction BP-ANN Equation
0.1 523 0.1 125.6316 123.3342 117.5177 –1.86 –6.29
0.2 142.2319 141.1772 137.4617 –0.75 –3.39
0.3 135.0259 135.7151 134.0651 0.51 –1.17
0.4 127.6225 128.4479 126.7222 0.64 –0.75
0.5 121.1925 122.119 116.4642 0.76 –3.94
0.6 115.579 116.1569 108.5135 0.50 –5.67
0.7 110.6125 110.8962 103.0283 0.26 –7.32
0.8 106.1707 106.5419 99.23393 0.35 –6.41
0.9 102.1647 101.9143 96.09139 –0.25 –6.27
1 573 0.1 115.3297 114.8605 117.4507 –0.41 1.91
0.2 131.1884 127.5171 134.1385 –2.88 2.23
0.3 122.078 120.1074 121.6997 –1.64 –0.21
0.4 114.002 113.3566 111.9394 –0.57 –1.69
0.5 108.048 108.5202 107.6426 0.44 –0.50
0.6 103.6945 104.5339 99.04359 0.80 –4.35
0.7 100.6389 101.4465 96.39865 0.80 –4.30
0.8 98.77956 99.45059 94.45956 0.67 –4.46
0.9 98.1938 98.31215 93.77498 0.12 –4.37
In order to further evaluate the predictive ability of the improved Arrhenius-type constitutive model and BP-ANN model, another evaluation index, average absolute relative error (AARE) expressed by Equation 12 is used to evaluate the predictive ability together with the correlation coeficient (R). The AARE has been used as an unbiased statistical parameter to further evaluate the predictability of the two models. It is calculated through relative absolute error term by term.
1 1 N
i i
i i
E P AARE
N = E
−
= ∑ (12)
where P is the sample of predicted value; E is the sample of experimental value; N is the number of stress-strain samples of test dataset.
Figure 8a, b show the correlation between the experimental low stress data and predicted low stress data of the improved Arrhenius-type constitutive model and BP-ANN model respectively. The R-value and AARE-value of the BP-ANN are 0.9999 and 0.32% respectively, while the R-value and AARE-value of the improved Arrhenius-type constitutive
model are 0.9901 and 4.92% respectively. Zeng et al. developed ANN models for as-cast titanium alloy, and the best correlation coeficient (R) and average absolute relative error (AARE) were 0. 999 and 2.41% respectively19,37. And all of stress-strain curves participated in the training process in their study, which increase the prediction accuracy of the ANN models. Nevertheless, in this investigation, two stress-strain curves were reserved to evaluate the predictive ability of BP-ANN, which did not participate in the training procedure. Less input variables reduce the dificulties of building an accurate ANN model. Quan et al.13 also developed an ANN model for as-cast Ti-6Al-2Zr-1Mo-1V alloy, and the ANN model achieved higher R-value and smaller AARE-value, however, in their study, the input variables just include deformation temperature (T) and strain (ε). In this study, temperature (T), strain (ε), and strain rate (˙ε) were trained in the BP-ANN model, and two stress-strain curves were reserved to evaluate the prediction accuracy, which increase the dificulties to construct the high accuracy model. O. Sabokpa et al.38 developed an ANN in predicting the hot compressive behavior of cast AZ81 magnesium alloy, and
Figure 7. Distribution of relative percentage errors of all test data corresponding to (a) improved Arrhenius-type constitutive model and (b) BP-ANN model.
the R-value and AARE-value of the ANN are 0.998 and 3.5% respectively. Y. J. Qin et al.49 established a BP-ANN with single hidden layer to investigate the low behavior of ZK60 alloy during hot compression, and the R-value and AARE-value of the predicted data of the BP-ANN are 0.9819 and 3.91% respectively. A smaller AARE-value of 0.32% and a greater R-value of 0.9999 were achieved in this study.
It can be summarized that the BP-ANN can track the stress-strain curves in a wide temperature range, strain range, and strain rate range, and it has higher prediction accuracy than the improved Arrhenius-type constitutive model. On the contrary, the improved Arrhenius-type constitutive model is dificult to describe the low behaviors, for the reason that the mathematical regression method is dificult to accurately track the highly non-linear deformation behavior. Another reason is that the phenomenological models such as Arrhenius-type constitutive model lack of physical backgrounds involving the complex microstructural evolution. What is worse, the Arrhenius-type constitutive model needs to be recalculated when new experimental values are involved. The advantages of Arrhenius-type equation are the equation does not need substantial physical theories to understand intricate microscopic evolutions in plastic deformation, and only some material constants are needed which can be
obtained by mathematical regression method based on the experimental results. Thereby, in the situation that does not demand high precision, using the Arrhenius-type equation is more convenient. However, the prediction accuracy of Arrhenius-type equation in a wide range of temperatures and strain rates can be different and not outstanding, so the BP-ANN shows great advantage when superior accuracy is required. And the BP-ANN does not need to build the intricate mathematical models and physical interpretations. The BP-ANN only needs representative samples from the research projects, and then optimizes the training parameters and structure of hidden layers.
4. Applications of BP-ANN in Material
Computations
4.1. Stress-strain data volume expansion by
BP-ANN
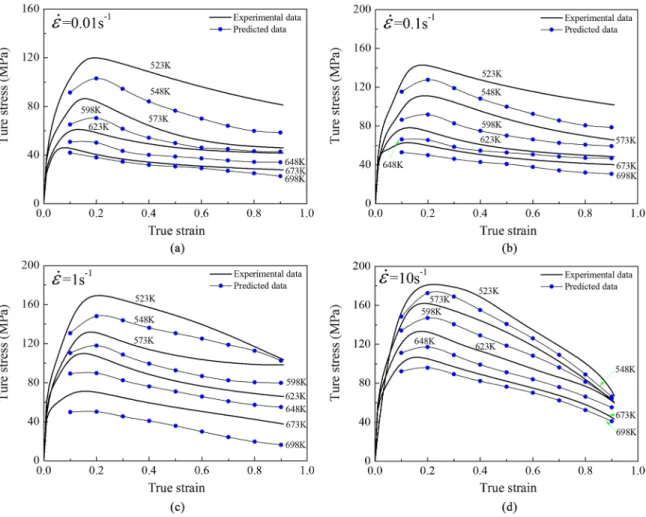
The low stress data at temperatures of 548 K, 598 K, 648 K, and 698 K under strain rates of 0.01 s–1, 0.1 s–1, 1 s–1 and 10 s–1 were predicted for as-cast AZ80 magnesium alloy by the well-trained BP-ANN model, as shown in Figure 9. The strain-stress data volume expansion contributes to the accuracy improvement in the following aspects.
4.2. Accuracy improvement in FE simulations
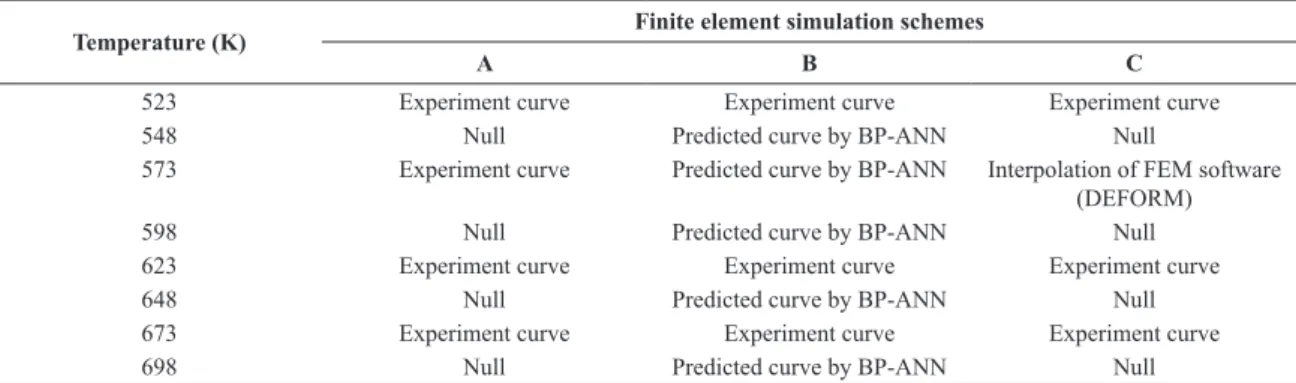
In this section, simulations were simulated in the inite element method (FEM) analysis software DEFORM-2D to analyze the inluence of stress-strain curves on simulation results. The billet size of the simulation was the same as the experimental specimen, and one half of the specimen was chose in inite element calculation due to geometric symmetry. The bottom die was set to be ixed. In the previous experiments, graphite lubricants were applied to coat the top and bottom surfaces of specimens in compression tests, thereby, in DEFORM-2D, the friction type between the surfaces of specimens and dies was set as shear type. The heat exchange and heat radiation among specimens, dies and surrounding environments were ignored, so as to simulate the actual isothermal compression test.In the three different simulation schemes shown in Table 4, stress-strain curves were variables. All of the initial conditions were identical except for stress-strain curves. Scheme-A has no interpolation intervals. As mentioned in previous chapter, the stress-strain curves at the temperatures of 548 K, 573 K, 598 K, 648 K, and 698 K and strain rate of 1 s–1 were predicted by BP-ANN model, and then these stress-strain curves were applied to scheme-B. However, scheme-C only adopted experimental stress-strain curves at temperatures of 523 K, 623 K and 673 K and strain rate of 1 s–1. The stress-strain curves at the temperature of 573 K and strain rate of 1 s–1 were interpolated by FEM software. The interpolation interval was 100 K for scheme-C.
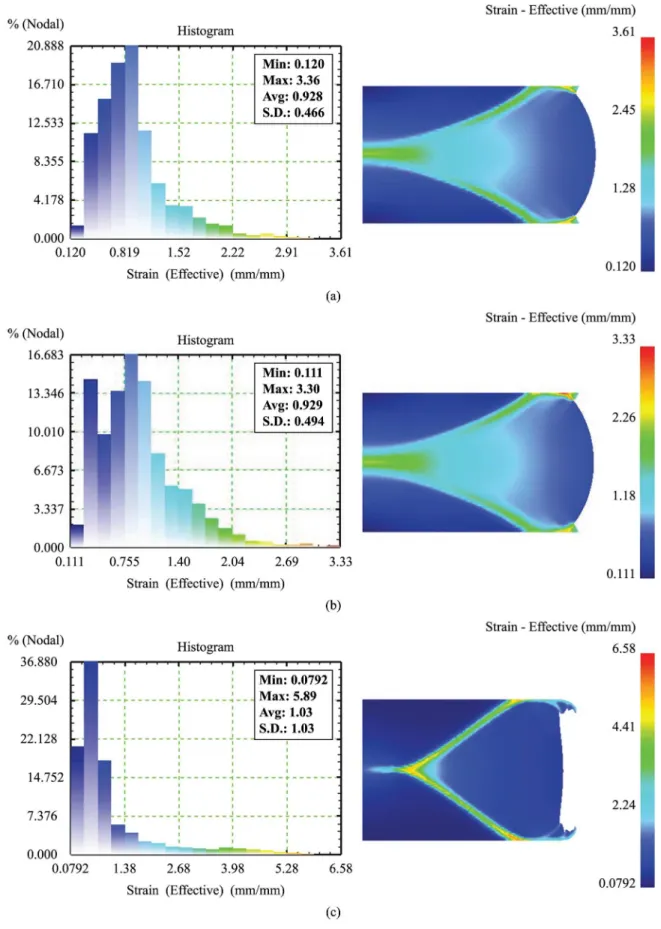
Figure 10a shows the distribution of effective strain for scheme-A. Figure 10b shows the distribution of effective strain for scheme-B, which can also be roughly divided into three regions, and the average strain is 0.929 approaching to scheme-A. Figure 10c depicts the distribution of effective strain for scheme-C, which is similarly divided into three regions, and the average strain is 1.03 showing small difference to scheme-A, however, there are great differences between the distributions of effective strain values. In addition, the shape of outer perimeter of the billet was not the typical drum-type, for the reason of the failing interpolation in wide interpolation interval. Furthermore, Figure 11 shows the load curves of the top die responding to strokes of three different schemes. By comparing these simulated results, it can be found that the top die loads of scheme-B and scheme-A are extremely close. The load trends of scheme-C and scheme-A before
4 mm are roughly uniform, afterwards, there are huge load differences between them. The relative errors of the top die load value were obtained in the range of –6.04-4.44% between scheme-A and scheme-B, and it were obtained in the range of –10.42-29.94% between scheme-A and scheme-C. It can be summarized that the large span of interpolation will result in unfaithful simulation results. Furthermore, the deformation behavior under different temperature range of material is signiicantly non-linear, therefore, calculating low stress by interpolation method is extremely inaccurate in FEM software. For example, accurate control of the forming process requires accurate material data. The large deviations of the preliminary simulation results will severely impact on the computation accuracy, generating huge economic and human capital losses. It can be summarized that the BP-ANN can predict the low stress and narrow the interpolation interval to improve the simulation precision.
4.3. Construction of 3D mapping relationships of
low behavior parameters
Sun et al., O. Sabokpa et al., Ji et al. and Zhu et al. only predicted stress values of unknown temperatures at certain strains and strain rates6,12,30,37-39. Quan et al.13 just developed discontinuous 3D response plot of experimental stress data and predicted stress data corresponding to strain and temperature under ixed strain rates. In this investigation, the low stress data at supposed temperatures of 548 K, 598 K, 648 K, and 698 K under strain rates of 0.01 s-1, 0.1 s-1, 1 s-1 and 10 s-1 were predicted for as-cast AZ80 magnesium alloy by the well-trained BP-ANN model. Based on these existing experimental stress-strain data and predicted stress-strain data, an interpolation method was employed to densely insert stress-strain data into the existing data, and the 3D continuous relationships among temperature, strain, strain rate and stress were subsequently established as Figure 12 by a surface itting process in Matlab. And the novel 3D prediction map of low stress has not been reported before. Undoubtedly, with the help of BP-ANN model, more stress-strain data with smaller interpolation intervals can be predicted into the 3D prediction map of low stress to improve accuracy. Compared with the typical two dimensional true stress-strain curves, the novel 3D prediction maps of low stress have advantages of continuation and can represent corresponding low stress value at arbitrary temperature,
Table 4. These three inite element simulation schemes at the temperatures of 573 K and the strain rate of 1 s–1.
Temperature (K) Finite element simulation schemes
A B C
523 Experiment curve Experiment curve Experiment curve
548 Null Predicted curve by BP-ANN Null
573 Experiment curve Predicted curve by BP-ANN Interpolation of FEM software
(DEFORM)
598 Null Predicted curve by BP-ANN Null
623 Experiment curve Experiment curve Experiment curve
648 Null Predicted curve by BP-ANN Null
673 Experiment curve Experiment curve Experiment curve
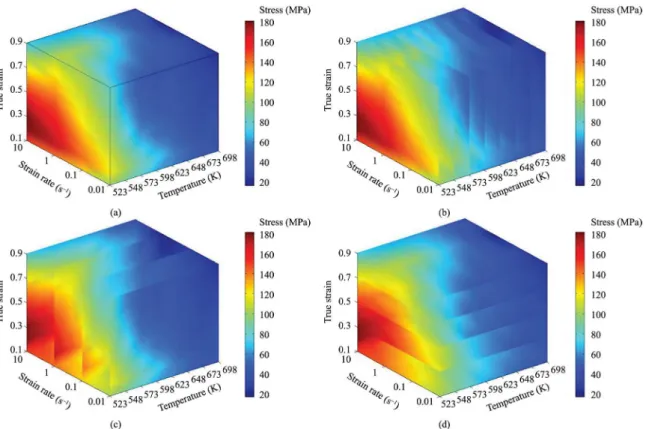
strain rate and strain. In Figure 12, the X-axis, Y-axis and Z-axis represent deformation temperature, strain rate and strain, respectively, and the low stress values are measured with different colors. Figure 12b-d show the slice maps of Figure 12a in three different directions. Figure 12b expresses the corresponding low stress to arbitrary strain rate and strain at ixed temperatures. It can be observed that the low stress level increases with increasing strain rate at a certain strain, which cannot be fully displayed in the typical two dimensional true stress-strain curves. Figure 12c indicates
the low stress corresponding to arbitrary temperature and strain at ixed strain rates. It can be observed that the low stress level decreases with the increase of temperature at a certain strain. Figure 12d indicates the corresponding low stress to arbitrary temperature and strain rate at ixed strains.
According to the above analysis, the predicted stress data outside of experimental conditions show similar rule with the known experimental stress-strain curves. A large amount of stress-strain data outside of experimental conditions predicted by the accurate BP-ANN can enrich the low stress data and narrow the interpolation intervals. With the help of the procedure of the 3D prediction maps of low stress, the continuous space can be converted into a full-scale database which can represent corresponding low stress data at arbitrary temperature, strain rate and strain.
The BP-ANN shows potential to integrate into FEM by using programming language. With the help of the combination of BP-ANN with FEM, it is possible to achieve high precision of simulations without resorting to expensive and time-consuming experiments. With the rapid development of FEM software and deep study of BP-ANN, it is achievable to build a relatively full-scale and accurate database automatically based on known stress-strain data, which contribute greatly to the simulation accuracy and the related studies. For example, the full-scale and accurate database can improve the processing maps, ductile fracture criteria etc.
Figure 12. The (a) three-dimensional prediction map of low stress and the cross proiles at different (b) temperatures, (c) strain rates and (d) strains.
5. Conclusions
A well-trained BP-ANN was constructed to predict the hot deformation behavior of as-cast AZ80 magnesium alloy based on the experimental stress-strain curves from hot compression tests at the temperatures ranging from 523 to 673 K, and the strain rates ranging from 0.01 to 10 s–1. And a continuously 3D prediction map of low stress was plotted based on the BP-ANN model. Following main conclusions are drawn from the current study:
(1) The hot deformation behavior of magnesium alloy shows a highly non-linear intrinsic relationship with temperature, strain and strain rate, accompanying work hardening (WH), dynamic recrystallization (DRX) and dynamic recovery (DRV).
(2) The correlation coeficients (R-values) from the improved Arrhenius-type constitutive model and BP-ANN are 0.9901 and 0.9999 respectively, and the average absolute relative errors (AARE-values) from the two models are 4.92% and 0.32% respectively. The high level of R-value and smaller AARE-value of the BP-ANN show that more predicted low stress data were extremely close to the experimental low stress data, which indicated that the BP-ANN has a better prediction precision
in modelling the hot deformation behavior of as-cast AZ80 magnesium alloy.
(3) The low stress data under different temperature ranges of material are significantly different, thereby, calculating low stress data by interpolation method in FEM software will result in extremely inaccurate simulation results. And the well-trained BP-ANN can directly predict low stress and narrow the interpolation interval.
(4) It is universally acknowledged that stress-strain data play critical roles in many studies such as the construction of processing maps and ductile fracture criteria. Therefore, the continuously full-scale database of low stress can represent corresponding low stress data at arbitrary temperature, strain rate and strain, which can contribute greatly to the simulation accuracy and optimization of the processing maps and ductile fracture criteria etc.
Acknowledgements
This work was supported by National Natural Science Foundation of China (51305469). The corresponding author was appreciated for Chongqing Higher School Youth-Backbone Teacher Support Program.
References
1. Barnett MR. Influence of deformation conditions and texture on the high temperature flow stress of magnesium AZ31. Journal of Light Metals. 2001; 1(3):167-177. http://dx.doi.org/10.1016/
S1471-5317(01)00010-4.
2. Liu J, Cui ZS and Li CX. Modelling of flow stress characterizing
dynamic recrystallization for magnesium alloy AZ31B.
Computational Materials Science. 2008; 41(3):375-382. http://
dx.doi.org/10.1016/j.commatsci.2007.04.024.
3. Zhou HT, Lia QB, Zhaoa ZK, Liua ZC, Wena SF and Wang QD.
Hot workability characteristics of magnesium alloy AZ80-A study using processing map. Materials Science and Engineering A. 2010; 527(7-8):2022-2026. http://dx.doi.org/10.1016/j.
msea.2009.12.009
4. Al-Samman T and Gottstein G. Dynamic recrystallization during high temperature deformation of magnesium. Materials Science and Engineering A. 2008; 490(1-2):411-420. http:// dx.doi.org/10.1016/j.msea.2008.02.004.
5. Al-Samman T and Gottstein G. Room temperature formability of a magnesium AZ31 alloy: examining the role of texture on the deformation mechanisms. Materials Science and Engineering A. 2008; 488(1-2):406-414. http://dx.doi.org/10.1016/j.
msea.2007.11.056.
6. Sun Z, Yang H and Tang Z. Microstructural evolution model of
TA15 titanium alloy based on BP neural network method and application in isothermal deformation. Computational Materials
Science. 2010; 50(2):308-318. http://dx.doi.org/10.1016/j. commatsci.2010.08.020.
7. Serajzadeh S. Prediction of thermo-mechanical behavior
during hot upsetting using neural networks. Materials Science and Engineering A. 2008; 472(1-2):140-147. http://dx.doi.
org/10.1016/j.msea.2007.03.037.
8. Luo J, Li M, Li X and Shi Y. Constitutive model for high
temperature deformation of titanium alloys using internal state variables. Mechanics of Materials. 2010; 42(2):157-165. http:// dx.doi.org/10.1016/j.mechmat.2009.10.004.
9. Lin YC, Li Q-F, Xia Y-C and Li L-T. A phenomenological
constitutive model for high temperature flow stress prediction of Al-Cu-Mg alloy. Materials Science and Engineering A. 2012; 534:654-662. http://dx.doi.org/10.1016/j.msea.2011.12.023.
10. Li HY, Hu J-D, Wei D-D, Wang X-F and Li Y-H. Artificial
neural network and constitutive equations to predict the hot deformation behavior of modified 2.25Cr-1Mo steel. Materials & Design. 2012; 42:192-197. http://dx.doi.org/10.1016/j. matdes.2012.05.056.
11. Ou L, Nie Y and Zheng Z. Strain compensation of the constitutive
equation for high temperature flow stress of a Al-Cu-Li alloy.
Journal of Materials Engineering and Performance. 2013; 23(1):25-30. http://dx.doi.org/10.1007/s11665-013-0747-0.
12. Ji G, Li F, Li Q, Li H and Li Z. A comparative study on
Arrhenius-type constitutive model and artificial neural network model to predict high-temperature deformation behaviour in Aermet100 steel. Materials Science and Engineering A. 2011;
528(13-14):4774-4782. http://dx.doi.org/10.1016/j.msea.2011.03.017.
13. Quan GZ, Lv W, Mao Y, Zhang Y and Zhou J. Prediction
of flow stress in a wide temperature range involving phase transformation for as-cast Ti-6Al-2Zr-1Mo-1V alloy by artificial neural network. Materials & Design. 2013; 50:51-61. http:// dx.doi.org/10.1016/j.matdes.2013.02.033.
14. Fan XG, Yang H and Gao PF. Prediction of constitutive behavior
and microstructure evolution in hot deformation of TA15 titanium alloy. Materials & Design. 2013; 51:34-42. http:// dx.doi.org/10.1016/j.matdes.2013.03.103.
Mechanics of Materials. 2005; 37(2-3):355-378. http://dx.doi. org/10.1016/j.mechmat.2004.02.003.
16. Kotkunde N, Deole AD, Gupta AK and Singh SK. Comparative
study of constitutive modeling for Ti-6Al-4V alloy at low strain rates and elevated temperatures. Materials & Design. 2014; 55:999-1005. http://dx.doi.org/10.1016/j.matdes.2013.10.089.
17. Xiao J, Li DS, Li XQ and Deng TS. Constitutive modeling
and microstructure change of Ti-6Al-4V during the hot tensile deformation. Journal of Alloys and Compounds. 2012; 541:346-352. http://dx.doi.org/10.1016/j.jallcom.2012.07.048.
18. Balasundar I, Raghu T and Kashyap BP. Modeling the hot working behavior of near-α titanium alloy IMI 834. Progress in Natural Science: Materials International. 2013;
23(6):598-607. http://dx.doi.org/10.1016/j.pnsc.2013.11.004.
19. Peng W, Zeng W, Wang Q and Yu H. Comparative study on
constitutive relationship of as-cast Ti60 titanium alloy during hot deformation based on Arrhenius-type and artificial neural network models. Materials & Design. 2013; 51:95-104. http:// dx.doi.org/10.1016/j.matdes.2013.04.009.
20. Slooff FA, Zhou J, Duszczyk J and Katgerman L. Constitutive
analysis of wrought magnesium alloy Mg-Al4-Zn1. Scripta
Materialia. 2007; 57(8):759-762. http://dx.doi.org/10.1016/j.
scriptamat.2007.06.023.
21. Lin YC, Chen M-S and Zhong J. Prediction of 42CrMo steel
flow stress at high temperature and strain rate. Mechanics Research Communications. 2008; 35(3):142-150. http://dx.doi.
org/10.1016/j.mechrescom.2007.10.002.
22. Quan GZ, Shi Y, Yu CT and Zhou J. The improved arrhenius
model with variable parameters of flow behavior characterizing for the as-cast AZ80 magnesium alloy. Materials Research.
2013; 16(4):785-791. http://dx.doi.org/10.1590/s1516-14392013005000070.
23. Khan AS, Kazmi R, Farrokh B and Zupan M. Effect of oxygen
content and microstructure on the thermo-mechanical response of three Ti-6Al-4V alloys: Experiments and modeling over a wide range of strain-rates and temperatures. International
Journal of Plasticity. 2007; 23(7):1105-1125. http://dx.doi.
org/10.1016/j.ijplas.2006.10.007.
24. Khan AS, Sung Suh Y and Kazmi R. Quasi-static and dynamic
loading responses and constitutive modeling of titanium alloys.
International Journal of Plasticity. 2004; 20(12):2233-2248. http://dx.doi.org/10.1016/j.ijplas.2003.06.005.
25. Liu J, Zeng W, Lai Y and Jia Z. Constitutive model of Ti17
titanium alloy with lamellar-type initial microstructure during hot deformation based on orthogonal analysis. Materials Science and Engineering A. 2014; 597(0):387-394. http://
dx.doi.org/10.1016/j.msea.2013.12.076.
26. Serajzadeh S. Prediction of temperature distribution and required energy in hot forging process by coupling neural networks and finite element analysis. Materials Letters. 2007;
61(14-15):3296-3300. http://dx.doi.org/10.1016/j.matlet.2006.11.056.
27. Lucon PA and Donovan RP. An artificial neural network approach
to multiphase continua constitutive modeling. Composites.
Part B, Engineering. 2007; 38(7-8):817-823. http://dx.doi. org/10.1016/j.compositesb.2006.12.008.
28. Zhao J, Ding H, Zhao W, Huang M, Wei D and Jiang Z.
Modelling of the hot deformation behaviour of a titanium alloy using constitutive equations and artificial neural network.
Computational Materials Science. 2014; 92:47-56. http://dx.doi. org/10.1016/j.commatsci.2014.05.040.
29. Haghdadi N, Zarei-Hanzaki A, Khalesian AR and Abedi HR.
Artificial neural network modeling to predict the hot deformation behavior of an A356 aluminum alloy. Materials & Design. 2013; 49:386-391. http://dx.doi.org/10.1016/j.matdes.2012.12.082.
30. Mandal S, Sivaprasad PV, Venugopal S and Murthy KPN.
Artificial neural network modeling to evaluate and predict the deformation behavior of stainless steel type AISI 304L during hot torsion. Applied Soft Computing. 2009; 9(1):237-244. http:// dx.doi.org/10.1016/j.asoc.2008.03.016.
31. Robi PS and Dixit US. Application of neural networks in generating processing map for hot working. Journal of Materials
Processing Technology. 2003; 142(1):289-294. http://dx.doi.
org/10.1016/S0924-0136(03)00579-X.
32. Mandal S, Sivaprasad PV, Venugopal S, Murthy KPN and Raj
B. Artificial neural network modeling of composition-process-property correlations in austenitic stainless steels. Materials Science and Engineering A. 2008; 485(1-2):571-580. http://
dx.doi.org/10.1016/j.msea.2007.08.019.
33. Li L, Ye B, Liu S, Hu S and Li B. Inverse analysis of the
stress-strain curve to determine the materials models of work hardening and dynamic recovery. Materials Science and Engineering A. 2015; 636:243-248. http://dx.doi.org/10.1016/j. msea.2015.03.115.
34. Quan GZ, Shi Y, Wang Y-X, Kang B-S, Ku T-W and Song W-J. Constitutive modeling for the dynamic recrystallization
evolution of AZ80 magnesium alloy based on stress-strain data.
Materials Science and Engineering A. 2011; 528(28):8051-8059.
http://dx.doi.org/10.1016/j.msea.2011.07.064.
35. Quan GZ, Kang B-S, Ku T-W and Song W-J. Identification for
the optimal working parameters of Al-Zn-Mg-Cu alloy with the processing maps based on DMM. International Journal of
Advanced Manufacturing Technology. 2011;
56(9-12):1069-1078. http://dx.doi.org/10.1007/s00170-011-3241-6.
36. He J, Cui Z, Chen F, Xiao Y and Ruan L. The new ductile
fracture criterion for 30Cr2Ni4MoV ultra-super-critical rotor steel at elevated temperatures. Materials & Design. 2013;
52:547-555. http://dx.doi.org/10.1016/j.matdes.2013.05.080.
37. Sun Y, Zeng W, Zhao Y, Han Y and Ma X. Intelligent method
to develop constitutive relationship of Ti-6Al-2Zr-1Mo-1V alloy. Transactions of Nonferrous Metals Society of China.
2012; 22(6):1457-1461. http://dx.doi.org/10.1016/S1003-6326(11)61341-1.
38. Sabokpa O, Zarei-Hanzaki A, Abedi HR and Haghdadi N. Artificial
neural network modeling to predict the high temperature flow behavior of an AZ81 magnesium alloy. Materials & Design. 2012; 39:390-396. http://dx.doi.org/10.1016/j.matdes.2012.03.002.
39. Zhu Y, Zeng W, Sun Y, Feng F and Zhou Y. Artificial neural
network approach to predict the flow stress in the isothermal compression of as-cast TC21 titanium alloy. Computational
Materials Science. 2011; 50(5):1785-1790. http://dx.doi. org/10.1016/j.commatsci.2011.01.015.
40. Gupta AK, Singh SK, Reddy S and Hariharan G. Prediction
of flow stress in dynamic strain aging regime of austenitic stainless steel 316 using artificial neural network. Materials & Design. 2012; 35:589-595. http://dx.doi.org/10.1016/j. matdes.2011.09.060.
41. Hornik K, Stinchcombe M and White H. Multilayer feedforward
networks are universal approximators. Neural Networks. 1989; 2(5):359-366. http://dx.doi.org/10.1016/0893-6080(89)90020-8.
42. Malinov S and Sha W. Application of artificial neural networks for modelling correlations in titanium alloys. Materials Science and Engineering A. 2004; 365(1-2):202-211. http://dx.doi. org/10.1016/j.msea.2003.09.029.
43. Chai RX, Guo C and Yu L. Two flowing stress models for
hot deformation of XC45 steel at high temperature. Materials Science and Engineering A. 2012; 534:101-110. http://dx.doi.
44. Mandal S, Rakesh V, Sivaprasad PV, Venugopal S and Kasiviswanathan KV. Constitutive equations to predict high
temperature flow stress in a Ti-modified austenitic stainless steel. Materials Science and Engineering A. 2009; 500(1-2): 114-121. http://dx.doi.org/10.1016/j.msea.2008.09.019.
45. Lin YC, Chen M-S and Zhong J. Effect of temperature and strain
rate on the compressive deformation behavior of 42CrMo steel.
Journal of Materials Processing Technology. 2008; 205(1-3): 308-315. http://dx.doi.org/10.1016/j.jmatprotec.2007.11.113.
46. Lin YC, Chen M-S and Zhong J. Constitutive modeling
for elevated temperature flow behavior of 42CrMo steel.
Computational Materials Science. 2008; 42(3):470-477. http://
dx.doi.org/10.1016/j.commatsci.2007.08.011.
47. Yue CX, Zhang L, Liao S, Pei J, Gao H, Jia Y, et al. Research
on the dynamic recrystallization behavior of GCr15 steel.
Materials Science and Engineering A. 2009; 499(1-2):177-181.
http://dx.doi.org/10.1016/j.msea.2007.11.123.
48. Han Y, Qiao G, Sun JP and Zou D. A comparative study on
constitutive relationship of as-cast 904L austenitic stainless steel during hot deformation based on Arrhenius-type and artificial neural network models. Computational Materials Science. 2013;
67:93-103. http://dx.doi.org/10.1016/j.commatsci.2012.07.028.
49. Qin YJ, Pan QL, He YB, Li WB, Liu XY and Fan X. Artificial
neural network modeling to evaluate and predict the deformation
behavior of ZK60 magnesium alloy during hot compression. Materials and Manufacturing Processes. 2010; 25(7):539-545.