Josiana PRADO AFONSO
Master in Physics Engineering
Towards Cryogenic Liquid
–
Vapor Energy
Storage Units for space applications
Dissertation to obtain the Doctoral degree in Physics Engineering
Supervisor: Dr. Bernard Rousset, Researcher,
CEA-Grenoble, Université de Grenoble
Supervisor: Prof. Grégoire Bonfait, Associate Professor,
Universidade Nova de Lisboa
Co-Supervisor: Dr Ivan Charles, Researcher,
CEA-Grenoble, Université de Grenoble
Co-Supervisor: Profª Isabel Catarino, Auxiliary Professor,
Universidade Nova de Lisboa
Jury :
President : Prof. Jorge Pamies Teixeira, Universidade Nova de Lisboa Rapporteurs: Prof. Marcel Ter Brake, Twente University
Prof. António Amorim, Universidade de Lisboa Members: Prof. José Rebordão, Universidade de Lisboa Dr. Bernard Rousset, CEA-Grenoble
Prof. Grégoire Bonfait, Universidade Nova de Lisboa Dr. Ivan Charles, CEA-Grenoble
Profª Isabel Catarino, Universidade Nova de Lisboa
Towards Cryogenic Liquid –Vapor Energy Storage Units for space applications
Copyight ©All rights reserved at Josiana Prado Afonso, FCT/UNL, UNL and UG.
For this thesis, I received help from many people and their influence is noticeable in the contents of this thesis.
First of all, I would like to thank Prof Bonfait and Prof Isabel for the opportunity they gave me, back in 2007, to take part in the research at the cryogenic lab at CEFITEC/UNL, where I started out as a researcher.
I would like to acknowledge the help and support received during my thesis in Portugal. Regarding my stay in Grenoble, I want to thank the Dr Girard , the head of the Service de Basses Temperatures of CEA and Dr Duband, the head of the cryocoolers and space cryogenics group) for having welcomed me.
I could never thank enough for the support provided by Dr Charles, who over almost the past three years has not only helped me, providing all the necessary technological and scientific information, but also gave me all his support whenever I needed it.
Mention has to be made of the help given by Dr Rousset, who, despite not being near my working place, was always ready to provide his scientific support whenever I needed clarification.
Concerning my thesis report, I would like to thank my four supervisors and I would like to say how obliged I feel for all the time, patience and accuracy provided and showed by Dr Charles and Dr Rousset, who despite the distance were always available to help me either on phone or by email.
I would like to thank:
Dr Gully for the conversation we had about heat transfer in the porous media with diphasic helium and for his great help in developing the model presented in the thesis.
Alexandre Coynel for his availability and help at the lab, mainly with the set-up and solve technical problems.
Dr Prouve for his willingness and availability to solve a leakage problem in the set-up and to continue the experiment when I had to go back to Portugal.
All people of the Service de Basses Temperatures for making me feel at home during the stay at their lab and for the excellent working environment. I thank all the people who spent their time teaching me their know-how and helped me.
Large thanks to all the members of the jury who agreed to assess this work.
To cabinet colleagues in Portugal and Grenoble: Daniel, Diogo and Aurélia, who allowed for moments of relaxation during experiments.
To all my friends from Portugal and Grenoble who walked with me this academic path, who shared joys, sadness, victories and moments of stress. A special word of gratitude goes to Patricia, Adérito, Angela -my good confidents.
I want to thank my mother and my sister, who, although far away, were always there to encourage me in bad times and congratulated me in good times. I also thank David for his availability to help me.
Special thanks to several Institutions for their support::
To Fundação da Ciência e da Tecnologia for giving me a PhD scholarship (SFRH/BD/60357/2009) and a financial support for the project “Cryogenic
To CEA-Grenoble/Service de Basses temperatures, Grenoble, France;
To CEFITEC, and the Physics Department of Faculdade de Ciência e Tecnologia of Universidade Nova de Lisboa, Portugal.
O desenvolvimento de criorrefrigeradores e de sensores cada vez mais sensíveis, torna interessante usar unidades de armazenamento de energia (Energy Storage Unit-ESU) e desligar o criorrefrigerador para funcionar num ambiente sem vibrações. Em particular para as aplicações espaciais, seria também útil, utilizar um ESU para evitar sistemas criogénicos sobredimensionados para atenuar as flutuações de temperaturas devidas às variações de carga térmica. Em ambos os casos, a deriva de temperatura deve manter-se limitada para manter o bom desempenho dos detectores.
Nesta tese, ESUs utilizando o calor latente associado à mudança líquido-vapor como reservatório de energia foram estudados. A fim de limitar a deriva de temperatura, enquanto se mantém de tamanho reduzido a célula a baixa temperatura, uma solução possível consiste em dividir o ESU em dois volumes: uma célula a baixa temperatura acoplada ao dedo frio do criorrefrigerador mediante um interruptor térmico conectado a um volume de expansão à temperatura ambiente para reduzir o aumento de temperatura que ocorre durante a evaporação do líquido. Para diminuir ainda mais a deriva de temperatura, foi testado uma nova ideia que consiste na introdução de uma válvula entre os dois volumes a fim de controlar a pressão na célula. Para tornar o ESU independente da gravidade e assim adaptado às aplicações espaciais, os efeitos da capilaridade foram utilizados usando um material poroso na célula. Neste caso, as experiências revelam resultados inesperados referentes ao armazenamento de energia e à diferença de temperatura entre o líquido e as paredes.
Para descrever as modificações térmicas devidas ao meio poroso, uma célula com paredes laterais pouco condutoras foi construída e testada com hélio. Após uma caracterização completa fora das condições de saturação (condução, convecção), esta célula foi utilizada para experiências com e sem meio poroso, aquecida na parte superior ou na parte inferior com diferentes fluxos de calor e para várias temperaturas de saturação. Em paralelo, um modelo que descreve a resposta térmica de uma célula contendo líquido e gás num meio poroso aquecido na parte superior (“contra a gravidade”) foi desenvolvido. Os resultados obtidos foram utilizados como referência ao modelo que se baseia no equilíbrio de três forças: a força de capilaridade, a força da gravidade e perda de carga induzida pelo escoamento do líquido.
Résumé
Avec le développement des réfrigérateurs cryogéniques mécaniques et des capteurs de plus en plus sensibles, l’emploi d’un volant thermique (Energy Storage Unit ou ESU) doit permettre de stopper temporairement le cryoréfrigérateur et de fonctionner en l’absence de vibration. L'utilisation d'un ESU limite également la nécessité de surdimensionner le système cryogénique pour absorber les éventuelles surcharges thermiques transitoires; ce qui est particulièrement utile pour les applications spatiales. Dans tous les cas, la dérive en température doit rester limitée pour garantir la bonne performance du détecteur.
Dans cette thèse, des ESUs basés sur la chaleur latente associée au changement de phase liquide-vapeur ont été étudiés. Afin de limiter la dérive en température, tout en maintenant un volume réduit pour la cellule à basse température, une solution possible consiste à séparer l'ESU en deux volumes: une cellule à basse température reliée au doigt froid du cryoréfrigérateur à travers un interrupteur thermique et un volume d'expansion à la température ambiante permettant de réduire l’augmentation de température liée à l'évaporation du liquide. Pour diminuer encore la dérive en température, une nouvelle amélioration a été testée avec de l'azote: elle consiste en la mise en place d'une vanne commandée entre les deux volumes permettant de contrôler la pression de la cellule froide (remplie d’azote liquide-vapeur). De plus, un matériau poreux a été introduit à l'intérieur de la cellule pour rendre l'ESU indépendant de la gravité et donc approprié aux applications spatiales. Dans ce cas, les expériences révèlent des résultats inattendus concernant le stockage d'énergie et la différence de température entre le liquide et les parois.
Pour caractériser l'influence des milieux poreux sur les transferts thermiques d’un volant thermique liquide-vapeur chauffé, une cellule dédiée avec des parois latérales non conductrices a été construite et testée avec de l'hélium diphasique liquide-vapeur. Après caractérisation complète de cette cellule en dehors des conditions de saturation (conduction, convection), des expériences ont été effectuées avec ou sans milieu poreux, en chauffant la cellule en haut ou en bas de la cellule et pour différents flux de chaleur et températures de saturation. En parallèle, un modèle décrivant la réponse thermique d'une cellule contenant liquide et vapeur avec un milieu poreux chauffée en haut (contre la gravité) a été mis en œuvre. L'ensemble des données a ensuite été utilisé comme référence pour ce modèle qui repose sur un équilibre de trois forces: la force de capillarité, la force de gravité et la perte de pression induite par l'écoulement du liquide.
Abstract
With the development of mechanical coolers and very sensitive cryogenic sensors, it could be interesting to use Energy Storage Units (ESU) and turn off the cryocooler to operate in a free micro vibration environment. An ESU would also avoid cryogenic systems oversized to attenuate temperature fluctuations due to thermal load variations which is useful particularly for space applications. In both cases, the temperature drift must remain limited to keep good detector performances.
In this thesis, ESUs based on the high latent heat associated to liquid-vapor phase change to store energy have been studied. To limit temperature drifts while keeping small size cell at low temperature, a potential solution consists in splitting the ESU in two volumes: a low temperature cell coupled to a cryocooler cold finger through a thermal heat switch and an expansion volume at room temperature to reduce the temperature increase occurring during liquid evaporation. To obtain a vanishing temperature drift, a new improvement has been tested using two-phase nitrogen: a controlled valve was inserted between the two volumes in order to control the cold cell pressure. In addition, a porous material was used inside the cell to turn the ESU gravity independent and suitable for space applications. In this case, experiments reveal not fully understood results concerning both energy storage and liquid-wall temperature difference.
To capture the thermal influence of the porous media, a dedicated cell with poorly conductive lateral wall was built and operated with two-phase helium. After its characterization outside the saturation conditions (conduction, convection), experiments were performed, with and without porous media, heating at the top or the bottom of the cell with various heat fluxes and for different saturation temperatures. In parallel, a model describing the thermal response for a cell containing liquid and vapor with a porous medium heated at the top (“against gravity”) was developed. The experimental data were then used as a benchmark for this model based on a balance of three forces: capillarity force, gravity force and pressure drop induced by the liquid flow.
List of Contents
DECLARATION ... II ACKNOWLEDGEMENTS ... III SUMÁRIO ... V RESUME ... VII ABSTRACT ... IX LIST OF CONTENTS ... XI LIST OF FIGURES ... XV LIST OF TABLES ... XXIII LIST OF VARIABLES ... XXV
INTRODUCTION ... 27
CHAPTER 1: THERMAL ENERGY STORAGE UNIT ... 31
1.1 Types of storage techniques for ESU ... 31
1.2 Sensible heat ESU ... 32
1.2.1 ESU at 20 K using lead ... 33
1.2.2 ESU at 6 K using Gd2O2S ... 34
1.2.3 Ball Aerospace ESU at 15 K using lead ... 35
1.2.4 ESU tandem arrangement using TSU at 40 K (Copper) and TSU at 15 K (helium). .. 35
1.3 Triple Point ... 37
1.3.1 Nitrogen Triple point - ESU at 63 K ... 37
1.3.2 TSU at 14 K using the hydrogen triple point ... 40
1.4 Dual phase ... 41
1.4.1 BETSU at 120 K using Solid –Liquid transition of methylpentane ... 41
1.4.2 CTSU at 35 K using Solid-Solid transition of nitrogen ... 42
1.4.3 ITSU at 35 K using the Liquid-Vapor transition of neon ... 43
1.4.4 CRYOTSU at 60 K using the Solid –Solid transition of nitrogen trifluoride ... 43
1.4.5 TSU between 4 - 90 K using different fluids ... 45
1.4.6 ESU between 20 K and 80 K using heat capacity of solid water. ... 47
1.5 Conclusion ... 49
CHAPTER 2: ENERGY STORAGE UNIT OF LIQUID- VAPOR NITROGEN ... 51
2.1 Liquid-Vapor Enthalpy Reservoir (without ceramic) ... 51
2.1.1 Experimental set-up... 51
2.1.2 Modus operandi... 53
2.1.3 Results ... 54
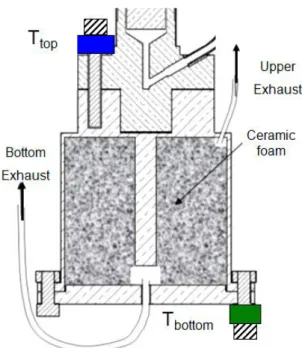
2.2 Liquid-Vapor Enthalpy Reservoir (with ceramic) ... 56
2.2.1 Experimental set-up/modus operandi ... 56
2.2.2 Results ... 57
2.2.2.1 Expansion Volume of 6 liters ... 57
2.2.2.2 Volume expansion of 24 liters... 60
2.3 Controlled temperature Liquid-Vapor Enthalpy Reservoir (without ceramic) ... 63
2.3.1 Modus operandi... 63
2.3.2 Results ... 64
2.4 Controlled temperature Liquid – Vapor Enthalpy Reservoir (with ceramic) ... 68
2.4.1 Results ... 68
2.4.2 Tests with Ceramic ... 69
2.4.3 Other tests ... 73
2.4.4 ESU working in “Power booster mode” ... 74
2.4.5 Software for controlled temperature Liquid-Vapor Enthalpy Reservoir ... 76
2.5 Conclusion ... 77
CHAPTER 3: STUDY OF ENERGY STORAGE UNIT AT 4.5 K... 79
3.1 Context ... 79
3.2 Analyze an 1 liter ESU using Helium ... 80
3.3 Dimensioning the ESU with Helium ... 85
3.3.1 ESU with a porous medium ... 88
3.3.2 Sensibility study to the initial temperature TI and ΔT ... 90
3.3.2.1 Study of different TI ... 90
3.3.2.2 Study different ΔT ... 92
3.4 Comparison between Solid ESU and Fluid ESU ... 93
3.5 Dual volume ... 94
3.6 Conclusion ... 95
CHAPTER 4: TWO PHASE NORMAL HELIUM BEHAVIOR IN A POROUS MEDIUM WITH APPLIED HEAT FLUX ... 97
4.1 Objectives ... 97
4.2 Principle of experience ... 97
4.3.1 The cell ... 99
4.3.1.1 Ceramic ... 101
4.3.2 The expansion volume ... 102
4.3.3 Heat transfer ... 103
4.3.3.1 Conduction with ceramic ... 105
4.3.3.2 Convection with and without ceramic ... 107
4.4 Modus operandi ... 111
4.5 Cooling process ... 112
4.5.1 Cooling of the cell without ceramic ... 112
4.5.2 Cooling of the cell with ceramic ... 113
4.5.3 Comparison between cooling down with ceramic and without ceramic ... 114
4.5.4 Cooling down of the cell with ceramic in superfluid. ... 115
4.6 The effect of wicking height variation when the cell is heating on the top end ... 117
4.6.1 Results when cell is heating on the top end ... 117
4.6.1.1 Heating the top of the cell without ceramic ... 117
4.6.1.2 Heating the top of the cell with ceramic ... 117
4.6.1.3 Heating the top of the cell with ceramic - effect of the load applied at a given temperature ... 118
4.6.1.4 Heating the top the cell with ceramic- effect of the saturation temperature ... 119
4.6.1.5 Discussion about heating on top of the cell ... 121
4.6.2 Model when the cell is heating on the top end ... 127
4.6.3 New cell with an extended height ... 133
4.6.4 Synthesis of heating the top of the cell with ceramic ... 136
4.7 The effect of porous media when the cell is heating on the bottom end ... 137
4.7.1 Results when the cell without ceramic is heating on the bottom end ... 137
4.7.1.1 Heating the bottom of the cell without ceramic for a given temperature ... 137
4.7.1.2 Heating the bottom of the cell without ceramic – effect of the applied load and of the saturation temperature ... 138
4.7.1.3 Synthesis of heating the bottom of the cell without ceramic ... 139
4.7.2 Results when the cell with ceramic (P160 – Kapirock) is heating on the bottom end 139 4.7.2.1 Heating the bottom of the cell filled with ceramic (P160 – Kapirock) for a given temperature ... 139
4.7.2.2 Heating the bottom the cell with ceramic (P160 – Kapirock) - effect of the applied load at a given temperature ... 141
4.7.2.3 Heating the bottom the cell with ceramic (P160 – Kapirock) - effect of saturation temperature. ... 143
4.7.3 Effect of other ceramic type - ceramic-502 ... 151
4.7.3.1 Ceramic description ... 151
4.7.3.2 Heating the top of the cell with ceramic-502 ... 152
4.7.3.3 Heating the bottom of the cell with ceramic-502 ... 153
4.7.4 Synthesis of heating up the bottom of the cell with ceramic ... 155
4.8 Conclusion ... 156
CHAPTER 5: CONCLUSION AND PERSPECTIVE ... 157
APPENDIX A: TABLE OF TEST IN THE CONFIGURATION “CONTROLLED
List of Figures
Figure 1.1: Single and dual volume ESU [2]. ... 32
Figure 1.2: Specific heat of lead and other usual material frequently used in cryogenics as a function of temperature. ... 33
Figure 1.3: Schema (left), and 3D view (right) of ESU composed by enthalpy reservoir and thermal switch [7]. ... 33
Figure 1.4: The variation of enthalpy reservoir (TER) calculated (solid line) and experimental (squares) when 4.6 mW was applied. The TCF represents the cold finger temperature of the cryocooler. The dotted line represents the enthalpy stored (right axis) in the enthalpy reservoir between T and 11 K [7]. ... 34
Figure 1.5: Specific heat of GOS as a function of temperature... 34
Figure 1.6: Cross section (left) and 3D view (right) of ESU composed by enthalpy reservoir and thermal switch [12]. ... 35
Figure 1.7: Schematic of 10 K Cryocooler adapted from [14]. ... 36
Figure 1.8: J-T stage peak cooling power capacity for the JT with TSU placed in the high and low pressure lines [14]. ... 37
Figure 1.9: Photograph of the aluminium TSU [9]. ... 38
Figure 1.10: Temperature evolution of TSU for the 0.5 W [9]. ... 38
Figure 1.11: Schematic of the Twente TSU [6]. ... 39
Figure 1.12: Temperature evolution of TSU for the 2.5 W adapted from [6]. ... 40
Figure 1.13: The thermal bus (first), complete cold unit (second), Thermal Storage Unit mounted on the second stage of the Gifford Mac Mahon [16]. ... 40
Figure 1.14: Temperature evolution in dual and single volume configuration, with 100 mW of applied thermal load 100 mW [16]. ... 41
Figure 1.15: Weight ratio of metallic sensible heat to phase change device in BETSU, as a function of allowable temperature rise [17]. ... 42
Figure 1.16: Photographs of the DV-CTSU (right) and heat exchanger (left) [19]. ... 42
Figure 1.17: The complete system for the solid N2 TSU[19]. ... 43
Figure 1.18: Schema of the hybrid cooler with an internal Thermal Storage Unit [15]. ... 43
Figure 1.19: Design of TSU [1]. ... 44
Figure 1.20: Schema of Flight CTSU [3]. ... 45
Figure 1.21: Photograph of the triple point CTSU with stainless steel vessel [23]. ... 45
Figure 1.22: Schema of the experimental apparatus [25]. ... 47
Figure 1.23: Schema of the experimental set-up [26]. ... 48
Figure 1.24: Temperature drift for the liquid N2 ESU mode (1 W applied) starting at T≈ 65 K with a filling pressure of 1.95 bar [26]. ... 48
Figure 2.19: Comparison of the temperature drift with 6 liters expansion volume, with ceramic, cryocooler heating up at 1.63 K/min, 1 W applied load and with filing pressure of 2 bars (solid line) and 2.5 bars (dashed line). The capillary was in top of the cell. The red points signal the end of the control and correspond to a filling ratio of 14 % and 26 % respectively. And the yellow points the beginning of the temperature drift and corresponds to a filling ratio of 26 %.70 Figure 2.20: Comparison of the temperature drift with 6 liters expansion volume, with ceramic, cryocooler heating up at 0.8 K/min, 0.5 W applied load and with filling pressure of 2 bars (solid line) and 2.5 bars (dashed line). The capillary was in bottom of the cell. The red points signal the end of the control and correspond to a filling ratio of 24 % and 12 % respectively. The yellow point the beginning of the temperature drifts and corresponds to a filling ratio of 21 %.71 Figure 2.21: Comparison of the temperature drift between the cell with and without the copper grid (solid line and dashed line, respectively) with 6 liters expansion volume, with ceramic, cryocooler heating up at 0.8 K/min, 1 W applied load with filling pressure of 2.5 bars The capillary was in the bottom of the cell. The red points signal the end of the control corresponds to a filling ratio of 26 %. ... 72 Figure 2.22: Temperature control at 77.1 K using the bottom gas exhaust of the cell with ceramic with 24 liter expansion volume, cryocooler heating up at 0.8 K/min, with filling pressure of 1.25 bar. The red point signal the end of the control corresponds to a filling ratio of 35 %. ... 73 Figure 2.23: Temperature control at 81 K when heat burst are released using the bottom gas exhaust of the cell with ceramic with 6 liters expansion volume, cryocooler heating up at 1.63 K/min, with filling pressure of 2.5 bars... 74 Figure 2.24: Schematic of the “cooling power booster” mode. ... 74 Figure 2.25: Temperature drift in cooling power booster mode with an ESU filled with nitrogen (solid line) and the empty ESU (crosses). ... 75 Figure 2.26: Interface of the software for constant temperature liquid enthalpy reservoir. The encircled numbers are identifying parameter explained in the text. ... 77 Figure 3.1: Schema of the SPICA cryogenic chain [11]. ... 79
Figure 4.11: Schema of the experimental set-up to measure conduction. ... 105 Figure 4.12: Load applied on the top of the cell with ceramic and with vacuum inside as function of ΔT (Ttop- Tbottom) at 4.2 K (green square) and 2.5 K (red square). The theoretical values for the cell wall made of stainless steel are represented by lines. ... 106 Figure 4.13: Load applied on the top of the cell with ceramic and liquid as function of ΔT (Ttop
-Tbottom ) at 4.65 K (green square) and 2.5 K (red square). Theoretical values taking into account
Figure 4.29: Evolution of ratio between the accessible energy and the theoretical energy with load applied on top of the cell for three different temperatures (4.65 K. 3.55 K and 2.55 K). . 120 Figure 4.30: Evolution of top and bottom temperatures when 10 mW is applied on the top between 0.95 min and 2 min. At 2 min the heating is stopped and at 2.3 min, 2.5 mW is applied on the cell top. ... 121 Figure 4.31: Scheme of the two zones in the cell when the heating power was applied on the top of the cell. In the bottom there is only liquid. In the diphasic zone there is vapor and a small quantity of liquid due to capillary effect. ... 122 Figure 4.32: The capillary heights calculated from the experimental results (ordinate of the fit found with applied load) (round point). In dash lines the capillary heights calculated for the three different radius pore. ... 123 Figure 4.33: The evolution of the pore radius and the capillary heights for the different temperatures tested for different value of α. ... 124 Figure 4.34: Evolution of the slopes of the ration between the accessible energy and the theoretical energy fit versus the heating power applied reported in Figure 4.29 as a function of temperature and for different applied loads (cell with ceramic). ... 125 Figure 4.35: The Pressure-Enthalpy diagram for helium. The green line represents the 4.65 K experience. ... 126 Figure 4.36: The Pressure-Density diagram for helium. The red line represents the 4.65 K experience. ... 126 Figure 4.37: The error for different saturation temperatures for an initial subcooling of 0.1 K. ... 127 Figure 4.38: Scheme of the cell when the heating power is applied on the top of the cell. The
is the filtration velocity, v is the vapor, α is the rate of liquid in the two phase zone. ... 128 Figure 4.39: Comparison of the ratio between the accessible energy and the theoretical energy with load applied on top of the cell for three different temperatures (4.65 K. 3.55 K and 2.55 K). The points are experimental results and the solid lines are results obtained from the model with
. ... 130 Figure 4.40: The capillary heights calculated from the experimental results without the point at 2.55 K (ordinate of the fit found with applied load) for α equal to 10%(circle point). The dashed
line is the capillary height calculated for Jurin’s law. ... 131 Figure 4.41: Comparison of ratio between the accessible energy and the theoretical energy with load applied in top of the cell for three different temperatures (4.65 K, 3.55 K and 2.55 K). The points are experimental results and the solid lines are results obtained from the model with
List of tables
Table 1.1: Comparison between single volume and dual volume system [2]. “PCM” stands for Phase Change Material. ... 32 Table 1.2: Features and benefits of the charcoal TSU [14]. ... 36 Table 1.3: BETSU design requirement [17]. ... 41 Table 1.4: Requirements for the 60 K Thermal Storage Unit [3]. ... 44 Table 1.5: Experimental condition for PCM characterization tests [1]. ... 44 Table 1.6: Thermal parameters and lifetime of SR & DB cryocoolers for the 4-90 K temperature range with melting-freezing, evaporation- condensation, and solid-solid transition accumulators [4]. ... 46 Table 1.7: Some prospective cryogenic accumulator fluids for the 4-150 K temperature range [4]. ... 46 Table 3.1: The reduction of the recycling time as function of the energy stored in the ESU and the temperature drift. ... 80 Table 3.2: The density of helium as function of filling pressure for an ESU of 1 liter. The deviation from ideal behavior was calculated (Z- compressibility factor). ... 82 Table 3.3: Some properties of stainless steel and titanium (alloy Ta6V). ... 87 Table 3.4: Values of ESU for three different initial temperature TI. ... 91 Table 3.5: Values of ESU lighter for three different ΔT. ... 92 Table 4.1: Values of critical filtration Rayleigh number in function of hydrodynamic and thermal boundary conditions of the cell [43]. ... 110 Table 4.2: Some properties of vapor helium, the vapor filtration velocity and the vapor pressure drop of three different temperatures for 10 mW of power applied. ... 146 Table 4.3: The capillary force of liquid helium (pore radius 21 μm) of three different temperatures. ... 146 Table 4.4: Some properties of liquid helium, the liquid filtration velocity and the liquid pressure drop of three different temperatures. ... 147 Table 4.5: Characteristic of Altraform KVR/502 and Kapirok ceramic P 160. ... 151
Table A.1: Summary of tests. Case of “controlled liquid enthalpy reservoir” with ceramic with
List of Variables
C specific heat
Q heat
L latent heat
m mass
TER temperature of enthalpy reservoir
Tliq temperature inside the cell
Ttop temperature on the top end of the cell
Tbottom temperature on the bottom end of the cell
Qpara parasitical energy
Ucell internal energy
hvapor enthalpy vapor
Psat saturation pressure
Tsat saturation temperature
Pfill filling pressure
TPC pre-cooling temperature
TF Functional or final temperature
PF Functional or final pressure
Pmin minimal pressure
t time
PESU pressure inside the cell
PEXP pressure in the expansion volume
n number of moles evaporated
T cold finger temperature of cold finger
Z compressibility factor ρ density
E energy
uf specific internal energy at initial temperature
ui specific internal energy at final temperature
V volume
Cv volumetric specific heat capacity
stress
D diameter
thickness of cell wall
TI initial temperature of energy storage unit
σ surface tension Ø diameter capillaries ρliq liquid density ρvap vapor density
h capillary height
lc capillary length
R Thermal resistance
Ral Rayleigh number
Nusselt number μ dynamic viscosity
specific heat
thermal conductivity of the liquid in the cell
Lc characteristic length
Th temperature of the hot surface
Tc temperature of the cold surface volume coefficient of expansion
As area of the cell
k permeability
H height of cell
effective thermal conductivity
Cpl specific heat capacity of liquid conductance of heat switch,
A section of the cell
ε porosity of ceramic
α part of liquid that is stored inside the ceramic
r radius pore
E origin accessible energy at the y-intercept.
E acess accessible energy
E theor theoretical energy
Hen enthalpy
capillary pressure
gravitational force
pressure drop induced by liquid flow
pressure drop induced by vapor flow
UL filtration velocity of liquid
UV filtration velocity of vapor volumetric flow rate
Vcell volume of cell
Q load heat
mass flow rate g gravity acceleration
Acronyms
ESU Energy Storage Unit
CTSU Cryogenic Thermal Energy Storage Unit TSU Thermal Storage Unit
PCM phase change material
The latest advances in spatial missions require cryogenic systems that provide to very sensitive sensors a low (e.g. from 50 mK to 100K) and a stable temperature to very sensitive sensors and, as far as possible, without vibration generation [1–4].
To reach the low temperature, a cryostat filled with liquid and/or a cryocooler are used. However, both systems have some disadvantages: the cryostat has a finite lifetime (for instance, the 2400 liters helium reservoir of Herschel satellite will be depleted this year) and the cryocooler, even with the Pulse Tube developments, generate vibrations due to the expansion-compression processes inherent to their operation and due to moving parts on the compressor side [5]. In some cases, these vibrations are incompatible with the very sensitive sensors needed for high precision measurements. A potential solution for this problem would be to stop the cryocooler during the measurements [6–8]; however this would lead to a rapid increase of the sensor temperature. To reduce this temperature increase, it is possible to couple the detection stage to an Energy Storage Unit (ESU) which is a system able to store the parasitical heat load and the heat dissipated by the sensors itself in order to maintain the sensors at low temperature in a totally vibration-free environment. Let us note that such systems have also ground applications for any system using regenerative cryocooler and requiring a negligible vibration level. Such an ESU can also be useful to maintain a stable temperature by absorbing the heat bursts released by sensors [2][9] or, integrated in a cryogenic chain, adsorbing the heat bursts occurring during regeneration phase of adsorption or adiabatic demagnetization refrigerator [10].
To store thermal energy at low temperature, the sensible heat of materials with high specific heat or the latent heat associate to fluid phase changes can be used. To facilitate its integration in a cryogenic system, the ESU shall be as small as possible, and, as usual for space applications, it has to be as light as possible. This requirement leads to minimization of the mechanical support sections which helps reducing the heat leaks coming through. Furthermore the space application ESU must be insensitive to the gravity effect.
The ideal energy storage system would not have any temperature drift during the energy storage phase of operation. The ESUs using the triple point of pure systems are then the best candidates for stability but unfortunately such system can only work for limited discrete temperatures and cannot be employed below 13.8 K (the hydrogen triple point). An alternative solution was imagined and tested during this thesis consists in using a system that allows the evaporation of liquid at constant temperature by using a pressure control. This controlled solution has some advantages: the working temperature can be a priori chosen as far as it corresponds to a temperature on the saturation line of a cryogenic liquid. It is shown in this thesis that such systems compete favorably when compared with a triple point solution in energy capacity per cold volume unit. The ESUs with two phase fluid need to incorporate porous media to confine the liquid inside the cell [3][6][9]. However this porous media has to be chosen properly, pore diameter and void fraction being some of the issues to be solved. Thermal response of such system has been poorly studied and both data and theory are still lacking: fulfilling this lack is one of the goals of this thesis.
This thesis is organized in four chapters. In the first chapter, a review of the state of the art about the existing low temperature ESUs is presented. This section is divided using the different types of storage techniques.
The second chapter is about original ESUs that used the latent heat associated to nitrogen vapor transition. Two systems are presented: the first one is a simple liquid-vapor enthalpy reservoir while the second one is equipped with a temperature control. These two kinds of ESUs were designed and built during the thesis are able to store 4.0 kJ between 75.7 K – 80.8 K and 1.5 kJ at 81 K respectively using the two-phase liquid-vapor nitrogen. Each
ESU consists of a nitrogen reservoir, coupled to a cryocooler’s cold finger by a gas-gap switch.
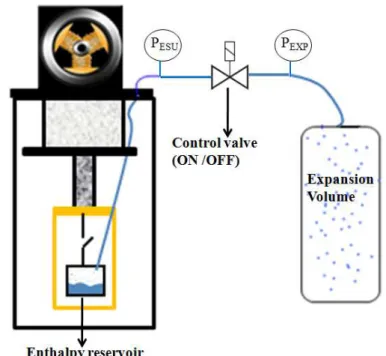
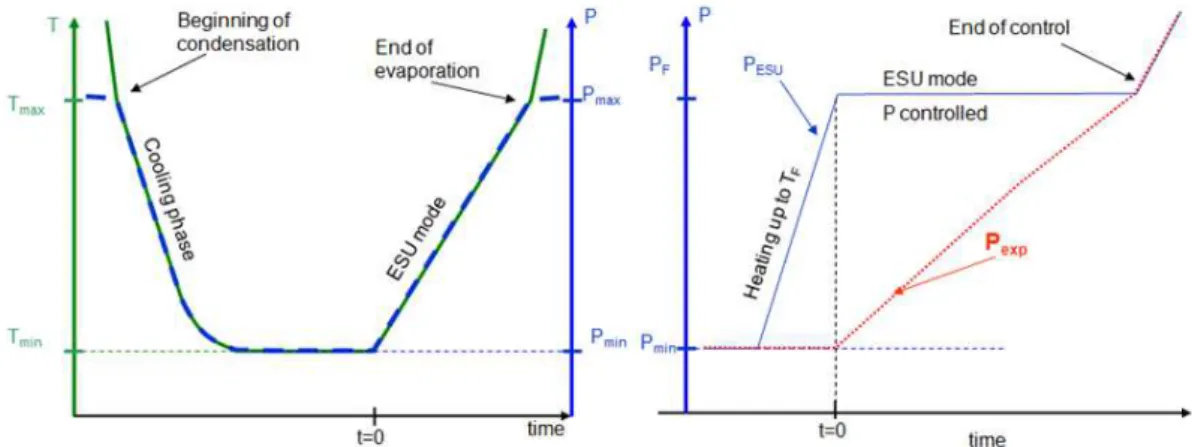
The energy is absorbed by the latent heat due to liquid evaporation along the saturation curve. To reduce the temperature drift of the low temperature reservoir during the heat absorption phase, this reservoir is connected to an expansion volume at room temperature (dual volume configuration). This second volume is used in order to limit the rise of the pressure and consequently limit the rise of the temperature while following the saturation line. The temperature drift versus the energy absorbed is an important feature of an ESU, because it can be a serious inconvenient for some particularly sensitive application. One way to decrease this temperature drift is to use a larger expansion volume. Another new possibility is to keep the saturated pressure fixed (and also the saturated temperature) at the required set point value. This control of pressure is the main novelty of the second kind of ESU built and tested here. The whole system is pumped (by liquefaction during cooling down) below the required pressure and a valve is introduced between the cold reservoir and the expansion volume. During the transient load, the aperture of the valve is controlled to adjust the pressure drop between the two volumes in order to keep the set point pressure inside the cold reservoir. The control can only be made until the expansion volume reaches the saturation pressure.
If designed for space applications, the ESU must be insensitive to gravity. The use of an adequate porous media is required: this media should be as light as possible, have only open pores with a typical size insuring a capillary height roughly equal to the dimension of the cell for ground demonstration. Porous ceramic was chosen and tests revealed some unexpected behaviors. The presence of ceramic enhances the wall heat transfer in the boiling regime. Furthermore, below a certain liquid quantity in the cell, the cell wall and the fluid becomes progressively thermally decoupled. This issue will be studied by using a dedicated cell that is described in the fourth chapter.
In the third chapter, the study on the sizing of a single volume ESU using helium that absorbs 300 J between 4.5 K and 4.7 K is presented as well as the reason leading to the choice of helium. The coupling of this kind of ESU with an adsorption refrigerator was studied for the SPICA mission (2021) as a potential solution to increase the duty cycle of the one shot sub-kevin coolers [11]. This ESU will use the latent heat associated to the liquid gas transition of helium. A sensitivity study to initial temperature and temperature drift was carried out to see the impact on the ESU design. Beyond thermodynamics, the cell thickness is calculated in order to obtain a first approximation of the weight of such a system. A porous medium was also proposed to turn the ESU insensible to gravity. But in this case where the drift of temperature is quite small ( 0.2 K), the heat transfer between the cell wall (where the heat load is applied) and the fluid confined in the pores should be excellent. As previously mentioned, the thermal heat transfer in presence of ceramic exhibits an unexpected behavior. A dedicated experimental set-up was developed to allow a better understanding of the capillarity effect in the porous media and characterize the heat transfer. This is the subject of the last chapter
An Energy Storage Unit (ESU), also called Cryogenic Thermal Energy Storage Unit (CTSU) or Thermal Storage Unit (TSU) consists in a system able to store thermal energy in order to be used as a temporary cold source [6] or as a thermal buffer to attenuate temperature fluctuations due to heat bursts [2]. Incorporating an ESU may minimize the cryocooler’s size, weight, peak input power and increase the cryocooler’s lifetime [4].
The combined cryocooler-ESU system is ideal to store the heat generated by the sensor for some period of time while the cryocooler is stopped. This provides a cryogenic environment free of any vibration and electromagnetic noise produced by cryocooler compressors.
1.1 Types of storage techniques for ESU
The mains goal of a thermal ESU is then to store the maximum energy in a determined range of temperature in a small and light volume.
There are two types of physical effects that can be used for such ESU: using the specific heat of materials or using latent heat associated to a liquid-vapor, solid-vapor, solid-liquid or solid-solid phase transition of cryogens:
In the first type, a material with high specific heat (C) is chosen in order to absorb the heat (Q) by a small temperature T increase of the material without involving any first order phase transition: ΔT=Q/C. The higher the heat capacity, the smaller the temperature increases. At low temperature (typically, T < 30 K), the specific heat of the material is usually low, then to improve this storage capability, materials with specific heat anomaly are preferred. Such specific heat anomalies occur during magnetic phase transitions such as paramagnetic to magnetic order (ferromagnetic, antiferromagnetic, ferrimagnetic orders). These transitions are of second order and exhibit a peak in C(T).
In the second type, the heat is stored by transformation of a phase into another. At low temperature, the typical phase changes are solid ↔liquid, solid ↔vapor, liquid ↔vapor and
solid↔solid. On contrary to magnetic transitions, these phase changes are of first order and lead
to a latent heat L (of fusion, of sublimation, of vaporization, respectively). During a transformation of an infinitesimal mass quantity dm from a phase to another, an energy
Q= L dm is absorbed. If pressure is kept constant, the transformation occurs at constant temperature. If the system is closed (constant mole number), the phase transformation is usually accompanied by a pressure increase and then, on the coexistence line, by a temperature increase. However, on a triple point of a pure substance (solid, liquid and vapor, for instance), simultaneous coexistence of three phases leads to a phase transformation occurring at constant temperature (Gibbs' phase rule) and pressure.
Two designs of latent heat ESU can be distinguished upon the number of volumes involved: single volume and dual volume. In the single volume design, all the working fluid is stored in the low temperature cell whatever the temperature. The high filling pressure at room temperature, necessary to obtain a non neglectable condensed phase quantity at low
temperature, leads to an increase of the wall thickness and the corresponding cell weight. The design is simple and can be relatively compact.
A dual volume ESU consists in a cell at low temperature connected to a storage tank at room temperature Figure 1.1 [2]. In this configuration, the filling pressure is lower than in a single volume for a given working fluid mass and the energy reservoir becomes lighter and smaller than in a single volume. Some volumetric studies are summarized in Table 1.1 that can help on a trade-off between both configurations [2]. However, this double volume solution has as a main inconvenient: the increase of the total volume of the system and the need for plumbing between the low temperature and the room temperature vessels.
Some publications on the subject are summarized in next subsections (1.2, 1.3 and 1.4). These publications are divided according to the different types of storage technique used.
Figure 1.1: Single and dual volume ESU [2].
Table 1.1: Comparison between single volume and dual volume system [2]. “PCM” stands for Phase Change Material.
1.2 Sensible heat ESU
1.2.1 ESU at 20 K using lead
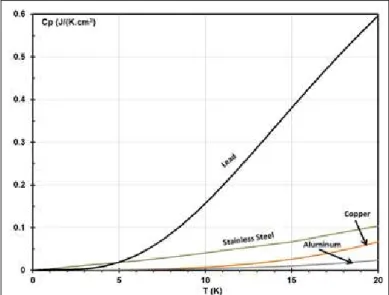
Due to this relatively low Debye temperature, the lattice specific heat of lead is still relatively large compared to other materials and then was previously used for an ESU build and tested to store 36 J between 10 K and 20 K in CEFITEC (Universidade Nova de Lisboa) [7][8]. In Figure 1.2 is shown the specific heat of lead compared to other usual material frequently used in cryogenics.
This device is composed by an energy reservoir (ER) and a heat switch. The ER is a cylindrical copper container (19 mm depth; 30/28 Outer/inner diameter) (Figure 1.3) built with a cylindrical copper rod at its core in order to promote temperature homogeneity. Total mass of copper is 46 g. Inside the copper container 10 cm3(113 g) of lead was melted at 380 ºC to ensure a good contact between copper and lead. The heat switch connects the ER with the cryocooler. The heat switch is used to manage the thermal conduction between its two extremities.
Figure 1.2: Specific heat of lead and other usual material frequently used in cryogenics as a function of temperature.
Figure 1.3: Schema (left), and 3D view (right) of ESU composed by enthalpy reservoir and thermal switch [7].
One way to avoid the temperature drift and to maintain the temperature constant at 20 K was explored by a weakly coupled copper platform, temperature controlled, that uses the reservoir as a cold source.
Figure 1.4: The variation of enthalpy reservoir (TER) calculated (solid line) and experimental (squares) when
4.6 mW was applied. The TCF represents the cold finger temperature of the cryocooler. The dotted line
represents the enthalpy stored (right axis) in the enthalpy reservoir between T and 11 K [7].
1.2.2 ESU at 6 K using Gd2O2S
Another sensible heat ESU was built in CEFITEC. This device uses spheres of Gd2O2S (GOS) to store energy between 3 K and 6 K [12][8]. This ceramic material has a high heat capacity peak at 5.2 K (see Figure 1.5) due to a paramagnetic-antiferromagnetic phase transition. The enthalpy reservoir was dimensioned to store 36 J between 3 K and 6 K.
Figure 1.5: Specific heat of GOS as a function of temperature.
Figure 1.6: Cross section (left) and 3D view (right) of ESU composed by enthalpy reservoir and thermal switch [12].
This enthalpy reservoir was attached to the cold finger of a cryocooler through a heat switch. Thermometers and heaters were thermalized to the copper container. Two different tests were performed. In the first test, the thermal load of 10 mW was applied directly on the reservoir. Between 3 K and 6 K the ESU stored 25.8 J, significantly lower than expected. Several reasons that explain this discrepancy are presented elsewhere [12].
In a second experiment, the heater was attached to a weakly coupled platform. During this test, the cryocooler is stopped and the platform temperature is maintained controlled at 6 K during 51 min. The ESU absorbed 24.8 J. In both cases, the ESU is used as a vibrationless cold source.
1.2.3 Ball Aerospace ESU at 15 K using lead
The Ball Aerospace company built a Hybrid 10 K Cryocooler [13].This machine is a combination of the Joule Thomson cooling stage (reaching 10 K) with a Stirling precooler (reaching 15 K). A TSU (Thermal Storage Unit) that consists of 200 g of lead is mounted on the pre-cooling stage at 15 K. This stage is maintained at a temperature 5 K higher than the sensor temperature (10 K). The choice of this 15 K temperature for pre-cooling is justified by the fact that this is an efficient temperature to start a helium Joule-Thomson cooler. Also, at 15 K, the TSU absorbs more energy than at 10 K due to the specific heat that decreases with decreasing temperature. This system for cooling the sensor at 10 K increases the helium mass flow of the T loop to absorb the load at 10 K during a high heat load. The TSU function is to absorb the peak load at 15 K generated by the J-T system when the flow increases. The good results obtained allowed creating an efficient 10 K cryocooler with variable capability that is easily integrated.
1.2.4 ESU tandem arrangement using TSU at 40 K (Copper) and TSU at 15 K (helium).
cryocooler in adsorbing peaks under variable load. The first TSU (40 K) consists of a simple copper plate that stores energy by sensible heat. However, it also allows sizing the heat exchangers in low load conditions, significantly reducing their sizes and complexities.
The second TSU (15 K) consists of a small pressure vessel filled with charcoal adsorbent connected to the high-pressure side of the J-T stage. The use of charcoal as an adsorbent allows improving volumetric heat capacity of helium concentrated gas. In Table 1.2, it is possible to see features and benefits of the charcoal TSU.
Figure 1.7: Schematic of 10 K Cryocooler adapted from [14].
Table 1.2: Features and benefits of the charcoal TSU [14].
When the temperature in the TSU increases, the charcoal releases helium which flows through the J-T stage. This helium flow induces a cooling effect that counterbalances the heating from the increased flow rate. This way, the TSU and the precooler temperatures increase slowly which allows the system to maintain the sensor temperature at 10 K for a longer time.
Figure 1.8: J-T stage peak cooling power capacity for the JT with TSU placed in the high and low pressure lines [14].
1.3 Triple Point
The system introduced is this section works at the triple point of a pure fluid and absorbs at constant temperature heat loads using the latent heat involved in phase transitions (mainly solid to liquid) .
1.3.1 Nitrogen Triple point - ESU at 63 K
Lockheed ESU at 63 K .
Figure 1.9: Photograph of the aluminium TSU [9].
This TSU, containing 0.656 kg of nitrogen, has two temperature sensors coupled to the top and the bottom hemispheres of the tank. Tests were made with different heat loads, the result for the 0.5 W is presented in Figure 1.10 [9]. In this test, 17 kJ was the thermal capacity according to the nitrogen mass introduced into the TSU. Comparing the initial and final temperatures there is a difference of 0.5 K. This difference increases with the applied load. This temperature drift is due to the phase transformation that happened far away from the wall cell, inside the foam. And as the aluminium foam is not a very good thermal conductor, and the thermometer and heaters were mounted on the outside of the cell, the heat is better transferred through the wall cell than in the foam/nitrogen combination. This way, the temperature measured on the cell drifted over time.
Twente University TSU at 63 K
In order to avoid electromagnetic interferences and vibrations induced by the cryocooler, a TSU was considered to maintain a SQUID (Superconducting Quantum Interference Device) at constant temperature after stopping the cryocooler (Twente University, FHARMON project, NL) [6]. This SQUID requires to be operated below 77 K with maximum variation of about 0.1 K. So, one solution is to use the nitrogen triple point (63.5 K) device.
This system is composed by a TSU connected to a cryocooler by a heat switch. During measurements, the heat switch isolates the TSU from the stopped cryocooler. The power required for the sensor is 0.5 W for 10 hours (18 kJ).
The TSU was built to store 54 kJ (1.5 W for 10 hours). This corresponds to 2.1 kg of nitrogen. Highly porous alumina was used to retain nitrogen liquid against gravity. The dimensions of the TSU are 19 cm of diameter and 22.5 cm in height. A structure of the energy reservoir is shown in Figure 1.11. This structure was made in which layers of copper and porous material alternate, thus establishing a good thermal contact between the nitrogen and the casing of the TSU.
Figure 1.11: Schematic of the Twente TSU [6].
The TSU is connected to a room temperature at a filling/evacuation system of the fluid so it is never subjected to high pressure. Experiments (without heat switch) at different heat loads were carried out. When the applied load is not too high, the temperature drifts very slowly. For example in Figure 1.12, when 2.5 W are applied the temperature drift is about 0.5 K after 6.5 h. During the beginning of the solid melting, the temperature drifts are always very small. At the end of the melting, significant temperature differences can occur in localized points and decrease with the heat loads (less than 2 K with 18 W).The experiments showed that the final TSU capacity was 25 kJ whereas 30 kJ were expected: this energy lack is explained by liquid loss during the filling procedure.
(1) Core of the TSU with alternating layers of copper and porous material;
(2) TSU container; (3) vacuum space;
(4) three stainless-stell support tubes; (5) drainpipe;
(6) Multilayer Insulation supported by a plate attached to the support tubes;
(7) cooler;
Figure 1.12: Temperature evolution of TSU for the 2.5 W adapted from [6].
1.3.2 TSU at 14 K using the hydrogen triple point
Service de basses temperature - CEA recently built a TSU working at the triple point of hydrogen (14 K) and storing 10 J [16]. The TSU is composed by two parts: a copper block with
thin slots (≈ 100μm) and stainless steel cap that fits on the base enclosing an empty volume that will be filled by hydrogen gas (Figure 1.13). To store 10 J, a volume of 22.2 cm3 of liquid hydrogen was required. Slots allow both increased thermal contact between the cell and the fluid and the confinement of the liquid by capillary effect. The liquid trapped in the slots becomes solid after cooling. The liquid and the solid confinement make the cell insensitive to gravitational orientation.
Figure 1.13: The thermal bus (first), complete cold unit (second), Thermal Storage Unit mounted on the second stage of the Gifford Mac Mahon [16].
This TSU was tested in two ways. In the first test, the cell was connected to an expansion volume of 1.9 l at room temperature with 1.2 bar. This cell was maintained at 13.8 K during 100 s storing 10.14 J (100 mW was applied for ≈ 100 s). In these tests, the temperature drifted only 10 mK in 100 s. This temperature drift increases when the applied heat load is higher; with 500 mW applied the drift is 30 mK. A similar behaviour has been verified when the cell unit was working against gravity, i.e the filing port is aligned with gravity, which demonstrates the possibility to use this kind of cell for space missions.
In the second test, an expansion volume at room temperature was used, so it was necessary to fill the cell with 80 bars at room temperature to get the same 10.14 J.
Figure 1.14: Temperature evolution in dual and single volume configuration, with 100 mW of applied thermal load 100 mW [16].
1.4 Dual phase
The ESUs presented in this section use phase transitions such as melting, vaporization, sublimation or crystal structure realignment, for energy storage.
1.4.1 BETSU at 120 K using Solid –Liquid transition of methylpentane
Brilliant Eyes Thermal Storage Unit (BETSU) was developed and flown on the shuttle flight STS-62 in March 1994 [17]. This unit worked at 120 K by melting 35 g of 2 - methylpentane with 3 % acetone added to minimize supercooling effect. The BETSU weight 1.5 kg with 0.9 kg for the aluminium fins matrix. Aluminium fins improve the thermalisation between the container and the phase change material (PCM). The BETSU design satisfies the requirements for its operation, as can be seen in Table 1.3.
Table 1.3: BETSU design requirement [17].
temperature rise. For example, this BETSU weights 7 times less that the lighter SHD, for an allowable temperature rise of 3 K.
Figure 1.15: Weight ratio of metallic sensible heat to phase change device in BETSU, as a function of allowable temperature rise [17].
1.4.2 CTSU at 35 K using Solid-Solid transition of nitrogen
A dual volume Cryogenic Thermal Storage Unit (CTSU) was developed using nitrogen
solid(α)-solid(β) transition at 35 K (latent heat = 9 J/g) and partially tested in shuttle flight STS-95 [18]. The goal was to reduce the power demand on the mechanical cooler and to reduce temperature fluctuation on the cooled element.
This CTSU consists of an aluminium 6063 heat exchanger connected to a storage tank by a capillary tube. The heat exchanger is composed by two drilled-hole 6063 aluminium halves welded together (Figure 1.16). The heat exchanger was installed between the cold finger of a mechanical cooler and the beryllium interface to the payload play. This system was filled with 22.4 bars representing a mass of 630 g of nitrogen, having an energy storage capacity of 5670 J. The TSU was submitted to a heat load fluctuation from 0.7 to 3.7 W and allowed limiting the temperature variation to 0.01 K/min. Figure 1.17 illustrates additional system details.
Figure 1.17: The complete system for the solid N2 TSU[19].
1.4.3 ITSU at 35 K using the Liquid-Vapor transition of neon
The Ball Aerospace and the Redstone Engineering developed a hybrid cooler for cooling infrared imaging systems under variable loads [20]. Hybrid machines consist of a fluid circulation J-T system and a pre-cooling system linked by an Internal Thermal Storage Unit (ITSU) (see Figure 1.18). The circulating fluid is neon, its liquid-vapor transition allowing maintaining the focal plane at 35 K.
Figure 1.18: Schema of the hybrid cooler with an internal Thermal Storage Unit [15].
When the load is applied on the reservoir, liquid neon is evaporated. This gas is recompressed and redirected to the ITSU where it is condensed.When it is necessary to absorb load energy in the tank, liquid of ITSU flows through a Joule Thomson valve that regulates the flow. This way the tank’s temperature is kept constant.
1.4.4 CRYOTSU at 60 K using the Solid –Solid transition of nitrogen trifluoride
A 60 K double volume Cryogenic Thermal Storage Unit called CRYOTSU unit was embarked in October 1998 on STS-95 flight for AFRL customer [3]. It was developed by Swales/AFRL/NASA Goddard to absorb the wide heat load variation during the high peak of the duty cycle while keeping the cryocooler specifications for an average heat load.
Table 1.4: Requirements for the 60 K Thermal Storage Unit [3].
TSU Operating Parameter Performance Requirement
Operating Temperature 55-65 K
Energy Storage Capacity 6000 J
Temperature Stability +/- 0.5 K
Weight < 3.5 kg
Volume < 1500 cc
Focal Plane Heat Load 1-5 W,3 W avg
Focal Plane Interface Material Beryllium
Gravity Environment Functionality 1-G and 0-G
The first material chosen for use in this TSU was the nitrogen trifluoride which undergoes an energetic solid-solid transition (21.3 J/g) at 56.6 K. This material has 2-3 times the energy storage capacity as nitrogen for the same filling pressure.
During this project, two different TSU prototypes were studied to build the flight model. The first TSU built for this work, Figure 1.19, consists of an aluminium block with 176 internal drilled holes (3.2 mm diameter x 57.2 mm) to improve thermalisation [1]. Despite of NF3 being the best solution, experimental tests was performed with other PCM (nitrogen, freon-22, air and nitrogen trifluride). Experimental conditions and results are summarized in Table 1.5.
Figure 1.19: Design of TSU [1].
Table 1.5: Experimental condition for PCM characterization tests [1].
The second built TSU benefits from the experience of the first, improving its performance [3][21][22]. Aiming to increase the energy storage and the thermal stability while reducing the total weight and volume the dual-volume design was adapted. To decrease the supercooling of NF3 one solution is to increase the core surface. So, an aluminium foam core (40 ppi, 40 % relative density) was used as heat exchanger.
spherical storage volume at room temperature is made in titanium and was designed to contain an internal pressure up to 6.9 bars.
Figure 1.20: Schema of Flight CTSU [3].
Despite of this exhaustive on NF3 the final 60 K CTSU uses nitrogen. Nitrogen has a lower heat capacity performance than the solid-solid transition of NF3, but it was preferred for being non-toxic. Such final Figure 1.21 design is composed of a hermetically-sealed, dual-volume, beryllium and large room temperature stainless steel vessel of 16.7 liters that contains nitrogen [23]. The TSU is a beryllium disk of 15 cm, 5 cm height perforated with holes of 2.8 cm of dry mass 1 kg. It has a volume of 140 cm3 and filled at 6.1 bars to hold a 0.118 kg of nitrogen.
The theoretical energy storage capacity of the flight CTSU is 2960 J and allows maintaining the temperature stability at approximately ± 0.25 K. Zero-g environment had no discernible impact on CTSU [24].
Figure 1.21: Photograph of the triple point CTSU with stainless steel vessel [23].
1.4.5 TSU between 4 - 90 K using different fluids
The Special Research & Development Bureau for cryogenic Tecnologies (SR & DB) developed cryocoolers with associate TSU in order to increase lifetime (up to 10-20 years) and temperature stability (± 0.5 K) of their cryogenic cooling systems [4]. In this work, the TSU are
called cold accumulators. These accumulators allowed also the decrease vibration and electromagnetic interference.
Table 1.6: Thermal parameters and lifetime of SR & DB cryocoolers for the 4-90 K temperature range with melting-freezing, evaporation- condensation, and solid-solid transition accumulators [4].
Aiming to develop cryocooler with accumulators for the range of 4 K -150 K the set of fluids with correspondent phase change characteristics are summarized in Table 1.7.
Table 1.7: Some prospective cryogenic accumulator fluids for the 4-150 K temperature range [4].
1.4.6 ESU between 20 K and 80 K using heat capacity of solid water.
To use High Temperature Superconductors (HTS) in magnetically levitated vehicles (maglev), they must stay below 50 K to allow high magnetic field generation. A solution to maintain the HTS between 20 K and 50 K during one full day without using a cryocooler in the vehicle is to attach the magnetic coil to an adequate thermal system able to store the heat released by the HTS coil and by other parasitical heat source [25]. In this temperature range, the relatively high specific heat and thermal conductivity of water ice indicate that its use as storage medium can be a quite good solution. One experimental apparatus was mounted as represented in Figure 1.22. A copper block (9.28 kg) was used to mimic the HTS in a one-third-scale of the on-board magnet for maglev vehicles. Without water ice, the system drifts from 20 K to 50 K in 6 h whereas attaching only 1 kg of solid water allows extending this duration by 2 hours.
Figure 1.22: Schema of the experimental apparatus [25].
1.4.7 ESU between 65 K -80 K using Liquid-Vapor transition of nitrogen
The energy storage units built in CEFITEC (during my master thesis) allow keeping a hypothetical sensor at low temperature in a vibration-free environment while temporarily stopping the cryocooler. This liquid N2 system used the latent heat of the liquid to vapor transformation of nitrogen as main energy absorber.
Figure 1.23: Schema of the experimental set-up [26].
On the top of the enthalpy reservoir was thermalized a thermometer to measure the container temperature as well as a heating resistor to mimick the sensor dissipation.
After condensing nitrogen into the reservoir, the heat switch is used to decouple the cell from the cryocooler cold finger. A constant heating power is applied leading to liquid evaporation along the saturation curve, the ESU mode started. If the enthalpy reservoir containing the cryogenic fluid is closed, this vapor formation would lead to a strong pressure increase: the temperature would rise quite rapidly as long as the liquid and vapor coexist. To reduce this temperature increase, the reservoir was connected by a capillary to an expansion volume at room temperature, limiting the pressure augmentation. The pressure in the expansion volume was measured: as long as liquid and vapor coexist in equilibrium thermodynamic, this pressure can be transformed in temperature by the correspondence P-T on the saturation curve and used to determine the temperature inside the cell (Tliq ).
Using a 6 liters expansion volume filled with 1.95 bar at room temperature, this ESU is able to store up to 3720 J along a 65 K to 83.5 K temperature drift during the ESU mode. Figure 1.24 shows the temperature evolution of the cell with 1 W as constant heating power applied. The red curve displays an artificial drift of the temperature of cold finger. At t ≈ 64 min, the temperature Ttop starts to increase faster indicating that there is no more liquid in the cell, and by the same time, the temperature as measured by the pressure exhibits a plateau as there is no more liquid in the cell.
Figure 1.24: Temperature drift for the liquid N2 ESU mode (1 W applied) starting at T≈ 65 K with a filling
In order to compare experimental temperature drift Tliq(t) with the one expected from the system, a numerical simulation was carried out. Knowing all the volumes of the system and the filling pressure at room temperature, the number of moles in the whole system can be determined. Knowing the density of the fluid at low temperature and the Psat(T) allows us to calculate the number of condensed moles in the liquid phase.
Using the first law of thermodynamics for an open system (the low temperature cell), the necessary heat Q for rising the temperature from Tn to Tn1(temperatures at time t and (t+Δt), respectively), can be calculated as:
(1.1)
which discretizes as:
(1.2)
In this expression, the term QTn1,TnQt represents the heat entering into the system between Tn(t) and Tn+1(t+Δt) due to the applied Joule heating; this energy is called accessible energy. Qpara(Tn+1,Tn) is the parasitical energy received by the system due to the temperature difference between the cell and the cold finger through the stainless steel support of the switch (OFF state) and due to radiation (a rather pessimistic value of 0.5 for emissivity was used in calculating the form factor for two concentric cylinders). The sum of accessible energy and parasitical energy is called the experimental energy. Ucell is the total internal energy of the
working fluid (liquid and vapor) existing in the cell, hvapor is the molar enthalpy of the vapor and
n is the molar amount of fluid in the cell; Ccell is the total heat capacity of the cell housing. The value of Tn+1, after each increment can be calculated and the T(t) drift entirely determined using the initial conditions as unique parameters.
These iterative calculations were made using a programmed worksheet and software was written in Java. The calculated temperature drift is plotted in Figure 1.24 (Tcalc-solid symbols) for a charge pressure of 1.95 bar in the 6 liters expansion volume. The theoretical energy and experimental energy results agree within 5 % and are discussed in the literature [26]. The main inconvenient of this ESU is the temperature drift that still exists while the heating power is absorbed.
1.5 Conclusion
A bibliographic review of existent systems constructed to accumulate thermal energy for different cryogenic applications in order to reduce the temperature drift has been presented:
The solid state ESUs uses high heat capacity to limit the temperature rise and are limited to relatively high temperature as specific heat of material decreases with temperature or near a specific heat anomaly (mainly due to a magnetic phase transition) at low temperature.
The triple point ESUs absorbs a heat input maintaining a constant temperature as long as the three phases coexist. Systems were presented in two configurations: simple and dual volume. The dual volume is used in order to decrease the filling pressure and the thickness of the cell walls. Such ESUs are limited to temperature where a triple point can be found.
![Table 1.1: Comparison between single volume and dual volume system [2]. “ PCM ” stands for Phase Change Material](https://thumb-eu.123doks.com/thumbv2/123dok_br/16544906.736893/32.892.134.749.666.920/table-comparison-single-volume-volume-stands-change-material.webp)
![Figure 1.8: J-T stage peak cooling power capacity for the JT with TSU placed in the high and low pressure lines [14]](https://thumb-eu.123doks.com/thumbv2/123dok_br/16544906.736893/37.892.222.702.132.415/figure-stage-cooling-power-capacity-placed-pressure-lines.webp)
![Figure 1.14: Temperature evolution in dual and single volume configuration, with 100 mW of applied thermal load 100 mW [16]](https://thumb-eu.123doks.com/thumbv2/123dok_br/16544906.736893/41.892.242.666.112.396/figure-temperature-evolution-single-volume-configuration-applied-thermal.webp)
![Figure 1.15: Weight ratio of metallic sensible heat to phase change device in BETSU, as a function of allowable temperature rise [17]](https://thumb-eu.123doks.com/thumbv2/123dok_br/16544906.736893/42.892.237.645.174.461/figure-weight-metallic-sensible-change-function-allowable-temperature.webp)
![Figure 1.18: Schema of the hybrid cooler with an internal Thermal Storage Unit [15].](https://thumb-eu.123doks.com/thumbv2/123dok_br/16544906.736893/43.892.242.631.541.858/figure-schema-hybrid-cooler-internal-thermal-storage-unit.webp)