The useful life of concrete is associated with the penetrative ability of aggressive agents on their structures. Structural parameters such as poros-ity, pore distribution and connectivity have great inluence on the properties of mass transport in porous solids. In the present study, the effect of varying the workability of concrete in fresh state, produced through the use of additives, on pore structure and on the mechanical compressive strength of hardened concrete was assessed. The pore structure was analyzed with the aid of X-ray microtomography, and the results obtained were compared to the total pore volume calculated from data derived from helium and mercury pycnometry tests. A good approximation between the porosity values obtained through the two techniques was observed, and it was found that, regardless of concrete consistency, the samples from the surface of the specimens showed a percentage of pores higher than those taken from the more inner layers.
Keywords: concrete, workability, porosity, X-ray microtomography.
A vida útil dos concretos está associada à capacidade de penetração de agentes agressivos em suas estruturas. Parâmetros estruturais como porosidade, distribuição e conectividade de poros têm grande inluência nas propriedades de transporte de massa em sólidos porosos. No pre -sente estudo avaliou-se o efeito da variação da trabalhabilidade do concreto no estado fresco, produzida pelo uso de aditivos, na estrutura de poros e na resistência mecânica à compressão do concreto endurecido. A estrutura de poros foi analisada com o auxílio de um microtomógrafo de raios X, e os resultados obtidos foram comparados com o volume total de poros calculados a partir de dados provenientes de ensaios de pic-nometrias de hélio e mercúrio. Observou-se boa aproximação entre os valores de porosidade obtidos pelas duas técnicas, tendo-se constatado que, independente da consistência do concreto, as amostras provenientes da superfície dos corpos de prova apresentaram um percentual de poros superior do que aquelas retiradas de camadas mais internas.
Palavras-chave: concreto, trabalhabilidade, porosidade, microtomograia de raios X.
Evaluation of the effect of varying the workability in
concrete pore structure by using X-ray microtomography
Avaliação do efeito da variação da trabalhabilidade
na estrutura de poros do concreto pelo uso da
microtomograia de raios X
E. E. BERNARDES a elenbernardes@gmail.com
A. G. DE MAGALHÃES a aldom@ufmg.br
W. L. VASCONCELOS b wlv@demet.br
E. H. M. NUNES b eduardohmn@yahoo.com.br
a Universidade Federal de Minas Gerais, Department of Materials Engineering and Construction, Belo Horizonte, MG, Brasil 31270-901 b Universidade Federal de Minas Gerais, Department of Metallurgy and Materials Engineering, Belo Horizonte, MG, Brasil 31270-901
Abstract
1. Introduction
In the study of concrete microstructure, porosity is particularly important in that it inluences many of its properties, such as hardness, modulus of elasticity, compressive strength and per-meability [1, 2].
The pore distribution system of concrete is strongly inluenced by its production factors, such as dosage [3] and cure. The ininite variations in the productive process impede the creation of precise models to predict their behavior.
There are many consolidated techniques for the measurement and characterization of pore structure, such as mercury intrusion porosimetry (MIP), nitrogen adsorption and scanning electron mi-croscopy (SEM). However, the use of these techniques in isolation is not capable of promoting a more accurate understanding of this structure [2, 4]. Besides this, each technique has its associated er-ror, its analysis range and sample preparation standard, and these variables can become a complicating factor in the analysis and comparison of results. In this sense, the use of X-ray microtomog-raphy (μ-CT) has contributed by facilitating the study of the pore structure of materials
The μ-CT is an imaging technique that allows for the gathering of three-dimensional data on the internal microstructure of materials (such as density, pore structure and porosity), which does not re-quire the special preparation of samples. Although its creation and use are not recent, [5] it was only in the last decade that studies involving its application in the investigation of the pore structure of cementitious materials began to be released [1, 2, 4, 6, 7]. This study aimed to verify the effect of the variation of concrete workability in fresh state, produced by the use of additives, in the
pore structure and mechanical compressive strength of hardened concrete. In the investigation of pore structure, the X-ray microto-mography (μ-CT) technique was used. In order to compare results, the porosity of the concretes were also calculated through the ratio between bulk density, obtained by mercury pycnometry, and solid fraction density, obtained through the pycnometry test with helium gas [8, 9].
Two concrete mixtures were produced, named concrete Type 1 and Type 2, and were designed to achieve different workabilities through the respective use of plasticizing additives based on
modi-Table 1 – Properties of CP III 40 cement used
Property
Values
Residue in the Screen ABNT 200 (%)
2
Blaine specific surface (cm /g)
3
True specific mass (g/cm )
Water of normal consistency (%)
Time to start of hardening (hours)
Time to end of hardening (hours)
Loss on ignition (%)
Sulphuric anhydride – SO (%)
3Insoluble residue (%)
Compressive strength - 3 days (MPa)
Compressive strength - 7 days (MPa)
Compressive strength - 28 days (MPa)
0.35
4,700
2.98
32.8
3.12
4.75
3.8
2.5
0.8
23.4
35.2
49.0
Table 2 – Granulometry of aggregates used
Fine aggregate
modiied hydroxycarboxylic compounds. For the production of the Type 2 concrete, a plasticizer based on poly naphthalene sulfonate was used.
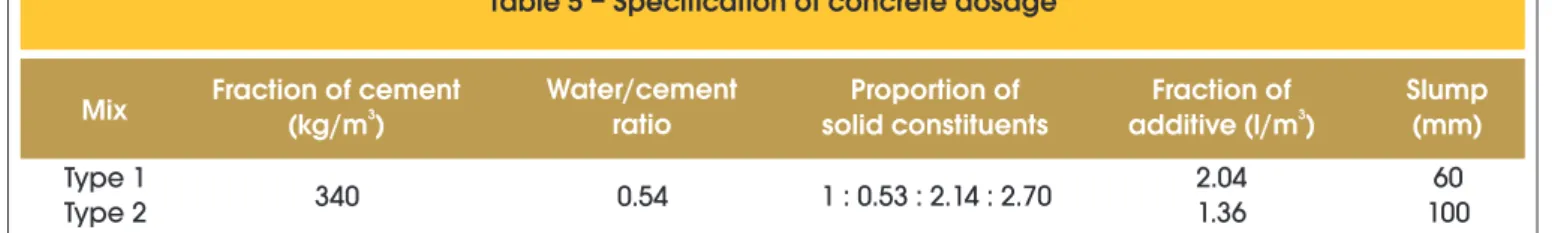
2.5 Proportioning of concrete
For the dosing of speciic Type 1 and Type 2 concretes, a similar dosing was determined, differentiated only by the type and quantity of plasticizer additive used to attribute the different workabilities. The additive dosage used in each proportion was enough to confer a reduction of 60 mm for Type 1 concrete and 100 mm for Type 2 concrete (ASTM C 143).
The speciic concrete proportions produced are described in Table 5, where the weight ratio of solid components is presented in the format cement/iller/sand/gravel.
2.6 Molding and curing of specimens
A total of 14 cylindrical specimens (100 x 200) mm were made, with 8 test specimens being produced with Type 1 concrete and 6 test specimens with Type 2 concrete, whose respective de-forming was done 48 and 24 hours after casting. The deliber-ate demoulding of the Type 1 concrete required 48 hours to be performed because the additive used delayed the hardening of the material.
After the demoulding, 6 test specimens of each type of concrete were kept in a moist chamber (wet cure), with temperature con-trolled at 23 ± 2 ºC and relative humidity (RH) greater than 95%, until the moment of mechanical testing of compressive strength. These 2 remaining test specimens of Type 1 concrete were kept in a moist chamber for a period of 24 hours, before being sub-merged in fresh water (subsub-merged cure) until they completed 28 days.
ied hydroxycarboxylic compounds and sulfonated polinaftaleno, while maintaining the same proportions of the constituent solids and water/cement ratio (w/c). Both concretes were cured in a moist chamber until rupture. Type 1 concrete was also subjected to cur-ing submerged in fresh water, in order to examine the eficacy of curing in a moist chamber.
2. Materials and experimental program
2.1 Cement
For the proportioning of concrete, a Brazilian cement was used with the addition of blast furnace slag (CP III 40), whose technical speciications are described in the Brazilian standard NBR 5735 [10]. Its main physical, chemical and mechanical properties are presented in Table 1.
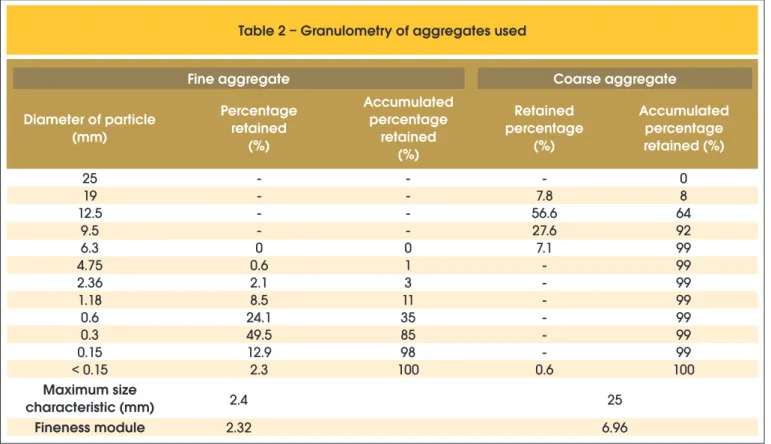
2.2 Aggregates
The ine aggregate used was natural quartz sand, and the coarse aggregate was obtained by the crushing of calcite rocks.
The results of the particle size tests and characterization of aggre-gates can be seen in Tables 2 and 3, respectively.
2.3 Filler
Limestone iller was used with maximum particle size passing through a sieve with a mesh of 44 µm. Table 4 shows the main physical and chemical properties of the limestone iller used in this study.
2.4 Chemical additives
The Type 1 concrete was prepared by use of a plasticizer based on
Table 3 – Characterization of aggregates used
Property
Aggregate
Fine
Coarse
3Specific mass (g/cm )
3Unit mass (g/cm )
Sprayed material (%)
Rate of Clay in lumps (%)
Organic impurity (ppm)
2.6
1.3
0.4
0.1
< 300
2.7
1.4
0.5
-Table 5 – Specification of concrete dosage
Mix
Fraction of cement
(kg/m )
3Water/cement
ratio
solid constituents
Proportion of
additive (l/m )
Fraction of
3Slump
(mm)
Type 1
Type 2
2.04
1.36
60
100
340
0.54
1 : 0.53 : 2.14 : 2.70
Table 4 – Properties of limestone filler used
Property
Value
2
Blaine specific surface (cm /g)
3
Specific mass (g/cm )
Mean particle diameter (µm)
Calcium oxides – CaO (%)
Loss on ignition – PCC (%)
Other oxides (%)
3,095
2.73
period of 3 hours, before being divided into fractions of approxi-mately 3 grams.
After being weighed on an analytical balance, the fractionated ma-terial was transferred to the sample compartment of the equipment where it underwent a process of degassing by repeated purging with helium to remove any impurities present. Next, there were ive consecutive readings of pressure, which were recorded in the measuring chamber before and after gas expansion. Using these values, the actual density was calculated with its respective error, obtained by the standard deviation of the readings.
Mercury pycnometry
For each situation analysis, a sample of about 6g was obtained from the quartering of 96 g fragments extracted from the surface and inner layers of the specimen, in a proportion close to 50%. The samples were kept in an incubator at 80 °C for a period of 3 hours. The test was performed using a glass volumetric lask with a ca -pacity of 25 ml. The volume of liquid displaced after immersion of the sample in the lask illed with mercury was measured and then the volumetric density of each sample analyzed was calculated [8, 9], with the error being calculated from the standard deviation of ive consecutive weighings of the sample, empty receptacle, re -ceptacle illed with Hg, and re-ceptacle with Hg - sample introduced.
X-ray microtomography
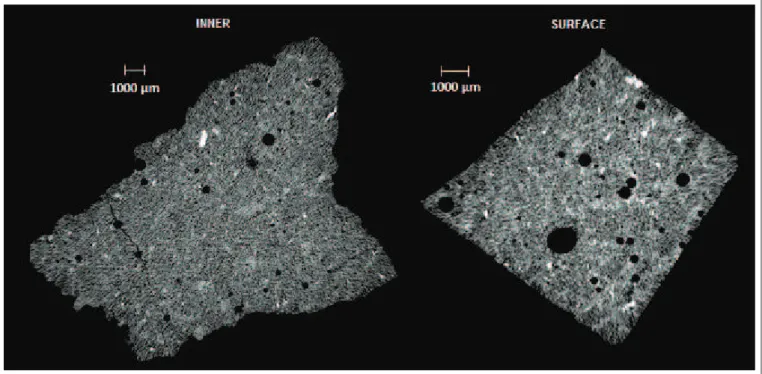
To carry out readings in the SkyScan 1172 microtomograph, one fragment of mortar from the surface was selected with the other coming from the inner layers of each specimen analyzed. Because this technique is based on obtaining two-dimensional projections of the analyzed object while it is rotated, the selection of fragments of more regular geometry was deemed appropriate.
Each fragment was positioned in the sample compartment of the equipment and ixed with modeling clay. The samples in -vestigated were rotated at angles up to 180°, adopting a step
2.7 Characterization tests of the concretes
Compressive strength
Compression tests were performed on pairs of specimens at ages 7, 14 and 28 days for test specimens that underwent moist curing, and at 28 days for the 2 test specimens that were submitted to sub-merged curing. The tests were conducted with a constant loading rate of (0.45 ± 0.15) MPa/s, and the compressive strength results were obtained within an experimental error of 5%.
Obtaining samples
The characterization of pore structure, by X-ray microtomography (μ-CT) and helium and mercury pycnometry was performed on samples taken from specimens aged 28 days [9, 11, 12], cured in a moist chamber and by submersion in fresh water. The samples were extracted from the specimen with the highest mechanical compressive strength.
To obtain the samples, each sample was cut transversally, with the aid of a circular saw, so as to obtain slices about 1 cm thick, discarding the irst 2 inches of each end. Fragments of mortar, with average size between 0.5 cm and 1.0 cm, were collected from the surface and the internal region of the specimen slic-es. This slicing procedure was necessary to facilitate the selec-tive extraction of fragments.
Helium pycnometry
The actual density of the investigated material was obtained by he-lium pycnometry [8, 9] in Quantachrome equipment model MVP-1. For each analysis situation, the sample was prepared from 70 grams of fragments from the surface and inner layers of the speci-men, in a proportion close to 50%. The material was sprayed in a pot mill to obtain a particle size less than 75 µm. After the
com-minution stage, each sample was kept in an oven at 80 °C for a
Table 6 – Compressive strength of concrete analyzed
Age
Compressive strength (MPa)
(days)
Type 1 – Moist cure
Type 1 – Submerged cure
Type 2 – Moist cure
7
14
28
26.9
37.2
46.5
–
–
47.0
24.4
37.6
46.0
Table 7 – Results obtained from helium and mercury pycnometry tests
3
Density (g/cm )
Concrete
Porosity (%)
Actual
Volume
Type 1 – moist cure
Type 1 – submerged cure
Type 2 – moist cure
24 ± 1
23 ± 2
19 ± 1
2.66 ± 0.04
2.57 ± 0.05
2.58 ± 0.03
of 0.40°. Through the projections acquired and the Nrecon and CTAn software the morphological parameters were obtained, as well as the three-dimensional representation of the structures scanned. To calculate the mean porosity of the materials stud-ied, one hundred two-dimensional sections throughout the vol-ume analyzed were considered.
3. Results
3.1 Compressive strength
Table 6 presents the compressive strength results of the test spec-imens for different analysis situations proposed.
It is noted that the variation in concrete consistency (Type 1 and Type 2) did not affect the compressive strength of the speci-mens. The same is veriied for specimens subjected to moist and submerged curing of Type 1 concrete.
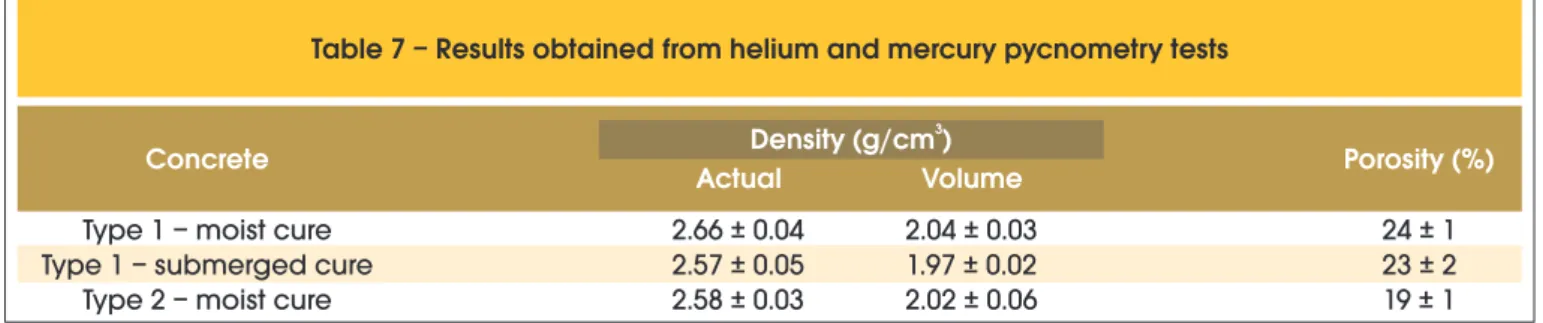
3.2 Helium and mercury pycnometry
Table 7 shows the true density, bulk density and porosities of the samples analyzed.
The porosity results for the different processes of Type 1 concrete curing presented very close values. Type 2 concrete, submitted to moist cure, had lower porosity than Type 1 concrete with the same curing conditions.
As the samples are composed of fragments from both the surface and inner layers of the specimens, the data obtained provide an overall average for the material studied.
3.3 X-ray microtomography
Table 8 shows the porosity results for the internal and outer con-crete samples analyzed as well as the mean of these results.
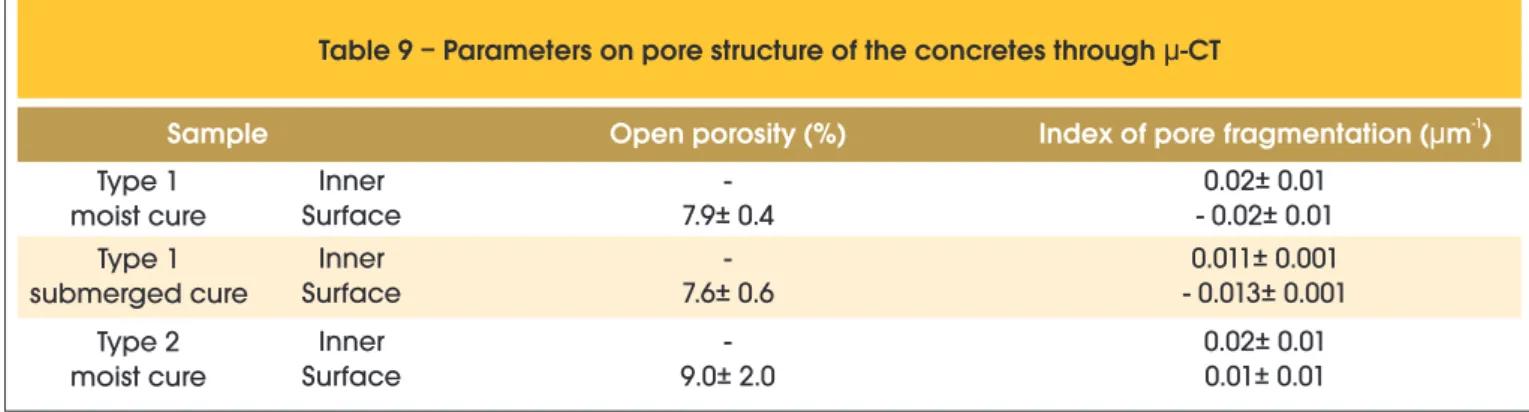
Analysis by µ-CT showed very close average porosity percentages for the two Type 1 concrete curing processes, and a lower percent-age for Type 2 concrete. In isolated analysis, the samples extract-ed from the surface of the specimens showextract-ed considerably higher porosity than the samples removed from inside the test specimens. Table 9 presents two parameters, on the pore structure of the ma-terials analyzed, generated by μ-CT.
The open pores directly affect the permeability of luids in the ma -terial, while its mechanical strength is inluenced by the open and closed pores [13]. In the analysis of open porosity, the readings obtained for the internal samples were discarded, since pores that were initially closed could have opened during the fragmen-tation of the material, but they would not effectively contribute to system permeability.
For samples taken from the surface of the specimens, results show that Type 2 concrete had an open porosity percentage slightly higher than Type 1 concrete, both being submitted to moist curing. For the two Type 1 concrete curing types, values were quite close. Fragmentation is characterized by the breakdown of connectivity. The more negative the fragmentation rate (IF) the greater pore connectivity will be, favoring system permeability.
The porosity, open porosity and fragmentation rate of the samples analyzed were obtained by means of image processing performed by Nrecon and CTAn software.
Comparing the results of Type 1 and Type 2 concretes, submitted to moist cure, only the surface sample varied, with Type 1 concrete show-ing greater pore connectivity. For the different Type 1 concrete curshow-ing processes, there is greater connectivity for the surface samples. Apart from the quantitative results, the technique provides for a qualitative analysis of pore structure by observation of the gener-ated images.
The tomographic process consists of rotating the specimen at equal angles until completing a 180º or 360º turn while it is sub-jected to a beam of X-rays. At each step, various frames are
cap-Table 8 – Porosity of pore structure of the concretes through µ-CT
Porosity (%)
Sample
Type 1 – Moist cure
Type 1 – Submerged cure
Type 2 – Moist cure
Inner
Surface
Mean value
16.0 ± 0.5
32.8 ± 0.4
24.4 ± 0.9
18.6 ± 0.8
33.2 ± 0.6
26.0 ± 1
15.0 ± 0.4
25.0 ± 1
20.0 ± 1
Table 9 – Parameters on pore structure of the concretes through µ-CT
Sample
Open porosity (%)
Index of pore fragmentation (µm )
-1Type 1
submerged cure
Type 1
moist cure
Type 2
moist cure
Inner
Surface
Inner
Surface
Inner
Surface
-7.9± 0.4
-9.0± 2.0
-7.6± 0.6
0.02± 0.01
- 0.02± 0.01
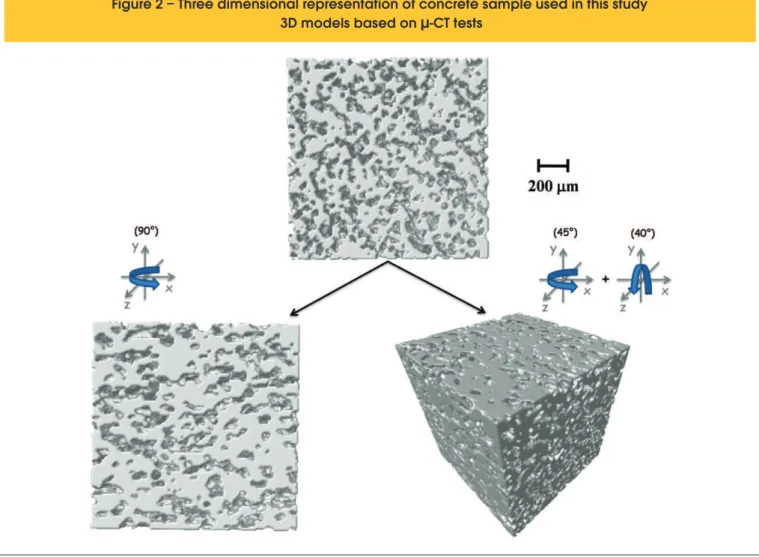
tured to inally generate an image. After this capturing, the images are reconstructed so that they may be viewed in 3D [14]. Figure 1 shows recent clips of two-dimensional projections obtained from the internal and external samples of the Type 1 concrete, where it is possible to see that the image generated from the external sample has larger pores than those from the internal sample. The computerized microtomography creates a complete recon-struction of the sample in the form of a 3D image from the 2D stacking sessions [15]. These, in turn, are obtained through a re-construction algorithm applied to the projections taken from the sample [14]. For three-dimensional reconstruction and obtainment of data on the microstructure, speciic image processing software is used, which is able to calculate diverse morphometric parame-ters, such as those presented. Figure 2 shows a three-dimensional reconstruction of one of the concrete samples.
4. Discussions
The sampling method applied to pycnometry tests provided poros-ity results that characterize a global average for the specimen ana-lyzed. In contrast, the method applied to microtomography testing promoted an isolated analysis of surface and inner layer porosity of the test specimens.
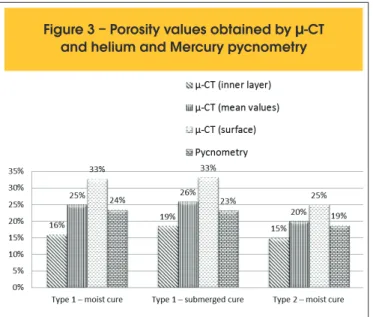
Comparing the global porosity results provided by pycnometry with the mean from the microtomography results, some proximity of val-ues was noted, as shown in Figure 3
This proximity shows a good correlation between the two tech-niques. In this way, in order to determine porosity, the helium and mercury porosity pycnometry may be used along with the µ-CT for results validation.
The two techniques demonstrated a lower mean porosity for Type 2 concrete, compared to Type 1 concrete, both subjected to moist curing. However, porosity results for the inner layers of the two concretes, obtained by µ-CT, fall within the same value range, Therefore, the variation of mean porosity had a higher value for Type 1 concrete due to a more pronounced porosity of the test specimen surface layer.
Apparently, the difference in consistency of Type 1 and Type 2 concretes inluenced the surface porosity of the specimens, with no large variations in the internal porosity and mechanical strength results. The fact that the concrete’s mechanical strength is signii -cantly affected by the porosity of the internal structure [16] helps to explain the reason why the difference in concrete porosity did not have an impact on results obtained for specimen compressive strength, since lower values are normally expected for more po-rous concretes.
The two techniques also provided percentages very close to mean porosity for the different processes of Type 1 concrete curing. The µ-CT demonstrated proximity of values for the surface porosity of concrete submitted to moist and submerged cure.
Determining the total porosity of the materials is not enough to evaluate the level of system absorption, since this porosity also covers isolated pores, without inter-connectivity, which do not contribute to external agents penetrating the inner mass. There-fore, it is important to jointly evaluate the connectivity parameters and percentage of open porosity, both provided by the µ-CT. An example of this is the surface sample of the Type 2 concrete which, despite having mean porosity lower than that of the Type 1 concrete, had a higher percentage of open pores, however with lesser connectivity.
Nevertheless, for a better evaluation of the permeability and ab-sorption level of the system, further testing for these speciic pur -poses would be recommended.
5. Conclusions
It was veriied that the compressive strength of concrete was not affected by the workability difference conferred on the material by the addition of plasticizing additives. However, this plasticity differ-ence produced variations in the porosity of the hardened concrete, as was shown by the pycnometry and X-ray microtomography testing. The greater plasticity, conferred on the Type 2 concrete, may have contributed to better material densiication, with a con -sequent reduction in porosity.
There was a good approximation of porosity results obtained from helium and mercury pycnometry when compared to those obtained by µ-CT. Therefore, for the sampling methodology adopted, the use of two techniques together was preferred as a form of validat-ing results.
The differentiation of the curing process applied to Type 1 concrete did not have a signiicant inluence on the compressive strength of the specimens at the age of 28 days. The same was observed for porosity.
According to µ-CT analyses, it was found that the porosity of the inner layers of Type 1 and Type 2 concrete had very close values and the porosity of the surface layer was greater for the Type 1 concrete. For both concretes studies, the samples extracted from the surface of the specimens showed greater porosity than those from the inner layers. Despite Type 2 concrete having an open porosity percentage a little higher than that of Type 1 concrete, its pore connectivity is much lower, which indicates that Type 2 concrete could be less susceptible to the penetration of external agents, resulting in greater material durability. However, supple-mentary testing would be needed to prove this theory.
6. References
[01] U. Rattanasak, K. Kendall, Pore structure of
cement/pozzolan composites by X-ray microtomography, Cement and Concrete Research 35 (4) (2005) 637-640. [02] S. Lu, E.N. Landis, D.T. Keane, X-ray
microtomographic studies of pore structure and permeability in Portland cement concrete, Materials and Structures 39 (6) (2006) 611-620.
[03] D.-J. Sun, K. Sisomphon, M.-H. Zhang, Effect of super plasticisers on adsorption, rate of cement hydration,
and pore structure of cement pastes, Advances in Cement Research 21 (4) (2009) 159-167.
[04] M.A.B. Promentilla, T. Sugiyama, T. Hitomi, N. Takeda, Characterizing the 3D pore structure of hardened cement paste with synchrotron microtomography, Journal of Advanced Concrete Technology 6 (2) (2008) 273-286. [05] B.P. Flannery, H.W. Deckman , K.L. D’Amico,
Three-dimensional X-ray microtomography, Science 237 (1987) 1439-1444.
[06] E. Gallucci, K. Scrivener, A. Groso, M. Stampanoni, G. Margaritondo, 3D experimental investigation of the microstructure of cement pastes using synchrotron X-ray microtomography (μCT), Cement and Concrete Research 37 (3) (2007) 360-368.
[07] N. Burlion, D. Bernard, D. Chen, X-ray microtomography: Application to microstructure analysis of a cementitious material during leaching process, Cement and Concrete Research 36 (2) (2006) 346-357.
[08] ALIGIZAKI, Kalliopi K, Pore structure of cement-based materials: testing interprepation and requirements. Modern concrete technology series; v 12. London; New York Taylor & Francis, 2006.
[09] MAGALHÃES, A.G. Caracterização e análise macro e microestrutural de concretos fabricados com cimento contendo escórias de alto-forno. Tese de doutorado. Departamento de estruturas, UFMG. Belo Horizonte, 2007.
[10] ASSOCIAÇÃO BRASILEIRA DE NORMAS TÉCNICAS. Cimento Portland de Alto-forno - NBR 5735, Rio de Janeiro, 1991.
[11] RIGO DA SILVA, C.A. Desenvolvimento e Aplicação de uma Metodologia para Caracterização e Análise Estrutural de Concretos de Cimento Portland. Tese de Doutorado. Departamento de Engenharia Metalúrgica e de Minas – Escola de Engenharia da UFMG. Belo Horizonte, Brasil, 1998.
[12] ARANHA, N. et al. Projeto e Construção de um Picnômetro a Ar para Caracterização de Insumos e Produtos Farmaceuticos.Quimica Nova, v. l.33, nº 6,1384-1388, 2010. ISSN 1678-7064 On-Line.
Figure 3 – Porosity values obtained by
µ
-CT
and helium and Mercury pycnometry
em 06/06/2011).
[13] P. Colombo, In praise of pores, Science 322 (2008) 381-383.
[14] APPOLONI, C.R. et al., Caracterização de Materiais Porosos Através da Microtomograia Computadorizada 3D. ARC. Revista Brasileira de Arqueometria Restauração Conservação. Edição Especial. Nº 1. Março 2006. AERPA Editora. Resumo do III Simpósio de Técnicas Avançadas em Conservação de Bens Culturais – Olinda 2006.
[15] LIMA, I.C.B., Caracterização de estruturas internas ósseas através das técnicas de microtomograia computadorizada tridimensional e luorescência de raios X. Tese de doutorado. COPPE/UFRJ. Rio de
Janeiro 2006.