Article
Printed in Brazil - ©2018 Sociedade Brasileira de Química*e-mail: [email protected]
#Both authors contributed equally to this work.
Investigation of Low-Temperature Selective Catalytic Reduction of NO
xwith
Ammonia over Mn-Modified Fe
2O
3/AC Catalysts
Jiuyu Chen,a,# Baozhong Zhu,a,# Yunlan Sun,*,a,b Shoulai Yin,a Zicheng Zhua and
Jiaxin Lia
aSchool of Energy and Environment and
bKey Laboratory of Metallurgical Emission Reduction & Resources Recycling,
Ministry of Education, Anhui University of Technology, 243002 Maanshan, Anhui, PR China
A series of iron-based catalysts supported on activated carbon (AC) and manganese-modified Fe2O3/AC catalysts with various Fe:Mn ratios were prepared for selective catalytic reduction (SCR) of NO by ammonia at low temperature. It was found that the addition of a small amount of MnOx into the Fe2O3/AC catalyst contributed to an improvement of the NO conversion. NO conversions of approximately 100% were obtained for the 10FexMn/AC (x = 1, 3, 5) catalysts at 180-240 °C. The characterization results indicate that the addition of a certain amount of MnOx into the 10Fe/AC catalyst increased the dispersion of the amorphous state, increased the ratios of Fe3+/(Fe3+ + Fe2+) and Mn4+/Mn3+, and improved the surface area and pore volume.
Keywords: Fe2O3/AC, manganese oxide, NH3-SCR, NO conversion
Introduction
Nitrogen oxides (NOx) are an important part of
atmospheric pollution and are harmful to the environment as well as to human health.1 NO
x can cause the formation of photochemical smog, acid rain and ozone depletion.2 Several methods have been used to control NOx emissions, such as selective catalytic reduction (SCR),3,4 the use of some absorbents (i.e. FeII-EDTA),2,5 plasma catalysis,6 and selective catalytic oxidation (SCO).7 Particularly, the SCR of NOx with NH3 is currently the most effective and commercialized way to realize the abatement of NOx from power plants.8-10 In coal-fired power plants, the SCR reactor is installed upstream of the electrostatic precipitator and flue-gas desulfurization scrubber, so the catalyst suffers from deactivation due to dust accumulation and sulfur chemical poisoning. To solve these problems, the SCR reactor should be set downstream of the electrostatic precipitator and flue gas desulfurization scrubber. However, the temperature of flue gas is only approximately 200 °C. For conventional SCR catalysts, such as the V2O5-WO3/TiO2 catalyst,10,11 the optimum operation temperature is usually approximately 300 to 400 °C. One better method to solve
this problem is to develop a suitable low-temperature SCR catalyst.
In recent years, many studies have focused on low-temperature SCR catalysts. Transition metal oxides are often used as active components of catalysts, such as MnOx,12,13 VOx,14 Co3O4,15 CuOx,16 and FeOx.17 It was reported that the oxides of Mn and Fe have good redox properties and oxygen storage capacities due to their changeable valences, low cost and lack of toxicity, especially for outstanding low-temperature SCR activity.18,19 Peña et al.20 revealed that NO conversion on Mn/TiO2 catalysts was approximately 100% at 140 °C, and the selectivity of N2 was excellent at 120 °C. Zhu et al.17 prepared a series of Fe-Mn/TiO
2 catalysts with holmium (Ho) and found that Fe0.3Ho0.1Mn0.4/TiO2 catalysts with a molar ratio of 1:10 (Ho:Ti) had the highest low-temperature SCR activity among these catalysts, and NOx conversion was 90% when temperatures were in the range of 120 to 200 °C.
use as a support for catalysts in the low-temperature NH3 -SCR reaction. Li et al.25 reported that the catalyst with a Cr/sargassum-based activated carbon (SAC) mass ratio of 0.02:1 exhibited the best NOx-removing performance and the NOx conversion is greater than 90% at 125-150 °C. Yang et al.9 found that the addition of a small amount of vanadium oxide into a Fe2O3/AC catalyst contributed to the best activities for the low-temperature NH3-SCR of NO. However, few studies have involved FeOx/ACover Mn-modified catalysts for the low-temperature NH3-SCR of NO. In this paper, a series of Fe2O3/AC and Mn-modified Fe2O3/AC catalysts were prepared by an impregnation method to investigate the effect of different contents of Mn and Fe on the low-temperature NH3-SCR of NO. The properties of the catalysts were characterized by isothermal N2 adsorption/desorption (Brunauer-Emmett-Teller (BET)), X-ray fluorescence (XRF), X-ray diffraction (XRD), X-ray photoelectron spectroscopy (XPS) and temperature program reduction (H2-TPR).
Experimental
Catalyst preparation
Fe2O3/AC and Mn-modified Fe2O3/AC catalysts were prepared by an impregnation method using AC as the carrier and ferric nitrate (Fe(NO3)3·9H2O) as the metal precursor. First, AC was washed with deionized water and dried for 6 h at 105 °C. Then, the AC was ground and sieved to obtain particles of 40-100 mesh. The impregnation process to obtain different masses of Fe-based catalysts was carried out as follows. A certain amount of ferric nitrate was dissolved into deionized water to form a solution. Then, AC was added to the solution. After stirring for 3 h, the mixtures were dried for 6 h at 105 °C and then calcined at 400 °C for 5 h.
Meanwhile, Mn-modified Fe2O3/AC catalysts were prepared by the same method as described above. Briefly, the pretreated AC was impregnated in solution, which involved the required amount of iron nitrate and manganese nitrate (Mn(NO3)2·6H2O). The mixtures were stirred for 3 h at 25 °C, then dried for 6 h at 105 °C and calcined at 400 °C for 5 h in air. The catalysts are identified as 10FexMn/AC, where x represents the molar ratio of Mn and Fe, and 10 indicates the mole percent of Fe and AC.
Catalyst characterization
The surface areas and pore characterizations of these catalysts were determined by a Gold App V-Sorb 2800 analyzer (Gold App, China). Prior to BET measurement,
all catalysts were dried for 6 h at 105 °C and then degassed under vacuum at 180 °C for 12 h. The specific surface areas were calculated by the BET equation.
XRF measurements were carried out on an ARL Advant’ X Intellipower 3600 (Thermo Scientific Niton TM, USA). The operating voltage and current were 60 kV and 60 mA, respectively. The spectrometer test environment was vacuum.
XRD measurements were carried out with a Rigaku Ultima IV powder diffractometer (Rigaku Ultima, Japan) using Cu Kα radiation as a source to examine the crystallinity and dispersity of the components on the support. The scanning range (2θ) was 10-80°, and the scanning rate was 0.02° s-1. The operating voltage was 40 kV, and the applied current was 40 mA.
H2-TPR measurements were carried out on a TP5080 automatic adsorption instrument (Xianquan, Tianjin). A calcined catalyst was placed into the reactor, dried at 300 °C for 1 h and cooled to 100 °C in a flow of Ar. Then, a flow of 500 ppm H2/Ar replaced the Ar flow at a rate of 30 mL min-1 for 30 min to adsorb H
2. Ar was purged for 1 h, and after the baseline stabilized, the temperature was controlled between 100 and 600 °C at a heating rate of 10 °C min-1. The thermal conductivity detector (TCD) signal was monitored online 10 times per second.
XPS analysis was conducted on an Escalab 250Xi X-ray electron spectrometer (Thermo Scientific, USA) with an Al Kα X-ray source. The binding energy (BE) of Fe2p and Mn2p were calibrated using the C 1s peak (BE = 284.6 eV) as a standard.
Active test of the catalyst
The measurement of catalytic activity was carried out in a fixed-bed reactor, as shown in Figure 1. The simulated flue gas components included 5 vol% O2, 500 ppm NO, 500 ppm NH3 and N2 as balance at 120-240 °C. They were controlled by a mass flow rate controller. The simulated flue gas was mixed in a mixer, then heated in a preheater by the electric heating system. At last, it entered the reactor to reaction. The total flow rate was kept at 100 mL min-1, and the space velocity was 6000 h-1. The catalytic particle size was 40-100 mesh. In each test, 300 mg catalyst was packed in a quartz tube, which was positioned in the middle of the fixed-bed reactor. The concentration of NO in the inlet and outlet was analyzed by a ECOM-J2KN multi-function flue gas analyzer (Germany). The conversion of NO was calculated according to the following equation 1:
where NOconversion was the NO conversion, and NOin and NOout were the concentrations of NO at the inlet and outlet of the reactor, respectively.
Results and Discussion
Catalytic performance
SCR activity of Fe2O3/AC catalysts
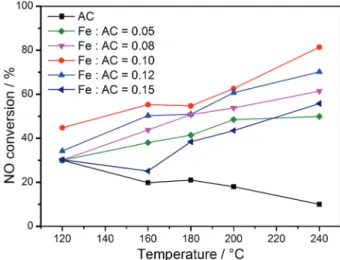
The NH3-SCR of NO over AC with different Fe loadings was carried out in a fixed-bed reaction system between 120 and 240 °C. The results are shown in Figure 2. Temperature has a significant influence on the catalytic activity: the activity of AC decreases as temperature increases. However, the catalytic activity of AC with catalysts containing different Fe loadings increases with an increase of the reaction temperature, especially between 180 and 240 °C. The molar ratio of Fe and AC also affected the catalytic activity. The catalytic activity of all catalysts increases first and then decreases as the molar ratio of Fe and AC increases. The best catalytic activity is observed when the molar ratio of Fe and AC is 0.10, corresponding to a maximum NO conversion of 83.9% at 240 °C. However, when the molar ratio of Fe and AC is 0.15, the Fe2O3/AC catalyst shows the lowest NO conversion. These observations suggest that the contents of the active component are of great importance to the catalytic activity. The Fe2O3/AC catalyst with Fe/AC = 0.1 shows a maximum conversion of 83.9% at 240 °C, which indicates that an optimal dispersion of Fe species over the AC surface is obtained with this content of Fe in the Fe2O3/AC catalyst. The poor activity of the Fe2O3/AC catalyst with Fe/AC = 0.15 can be attributed to the agglomeration of Fe species on the AC surface, leading
to a lack of active catalytic sites. Therefore, the best molar ratio of Fe and AC is 0.1, which is further studied in the following experiments.
SCR activity of 10FexMn/AC catalysts
On the basis of the study mentioned above, the catalytic activity of the Fe2O3/AC catalyst is best when the molar ratio of Fe and AC is 0.10 (i.e., 10Fe/AC); thus, further studies are carried out using this ratio. To enhance the catalytic activity, Mn is introduced to the 10Fe/AC catalyst.
The NO conversion of the 10Fe/AC catalysts with different Fe and Mn molar ratios at 120-240 °C are shown in Figure 3. The NO conversion clearly increases with increasing temperature. Compared with the 10Fe/AC catalyst, the addition of Mn dramatically increases the catalytic performance. This result is similar to that of Liu et al.28 At 120 °C, the NO conversion reaches 70, 68, 62, and 35% for the 10Fe1Mn/AC, 10Fe3Mn/AC, 10Fe5Mn/AC and 10Fe7Mn/AC catalysts, respectively (the catalysts are recorded as 10Fe1Mn/AC, 10Fe3Mn/AC, 10Fe5Mn/AC and 10Fe7Mn/AC when the ratio of Fe to Mn reaches 10:1, 10:3, 10:5 and 10:7, respectively). When the temperature increases from 180 to 240 °C, approximately 100% NO conversion is achieved for the 10Fe1Mn/AC, 10Fe3Mn/AC and 10Fe5Mn/AC catalysts. The NO conversion of the 10Fe7Mn/AC catalyst increases from 82 to 98% at 180-240 °C. These results may be caused by the aggregation
of MnOx particles on the AC surface, which can be
interpreted by the following BET analysis.
NH3/NO effect
As a reductant, NH3 is an essential part of the SCR catalytic reaction and is very important to the whole process of NOx conversion. The change of NH3/NO is realized by adjusting the gas flow of NH3 using a mass flow meter. In Figure 1. Schematic diagram of the experimental setup to carry out the
active test of the catalysts. (1) NO cylinder; (2) O2 cylinder; (3) N2 cylinder;
(4) NH3 cylinder; (5) cut-off valve; (6) mass flowmeter; (7) mixing reactor;
(8) temperature controller; (9) gas preheater; (10) heating furnace; (11) catalyzer; (12) flue gas analyzer.
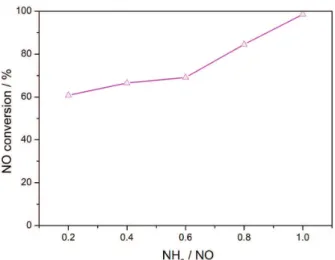
this process, the O2 and NO concentrations are constant, and the total flow remains unchanged by adjusting the flow of N2. The effect of the NH3/NO molar ratio on the activity of the 10Fe1Mn/AC catalyst at 240 °C is shown in Figure 4. The NO conversion increased slowly and the conversion is less than 70% when the NH3/NO molar ratio increases from 0.2 to 0.6. However, it increases rapidly when the ratio is in the range of 0.6 to 1.0, and the highest conversion of NO (close to 100%) is achieved at a molar ratio of NH3/NO = 1.0. Lower contents of NH3 cause an obvious decrease of the NOx conversion from the lack of a reductant. In contrast, higher contents of NH3 may allow NH3 to escape and lead to pollution in the environment. Therefore, the best NH3/NO ratio is 1.0 in this reaction.
Oxygen concentration effect
The O2 concentration is an important parameter that significantly affects NOx conversion, so the effect of the O2 concentration on the conversion of NOx was studied.
The change in O2 concentration is achieved by adjusting the flow of O2 using a mass flowmeter. The concentrations of NH3 and NO are constant and the total flow keeps constant by changing the flow of N2. The result is shown in Figure 5. It is evident that the NO conversion increases as the concentration of O2 increases from 0 to 1.0% and then remains constant beyond 1.0%. It can be concluded that a concentration of 1.0% oxygen is suitable for the NH3-SCR reaction for the 10Fe1Mn/AC catalyst.
Catalyst characterization
XRF and XRD
To identify the compositions of activated carbon, the AC which was calcined at 400 °C was analyzed by XRF, and the result is shown in Table 1. It can be seen from Table 1 that the main oxides detected in the calcined activated carbon are silica, alumina, calcium and potassium oxides. In addition, there are relatively small amounts of iron, manganese, copper oxides, as well as titanium oxides.
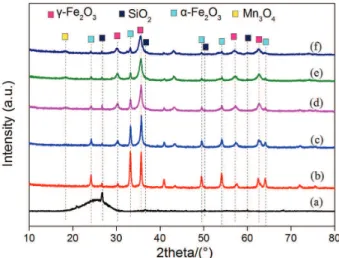
Figure 6 shows the X-ray diffraction patterns of different catalysts. The AC catalyst contains a broad band in the range of 20-30°, corresponding to the amorphous carbon structure. In addition, the XRD diffraction peaks corresponding to SiO2 (at 2θ = 26.6°, 36.26°, 50.16°, 60.01°, respectively, ICDD PDF-#46-1045) are also present.29 The diffraction peaks of Fe and Mn species are not observed. These results are in agreement with the results of XRF (as shown in Table 1), which indicate that SiO2 is the major component. The characteristic diffraction peaks of α-Fe2O3 (ICDD PDF-#33-0664) and γ-Fe2O3 (ICDD PDF-#39-1346) are present for the 10Fe/AC catalyst and the 10Fe/AC catalysts with various Mn contents. It can be seen from Figure 6 that the diffraction peaks of α-Fe2O3 and γ-Fe2O3 of 10Fe/AC catalyst have Figure 3. Catalytic activity profiles of the 10FexMn/AC catalysts with
different Fe:Mn molar ratios.
Figure 4. NO conversion of the 10Fe1Mn/AC catalyst at different NH3/NO ratios.
high intensity and narrow band width, suggesting a poor dispersion of iron oxide particles on the Fe-AC sample. After the addition of Mn, the diffraction peaks of α-Fe2O3 weaken. The intensity of the diffraction peaks of γ-Fe2O3 also decrease, and the shapes of the peaks become wider, which indicates that they have better dispersion. Upon an increase of the Fe:Mn molar ratio, the diffraction peaks of
α-Fe2O3 and γ-Fe2O3 further weaken, and only a very weak peak corresponding to Mn3O4 appears (2θ = 18.3°) when the molar ratio of Fe to Mn increases from 10:3 to 10:7. No diffraction peaks of MnOx appear for 10Fe1Mn/AC sample. These results may result from the monolayer dispersion capacity on the surface of carrier. When its loading is lower than the capacity, the oxide will be in a monolayer state, but its loading exceeds the capacity, the surplus oxide will remain as crystalline phase in the system together with its monolayer phase.30 Increasing the molar ratio of Fe and Mn, only a very weak peak corresponding to Mn3O4 appears, indicating a better dispersion of manganese oxide particles on the Fe-Mn/AC samples. Fe and Mn species may exist on the catalysts, which would enhance the dispersion and inhibit the crystallization of both.31,32
N2 physisorption
The BET surface areas and pore volumes of the 10Fe/AC catalyst and 10Fe/AC catalysts with different Mn contents are summarized in Table 2. It can be observed from
Table 2 that the surface area (349.9 m2 g-1) and pore volume (0.40 mL g-1) of 10Fe1Mn/AC are larger than those of the 10Fe/AC catalyst (306.1 m2 g-1 and 0.39 mL g-1) owing to the high dispersion of manganese and iron oxides over the AC support. However, with an increase of the Fe:Mn molar ratio (Fe:Mn = 10:3, 10:5, 10:7), the BET surface area and pore volume of the catalysts decrease, which may result from the blocking effect of the support pores by the loading of manganese oxide. As shown in Figures 2 and 3, all the Mn-modified Fe2O3/AC catalysts show higher activity than 10Fe/AC catalyst, in spite of their lower surface area and pore volumes (apart from 10Fe1Mn/AC catalyst). The results indicate that the surface area and the pore volume are not the determining factor to improve catalytic activity. This is consistent with previous findings that the catalytic activity of catalyst is more dependent on surface chemistry than surface area.33
XPS analysis
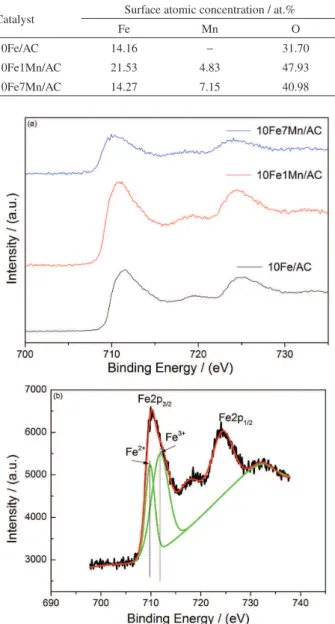
To study the oxidation state of the iron and manganese oxides of the different catalysts and to understand the atomic concentrations and chemical compositions of the surface layer, selected catalysts, such as 10Fe/AC, 10Fe1Mn/AC and 10Fe7Mn/AC, are investigated by XPS. The results are given in Table 3 and Figures 7 and 8.
Figure 7 shows the XPS spectra of Fe2p assigned to different catalysts. It can be seen from Figure 7a that two main peaks, Fe2p3/2 (peak at 711 ± 0.5 eV) and Fe2p1/2 (peak at 725 ± 0.5 eV), are obtained. There are satellite peaks on the right side of the two peaks, which correspond to Fe2p3/2 and Fe2p1/2. Compared with the standard XPS spectrum of Fe3+, the peak at 711 ± 0.5 eV corresponds to Fe3+; therefore, Fe3+ is the main valence state for the Table 1. Ash composition analysis of activated carbon (AC) by X-ray fluorescence (XRF)
Sample Composition analysis / %
SiO2 Al2O3 CaO ZnO K2O MgO Fe2O3 MnO Othersa
AC 59.93 15.94 5.35 2.92 3.40 2.05 0.659 0.065 9.751
aOthers: Na
2O, La2O3, SrO and so on.
Table 2. Physical property of the catalysts
Catalyst BET surface area / (m2 g-1)
Pore volume / (cm3 g-1)
10Fe/AC 306.1 0.39
10Fe1Mn/AC 349.9 0.40
10Fe3Mn/AC 300.3 0.38
10Fe5Mn/AC 229.9 0.39
10Fe7Mn/AC 176.5 0.36
BET: Brunauer-Emmett-Teller.
10Fe/AC and 10Fe1Mn/AC catalysts. However, the Fe2p3/2 peak of the 10Fe7Mn/AC catalyst is wide and asymmetric and does not have satellite peaks. To further analyze the composition of the Fe species and the valence states on the 10Fe7Mn/AC catalyst surface, the Fe2p3/2 spectra is separated into two peaks by performing a peak-fitting technique, and the results are shown in Figure 7b. It can be seen from Figure 7b that the aforementioned peaks can be attributed to Fe2+ (709.8 eV) and Fe3+ (711.9 eV). The ratio of Fe3+/(Fe2+ + Fe3+) is 65.5%. This result shows that the content of Fe3+ in the 10Fe7Mn/AC catalyst is significantly lower than that of the 10Fe1Mn/AC catalyst. Previous reports have indicated that Fe3+ is conducive to NO conversion at low temperature.34,35 In addition, it can be
seen from Table 3 that the Fe concentration on the surface of 10Fe/AC is 14.16%. After the addition of Mn, the Fe concentration increases to 21.53 and 14.27% on the surface of 10Fe1Mn/AC and 10Fe7Mn/AC, respectively. This indicates that the addition of Mn causes Fe to accumulate on the surface of catalysts, which would help to promote the SCR reaction.36However, the surface concentration of Fe over the 10Fe7Mn/AC catalyst is lower than that of the 10Fe1Mn/AC catalyst, indicating the introduction of excessive manganese oxide may cause the iron oxide into the porous system.37 The above analysis may correspond to the activity of the 10Fe1Mn/AC catalyst being higher than that of the 10Fe7Mn/AC and 10Fe/AC catalysts.
Figure 8 shows the Mn2p photoelectron peaks of the 10Fe1Mn/AC and 10Fe7Mn/AC catalysts through deconvolutions of the spectra. The two main peaks at 642 and 654 eV are assigned to Mn2p3/2 and Mn2p1/2, respectively. Using peak fitting to fit Mn2p3/2, the spectra of Mn4+, Mn3+ and Mn2+ are obtained, and the binding energy of various valence states are listed in Table 4. Figure 8 shows that three kinds of valence states of Mn are present on the surface of 10Fe1Mn/AC and 10Fe7Mn/AC. The Mn2p3/2 binding energy of Mn4+ (MnO2) is 644.6 ± 0.5 eV, and the corresponding binding energy of Mn3+ (Mn
2O3) and Mn2+ (MnO), found in the literature, are 642 ± 0.5 and 640.5 ± 0.5 eV, respectively. The obtained binding energy of Mn2p3/2 in 10Fe1Mn/AC and 10Fe7Mn/AC are similar to those of MnO2, Mn2O3 and MnO.38
The ratios of the different valence states of Mn on the surface of the 10Fe1Mn/AC and 10Fe7Mn/AC catalysts are listed in Table 4, which show that the Mn4+/Mn3+ atomic ratio reaches 1.04 for the 10Fe1Mn/AC catalyst and decreases to 0.93 for the 10Fe7Mn/AC catalyst. Kapteijn et al.39 reported that the NO conversion on pure manganese oxide was ranked by MnO2 > Mn5O8 > Mn2O3 > Mn3O4. The higher Table 3. Surface atomic concentrations of the catalysts
Catalyst Surface atomic concentration / at.%
Fe Mn O
10Fe/AC 14.16 − 31.70
10Fe1Mn/AC 21.53 4.83 47.93
10Fe7Mn/AC 14.27 7.15 40.98
Figure 7. XPS spectra of different catalysts: (a) Fe2p; (b) Fe2p of 10Fe7Mn/AC catalyst.
Figure 8. XPS spectra of Mn2p3/2 and Mn2p1/2 for the 10Fe1Mn/AC and
Mn4+/Mn3+ ratio indicates that there are more MnO 2 in the catalysts, so 10Fe1Mn/AC catalyst exhibits a better low-temperature catalytic activity.
H2-TPR
The H2-TPR curves of the Fe2O3, 10Fe/AC, 10Fe1Mn/AC and 10Fe7Mn/AC catalysts are shown in Figure 9. As observed from Figure 9, the reduction peak of Fe2O3 is mainly divided into two parts. The reduction peaks of the 10Fe/AC and 10Fe1Mn/AC catalysts show little difference. In addition, for the 10Fe7Mn/AC catalyst, the reduction peak at low temperature disappears and changes at high temperature. To analyze this precisely, fitting processes for the 10Fe/AC, 10Fe1Mn/AC and 10Fe7Mn/AC catalysts are carried out, and the results are shown in Figure 10. Figure 10 shows that Fe2O3 displays two reduction peaks, which are assigned to the stepwise reduction from Fe3+
to Fe2+ at 364 °C and Fe
3O4 to FeO at 589 °C.40 For the 10Fe/AC catalyst, the three peaks at 370, 592 and 721 °C are assigned to the reduction of Fe3+, Fe
3O4 and oxygen-Table 4. Binding energy (BE) and valence-state ratios of Mn on the surfaces of the obtained samples
Sample Mn
2+ Mn3+ Mn4+
AMn 4+/A
Mn 3+
BE / eV Area BE / eV Area BE / eV Area
10Fe1Mn/AC 640.9 1163 642.1 2506 644.6 2605 1.04
10Fe7Mn/AC 640.7 4129 642.0 6415 645.1 5968 0.93
Figure 9. H2-TPR profiles of the catalysts.
containing functional groups in AC, respectively. The 10Fe1Mn/AC catalyst exhibits three reduction peaks at 391, 544 and 684 °C. Compared with the 10Fe/AC catalyst, the reduction temperature of Fe3+ increases, while the other two reduction peaks shift to lower temperatures because of the synergetic effect between MnOx and FeOx.41 For the 10Fe7Mn/AC catalyst, the reduction peak below 400 °C disappears, and the other two reduction peaks occur at 442 and 631 °C. Compared with all of the catalysts tested, it is worth noting that the 10Fe1Mn/AC catalyst possesses the largest reduction area, which suggests that it has the strongest reduction ability.
Conclusions
The catalytic activity of the 10Fe/AC catalyst was increased by the addition of manganese oxide. The 10Fe1Mn/AC, 10Fe3Mn/AC, and 10Fe5Mn/AC catalysts showed the best performance at 180-240 °C among the various manganese-modified Fe2O3/AC catalysts. The modification with a certain amount of Mn species resulted in a better dispersion of the amorphous state, a larger surface area, higher existing amounts of Fe3+/(Fe3+ + Fe2+) and Mn4+/Mn3+, and a stronger reduction ability as detected by XRD, BET, XPS and H2-TPR, which were all beneficial for improving the SCR performance of the catalyst. There are high NO conversion of 10Fe1Mn/AC catalyst at a molar ratio of NH3/NO = 1.0 and a concentration of 1.0% oxygen. In this study, the effect of SO2 and H2O on the catalytic activity was not conducted. As we know, the catalyst resistances to SO2 and H2O are key problems in industrial practice, which will be studied in the future.
Acknowledgments
We greatly appreciate the financial support provided by the National Natural Science Foundation of China (No. 51676001, 51376007, U1660206), the Anhui Provincial Natural Science Foundation (No. 1608085ME104), key projects of Anhui Province University Outstanding Youth Talent (No. gxyqZD2016074, gxyqZD2017038) and the National Key R&D Program (2016YFB0601402-02).
References
1. Sahu, S. K.; Beig, G.; Parkhi, N.; Aerosol Air Qual. Res.2015, 15, 1137.
2. He, F. Q.; Deng, X. H.; Chen, M.; Chemosphere2017, 168, 623.
3. Li, W. M.; Liu, H. D.; Chen, Y. F.; Front. Environ. Sci. Eng.
2017, 11, 6.
4. Yang, Y.; Xu, W. Q.; Wu, Y. H.; Wang, J.; Zhu, T. Y.; Catal. Commun.2017, 94, 82.
5. He, F. Q.; Deng, X. H.; Chen, M.; Fuel2017, 199, 523. 6. Patila, B. S.; Cherkasovb, N.; Langc, J.; Ibhadonb, A. O.;
Hessela, V.; Wang, Q.; Appl. Catal., B 2016, 194, 123. 7. Hung, C. M.; Aerosol Air Qual. Res.2015, 8, 447.
8. Shen, B. X.; Ma, H. Q.; He, C.; Zhang, X. P.; Fuel Process. Technol. 2014, 119, 121.
9. Yang, W. W.; Liu, F. D.; Xie, L. J.; Lian, Z. H.; Hong, H.; Ind. Eng. Chem. Res.2016, 55, 2677.
10. Huo, Y. T.; Chang, Z. D.; Li, W. J.; Liu, S. X.; Dong, B.; Waste Biomass Valorization 2015, 6, 159.
11. Shen, M. Q.; Li, C. X.; Wang, J. Q.; Xu, L. L.; Wang, W. L.; Wang, J.; RSC Adv. 2015, 5, 35155.
12. Peng, Y. J.; Li, H.; Si, W. Z.; Li, X.; Shi, W. B.; Luo, J.; Fu, M. J.; John, C.; Hao, J. M.; Chem. Eng. J.2015, 269, 44. 13. Grzybek, T.; Klinik, J.; Motak, M.; Papp, H.; Catal. Today2008,
137, 235.
14. Lei, Z. G.; Long, A. B.; Wen, C. P.; Zhang, J.; Chen, B. H.; Ind. Eng. Chem. Res.2007, 50, 5360.
15. Qiu, L.; Pang, D. D.; Zhang, C. L.; Meng, J. J.; Zhu, R. S.; Ouyang, F.; Appl. Surf. Sci.2015, 357, 189.
16. Kang, M.; Park, E. D.; Kim, J. M.; Yie, J. E.; Appl. Catal., B
2007,68, 21.
17. Zhu, Y. W.; Zhang, Y. P.; Xiao, R.; Huang, T. J.; Shen, K.; Catal. Commun.2017, 88, 64.
18. Xiong, Z. B.; Wu, C.; Hu, Q.; Wang, Y. Z.; Jin, J.; Lu, C. M.; Guo, D. X.; Chem. Eng. J. 2016, 286, 459.
19. Thirupathi, B.; Smirniotis, P.; J. Catal. 2012, 288, 74. 20. Peña, D. A.; Uphade, B. S.; Smirniotis, P. G.; J. Catal. 2004,
221, 421.
21. Luo, S. P.; Zhou, W. T.; Xie, A. J.; Wu, F. Q.; Yao, C.; Li, X. Z.; Zuo, S. X.; Liu, T. H.; Chem. Eng. J. 2015, 286, 291. 22. Zahaf, R.; Jung, J. W.; Coker, Z.; Kim, S.; Choi, T. Y.; Lee, D.;
Aerosol Air Qual. Res.2015, 15, 2409.
23. Chansai, S.; Burch, R.; Hardacre, C.; Norton, D.; Bao, X.; Lewis, L.; Appl. Catal., B2014, 160, 356.
24. Sun, D. K.; Liu, Q. Y.; Liu, Z. Y.; Gui, G. Q.; Huang, Z. G.; Appl. Catal., B2009, 92, 462.
25. Li, S. J.; Wang, X. X.; Tan, S.; Shi, Y.; Li, W.; Fuel2017, 191, 511.
26. Liu, Y.; Ning, P.; Li, K.; Tang, L. H.; Hao, J. M.; Song, X.; Zhang, G. J.; Wang, C.; Russ. J. Phys. Chem. A2017, 91, 490. 27. Samojeden, B.; Motak, M.; Grzybek, T.; C. R. Chim.2015, 18,
1049.
28. Liu, L.; Gao, X.; Song, H.; Zheng, C. H.; Zhu, X. B.; Luo, Z. Y.; Ni, M. J.; Cen, K. F.; Aerosol Air Qual. Res.2014, 14, 1038. 29. Gao, X.; Liu, S. J.; Zhang, Y.; Luo, Z. Y.; Cen, K. F.; J. Hazard.
Mater. 2011, 188, 58.
32. Huang, J. H.; Tong, Z. Q.; Huang, Y.; Zhang, J. F.; Appl. Catal., B2008, 78, 309.
33. Li, W.; Tan, S.; Shi, Y.; Li, S. J.; Fuel2015, 160, 35.
34. Devadas, M.; Krocher, O.; Elsener, M.; Wokaun, A.; Mitrikas, G.; Soger, N.; Pfeifer, M.; Memel, Y.; Mussmann, L.; Catal. Today2007, 119, 137.
35. Delahay, G.; Valade, D.; Guzmanvargas, A.; Coq, B.; Appl. Catal., B2005, 55, 149.
36. Wang, X. B.; Wu, S. G.; Zou, W. X.; Yu, S. H.; Gui, K. T.; Dong, L.; Chin. J. Catal. 2016, 37, 1314.
37. Samojeden, B.; Grzybek, T.; Energy2016, 116, 1484.
38. Chen, Z. H.; Yang, Q.; Li, H.; Li, X. H.; Wang, L. F.; Tsang, S. C.; J. Catal. 2010, 276, 56.
39. Kapteijn, F.; Singoredjo, L.; Andreini, A.; Moulijn, J. A.; Appl. Catal., B1994, 3, 173.
40. Mauvezin, M.; Delahay, G.; Coq, B.; Kieger, S.; Jumas, J. C.; Olivier-Fourcade J.; J. Phys. Chem. B 2001, 105, 928. 41. Qi, G. S.; Yang, R. T.; J. Catal. 2003, 217, 434.
Submitted: March 21, 2017
Published online: June 26, 2017