Antonio Henriques de Araújo Jr*
State University of Rio de Janeiro Rio de Janeiro – Brazil [email protected]
Flávio Hegenberg
University Center Oswaldo Aranha Volta Redonda – Brazil fl [email protected]
Isabel Cristina dos Santos
University of Taubaté Taubaté – Brazil [email protected]
José Glênio Medeiros de Barros
State University of Rio de Janeiro Rio de Janeiro – Brazil [email protected]
*author for correspondence
Identifi cation and analysis of
explanatory variables for a
multi-factor productivity model
of passenger airlines
ABSTRACT: The paper aimed to identify and analyze the explanatory variables for airlines productivity during 2000 2005, by testing the Pearson correlation between the single factor productivity capital, energy and labor of a sample of 45 selected international airlines (4 Brazilian carriers among them) and their productivity explanatory variables like medium stage length, aircraft load factor, hours fl own and cruise speed for selected routes besides aircraft seat confi guration and airlines number of employees. The research demonstrated, that a set of variables can explain differences in productivity for passenger airlines, such as: investment in personnel training processes, automation, airplane seat density, occupation of aircraft, average fl ight stage length, density and extension of routes, among others.
Keywords: Multifactor productivity, Multifactor productivity model, Airline productivity, Passenger airline productivity.
INTRODUCTION
In the age of deregulation, great disparities exist between airlines in their ability to reduce unit costs by improving productivity and also to generate adequate revenues despite increasing price competition. Substantial differences exist, for example, between The United States of America’s (US) airlines and non-US airlines in terms of cost
efi ciency, revenue generation and, in turn, proi tability.
Usually, measures of airline productivity to the extent they are used in the industry are limited to relatively simple ratios – such as passenger enplanements per employee and Available Seat Miles (ASM) produced per labor dollar spent – which does not allow reliable conclusions and comparisons among the productivity of airlines.
RESEARCH OBJECTIVES
This paper focuses on the productivity analysis of the main production factors for airlines: (a) labor, (b)
capital and (c) energy and the identii cation and analysis
of variables that can statistically explain these single productivities factors labor and, consequently, their Total Factor Productivity.
Little or no research has been done to identify variables that explain productivity of scheduled passenger airlines in order to develop a model of multiple variables, more
complex to measure productivity and compare productivity between airlines.
The paper aimed to identify and discuss the explanatory variables for the productivity of scheduled international airlines by testing the Pearson correlation between the productivity changes of airlines and their explanatory variables with the objective of proposing a productivity model.
The research demonstrated that an extensive set of variables can explain differences in productivity of airlines. These variables include: investment in personnel
training, process automation, airplane seat coni guration, occupation of the aircraft (load factor), l ight stage length,
density and extension of routes, among others.
The aim of this paper was not to formulate the model itself,
but to allow, from the identii cation of these variables, the
creation of conditions to formulate such a model.
THEORETICAL FRAMEWORK
The demonstrable effects of successful US deregulation
and ongoing inefi ciency in the industry may have inl uenced the European Commission to introduce certain
reforms to promote competition and thus increase the
efi ciency and productivity of European airlines.
Much of the literature has concentrated on productivity in
the United States compared to that in Europe according
to the McKinsey Global Institute (1992) and Good et al. (1993), whereas only a small proportion of papers
present productivity estimates for European countries individually, as reported by Encaoua (1991). Moreover,
many authors prefer to concentrate on Total Factor Productivity (TFP), as stated by Windle (1991), in favor of labor productivity measurements.
The productivity of air transport has been extensively studied over the last two decades, using different methods. Bailey, Graham and Kaplan (1985) proposed, when considering the deregulation of air transportation in the United States, a method to measure the productivity of US airlines, based on the relationship between the average costs per ton x km and two time periods, and an index of input prices for airlines,
according to the following formula (Eq. 1):
PRt =CRt / CRt -1 Pt / Pt -1
(1)
Where CRt is the average cost per ton transported in period t and Pt is a price index of inputs in period t. These authors estimated, in 1985, the total productivity
due to changes in the occupation of 18 airline leets in
the domestic US market.
Windle (1991) compared the TFP and costs of 41 companies
(14 American, 27 European and Asian), between 1970
and 1983, using the translog multilateral output index,
as proposed by Caves, Christensen and Diewert (1982).
In this study, ive categories of inputs were utilized: (a) labor, (b) fuel, (c) light equipment, (d) ground equipment
and (e) materials. The author pointed to the evidence of a relationship between TFP and Multifactor Productivity (hereafter, MFP) input categories, such as Revenue Ton Miles (RTM) per employee.
Distexhe and Perelman (1994) aimed, in their study, to evaluate the consequences of the deregulation in the
US market. This was done by measuring eficiency and
productivity of airlines (during the period between 1977 and 1988).
The sample consisted of 33 companies operating in 3
groups of markets: (a) Asia and Oceania, (b) Europe and (c) North America. The authors used the Data Envelopment Analysis (DEA) method to construct eficient frontiers for
these companies, using Färe’s approach to estimate the Malmquist Productivity Index (MPI), by breaking it down
into technical progress and eficiency gains, and using
labor and capital as inputs.
In the above mentioned research, Distexhe and Perelman
(1994) showed that European airlines were less eficient than the surveyed US carriers. Among the European airlines, Lufthansa, KLM and Air France had the highest eficiency
score, while British Airways, Alitalia and Swissair failed
to reach more than 80% of the eficient frontier.
Sickles, Good and Getachew (2002) examined the
productive performance of a group of 3 East European carriers and compared them to 13 of their West European competitors during the period 1977-1990. The authors irst
modeled the multiple output/multiple input technology with a stochastic distance frontier using semi-parametric
eficient methods.
The endogenous character of multiple outputs is addressed, in part, by introducing multivariate Kernel estimators for the joint distribution of the multiple outputs
and potentially correlated irm random effects. They
augmented estimates from semi-parametric stochastic distance function with nonparametric distance function methods, using linear programming techniques, as well as with extended decomposition methods, based on the Malmquist index number.
Both semi- and nonparametric methods indicated
signiicant slack in resource utilization in the East European
carriers studied relative to their Western counterparts, and
limited convergence in eficiency or technical change
between them.
Kune, Mulder and Poudevigne (2000) evaluated air transport productivity in France, Germany, United Kingdom and the United States for the period 1970-1998, using the TFP method. The objective of this study was to evaluate and compare the productivity of labor, capital and the TFP of air transport in these countries. The MFP was estimated by means of production functions and with
the utilization of variables such as Value-added, Labor,
and Capital.
The authors suggested in their study that, if the costs of production factors are equal to their marginal productivities, according to the neo-classical assumptions for competitive markets, the increase of TFP can be estimated with the Divisia-Tornquist index.
The above mentioned authors concluded that capital is a key production factor in the airline industry, and a large part of the improvement of this economic sector depends on investments in infrastructure and equipment. The differences of the capital stock per worker are also important variables for explaining performance differences between economic sectors and countries. The labor and capital productivity between France, Britain, Germany and the United States was compared in this study.
generalization of Shephard directional distance functions, by using the TFP of US airlines, whereby this author employed the Malmquist-Luenberger Productivity Index, constructed from directional distance functions.
Oum and Yu (2001) produced interesting research in empirical and conceptual terms, evaluating the performance and productivity of the largest Canadian airlines for the period 1995-2000, in comparison to the eight largest American companies, using Kendrick’s arithmetic index and performance metrics such as average load factor and medium stage length, evaluating also the
economic and inancial performance of these companies.
In Brazil, Araújo Junior (2004) studied the productivity of Brazilian airlines, during 1996-2002, evaluating the performance of the ive largest Brazilian airlines, also
using Kendrick’s arithmetic index and concluded that the TFP of these carriers, surpassed the average productivity
of the Brazilian industry sector.
METHODOLOGICAL PROPOSITION
A Multi-factor Productivity (hereafter, MFP) index, which includes the main production factors (i.e. labor, capital and energy), was used to measure the productivity of companies surveyed during the 2000-2005 time period.
Multi-factor productivity
TFP or MFP is deined as the ratio in the quantities/
volumes produced and a weighted combination of quantities and volumes of the different inputs used in the production process. Kendrick’s productivity measurement method was used with changing-weight indices of outputs
and inputs according to Kendrick (1996).
The MFP index is represented as the ratio between the output and input, where inputs are weighted by their share
in production costs (Eq. 2).
MFP= AVt
a
0(Lt)+b0(Kt)
x100 (2)
In Eq. 2, MFP indicates the MFP index measured in
monetary terms, according to Kendrick’s method, which, in this case, is calculated from the ratio between the added value of the airlines in year t and the weighted relationship of labor, e.g. salaries (Lt) and capital, e.g. capital assets (Kt) in the same year, where a0 and b0 represent labor and capital weights, respectively.
MFP = AVt / AV0
a0(Lt/ L0) + b0(Kt / K0) + c0(Et/ E0)x100
(3)
Equation 3 is derived from Eq. 1, which makes possible
to calculate productivity growth in physical terms in a time period (0, t), where AVt is the number of passengers transported or the Revenue Seat-km (RSK); Ltrepresents the number of employees at the end of period t (31st December); Kt is the number of aircraft operating at the end of the same period and Et is the amount of fuel spent also at end of period t.
Different labor and capital productivity weights, taken
from Economic Report (IATA, 2001), take into account
the share of input in the operational costs of carriers, according to the airline of origin, as shown in Table 1.
Equation 3 gives the productivity change from a reference
period 0 to a future time t.
Some authors, among them Moreira (1994), propose that weights a0 and b0 should be substituted, periodically, in
order to relect alterations in the production structure
and changes in relative prices of capital and labor. Some
organizations, such as the National Bureau of Economic Research (NBER), recommend changes every ive years.
Pearson product-moment correlation coeficient
The Pearson product-moment correlation coeficient
(denoted by r) is a measure of the correlation (linear dependence) between two variables X and Y, taking values from -1 through 0 to +1.
It has been used in the sciences as a measure of the strength of linear dependence between two variables. The correlation
coeficient is sometimes called “Pearson’s r.” Pearson correlation coeficient between two variables is deined as
the covariance of the two variables (X and Y) divided by
the product of their standard deviations (Eq. 4):
X,Y =
cov(X,Y)
X Y
= E[(X X)(Y Y)]
X Y (4)
Equation 4 deines the population correlation coeficient,
commonly represented by the Greek letter ρ (rho). If we substitute estimates of the covariances and variances based
on a sample, we obtain the sample correlation coeficient
r -i1 n
(X
i< X)(Yi<Y)
-i1 n
(X
i <X)
2
-i1 n
(Y
i<Y) 2
(5)
An equivalent expression gives the correlation coeficient
as the mean of the products of the standard scores. Based on a sample of paired data (Xi, Yi), the sample Pearson
correlation coeficient is (Eq. 6):
r" 1
n1i8"1 n X
iX
s
X
Y
iY
s
Y
(6)
Where Xi<X
sX
, X and sX are the standard score, sample
mean, and sample standard deviation. Several authors have offered guidelines for the interpretation of a correlation
coeficient. Cohen (1988) has observed, however, that all
such criteria are, in some ways, arbitrary and should not be observed too strictly.
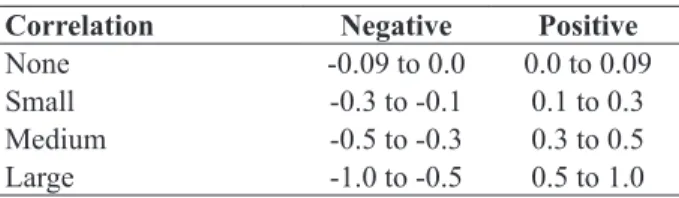
The interpretation of a correlation coeficient depends on
the context and purposes. A correlation of 0.9 may be very low if one is verifying a physical law using high-quality instruments, but may be regarded as very high in the social sciences where there may be a greater contribution from complicating factors. Pearson’s correlation intervals are disclosed in Table 2.
Statistical inference based on Pearson’s correlation
coeficient often focuses on one of the following two
aims. One aim is to test the null hypothesis that the
true correlation coeficient is ρ, based on the value of
the sample correlation coeficient r. The other aim is to
construct a conidence interval around r that has a given probability of containing ρ.
Data collection
The information and data like medium stage length, load
factor, hours lown, airplane model coniguration, number
of employees, for the period of 2000-2005 were collected
from international and Brazilian publications: World
Air Transport Statistics (IATA), the Digest of Statistics (ICAO); Fleet and Personnel Series (ICAO), the Financial
Data Series (ICAO) and the Brazilian National Civil
Aviation Agency (ANAC) commercial aviation yearbook. Three categories of inputs were used: (a) labor, (b) capital,
represented by light equipment and (c) energy.
Labor
The labor productivity index is calculated as a multi-lateral index of 5 categories: pilots, co-pilots, other cockpit personnel, cabin attendants and other personnel. Output is composed of two separate components: scheduled revenue (passenger/km), and passengers transported.
Flight equipment
It is represented by the number of aircraft used to transport passengers and cargo. In the index of aggregate capital, the percentage change in the number of aircraft was considered, adjusting it by the number of seats offered, so
as to take into consideration the size of aircraft.
Energy
The aggregate index of energy was constructed considering the percentage change in consumption of fuel (jet fuel,
since only the leet of jets was considered).
Sampling criteria
Forty-ive carriers were selected and grouped as follows:
• 26 full service;
• 7 low-cost/low fare; and
• 12 regional airlines.
The airlines were sampled according to the following criteria: (i) the presence and importance of the airlines in
their markets (North and South American, European and
Asian airlines); (ii) carriers whose data availability and previous studies indicated good operational performance and productivity were chosen.
Table 2. Pearson correlation intervals.
Correlation Negative Positive
None -0.09 to 0.0 0.0 to 0.09 Small -0.3 to -0.1 0.1 to 0.3 Medium -0.5 to -0.3 0.3 to 0.5 Large -1.0 to -0.5 0.5 to 1.0
Table 1. Adopted weights for labor and capital productivity.
Airlines (a
0) (b0)
North American 0.66 0.34
European 0.72 0.28
Asian 0.57 0.43
South American 0.61 0.39 a0: labor weight; b0: capital weight.
The airlines included in the sample are detailed below:
• full service: Aerolot, Aerolineas, Aeromexico, Air
Canada, Air France, Alitalia, Austrian American Airlines, British Airways, China Southern Continental, Delta, Iberia, JAL, Korean, Lan, Lufthansa, Malev, SAS Singapore, Airlines, Swiss, TAP, Thai, Turkish Airlines, TAM and VARIG;
• low-cost/low-fare: Air Berlin, Air Europa, America
West, GOL, Jet Airways, Ryanair, and Virgin
Express;
• regional: Alaska, Nordeste, Oceanair, Pantanal,
Passaredo, Penta, Portugalia Airlines, Rico, Riosul, TAF, Total, US Airways.
In the case of the Brazilian airlines, a survey was undertaken through ield research to collect the necessary information
and data via a questionnaire specially designed to include the main outputs and production inputs. This was sent by e-mail to:
• the four largest Brazilian airlines: TAM, GOL,
VARIG, and WebJet; three of them operate in domestic and international markets, and one in the regional market;
• the Brazilian Regulatory Agency.
The single factor productivity of each of the researched companies was calculated: capital, energy and labor. These airlines single factor productivities were then compared with the explanatory variables like medium stage length,
aircraft load factor, hours lown, aircraft size, aircraft seat coniguration, cruising speed, and aircraft engine
performance for selected routes.
AIRLINE PRODUCTIVITY AND EXPLANATORY VARIABLES
The purpose of this research was to understand the main variables which explain the air transport productivity, namely: labor, capital and energy productivity. These variables
inluence and are inluenced by others, such as investment
in personnel training, processes automation, aircraft load
factor, light stage length, leet mix, among others.
Some variables impact more than a single productivity factor. Investment in training of pilots, for instance, affects
both labor and energy productivity. The light stage length might inluence both the capital and energy productivity.
Airlines, however, have only limited control over some of these explanatory variables, as explained below.
Production output
Output in the airline industry is comprised of passenger services, as measured by Revenue Passenger Miles (RPMs), and cargo services, as measured by ton x miles. Passenger miles are by far the largest component, making up more than 90% of total revenue, with the remainder attributable to ton x miles. Although the output measure does not account
for changes in service quality, such as light delays, some
recent studies seem to indicate that these changes did not
signiicantly affect output and productivity.
An airline may increase or decrease its output level through
management actions, but it is usually more inluenced by
economic conditions, such as the demand for passengers (over which they have no control).
Average stage length
This variable depends on the route, the market structure and the air network operated by the company which, in turn, depends on the country or territory extension served, the extent of regulatory control and the attitude of government towards bilateral agreements.
Output composition or “output mix”
This variable is strongly inluenced by the geographic
location, the regulatory control and the different demands
placed on commercial airlines. In the case of Brazilian
airlines, there are small variations in the output mix. Most of them transport passengers, with a smaller share of cargo and mail.
Aircraft load factor
Some researchers, among them those of the International
Labor Organization (2001), argue that the load factor is
largely determined by the market demand and the extent of control the airline has over the choice of the aircraft
type and the light frequency. These researchers argue
further that an airline can only manage the load factor of
its leet by adjusting the light frequency and the aircraft size, with permission of the regulatory authorities.
Determinants of labor productivity
The labor productivity is inluenced, for instance, by the
by the automation of some processes, such as computer ticketing.
Duke and Torres (2005) reported that, although light crew members (which include pilots and light attendants)
are highly visible employees in the airline industry (comprising about 30% of total employment in the
industry), the majority of employees work in “ground occupations”. In addition to travel reservation agents and
transportation ticket and customer service representatives, their occupations include aircraft mechanics, service technicians, and baggage handlers, among others.
Yet according to Duke and Torres (2005), during the decade of 1990, employment growth in the air transportation industry slowed markedly to an average 1.8% per year.
Employment declined by a slight 0.2% in 2001, which then dropped to a substantial 11.6 % in 2002.
Part of the slowdown in the 1990’s was spurred by increased customer use of Internet web sites for air travel planning. These web pages became increasingly more sophisticated, allowing travelers to do almost everything related to their travel, from checking the status of their
frequent-lyer accounts, to booking lights and selecting
their own seats.
With increased Internet use by customers, airlines have been able to reduce the number of customer service
agents required to handle bookings and light information
questions. In addition to being able to book their own
lights, once travelers arrive at the airports across the
country, they can take advantage of the self-service kiosks provided by the airlines, which have grown in popularity since their introduction in 1995.
These kiosks allow the passengers, for example, to get boarding passes, select seats, check baggage, and change
lights. The increased use of self-service kiosks has given airline carriers the lexibility to lower their costs by using
fewer employees at the airports.
The outsourcing of certain functions and activities, particularly those that are not concerned with the core competence of airlines, have contributed to improving labor productivity (especially so in the airline industry),
as they transfer to specialized irms the rationalization
of activities and processes in pursuit of a reduction in operation and service costs, such as aircraft maintenance services, ground operation support and catering.
One of the irst outsourced activities in the airline
industry was food preparation. While 10 years ago most airlines produced and distributed their own food on board, according to the study of the International Labor
Organization (2001), currently only 2 companies control around 60% of the catering market (with annual revenues
of US$ 11 billion).
Aircraft maintenance is currently undergoing a restructuring process. A growing number of carriers are hiring service and selling out maintenance workshops and equipment. The new technologies required for the maintenance of modern aircrafts make this activity extremely costly
and a highly specialized business. Sophisticated aircraft
models that require less frequent maintenance, make it
increasingly dificult for an airline, individually, to justify
high investments in workshops and equipment.
Currently, 75% of aircraft maintenance, according to the
International Labor Organization (2001), is undertaken by airlines, while the rest is performed by specialized irms
or by aircraft manufacturers. Maintenance of engines (a
more specialized service), is performed, in most cases, by
the manufacturers.
The IATA, in its annual report (2001), forecasts for the coming years increased outsourcing for ground handling services. Currently, 75% of these services are performed by airports or airlines. In 2010 (it is estimated that) 50% of this US$ 27 billion business will be in the hands of specialists.
A global company was created with the sale of GlobeGround (a Lufthansa subsidiary), to the French Penauille Polyservices, which operates in 199 airports and 39 countries, employing over 30,000 employees.
The automation of some processes (such as ofice activities and ticketing) is another important factor inluencing labor productivity. Reservation systems and computerized
ticketing were shared between different companies by cost and emission time reductions.
According to the International Labor Organization (2001), “the Internet and aviation were made for each other. Flights
are expensive highly perishable products and the information
via Internet, can be quickly available to customers”.
Airlines have another important reason for adopting the Internet: to generate savings in marketing and distribution costs, that are currently responsible for 25% of the operating expenses. The Internet has enabled, in 2001, according to IATA (2001), to generate savings of up to 5% on tickets sales, eliminating the printing and distribution costs of tickets and also computer reservation fees (approximately US$ 11 per ticket), thus reducing labor.
The IATA, in its 2001 annual report, estimates that
electronic ticketing (“e-ticketing”) is already generating
in distribution costs. The e-ticketing of airlines has now the largest sales volume on the Internet. Although the electronic sales represent a share of 5% to the conventional airlines in the United States, to some US low cost carriers, they already account for 90% of total sales.
Determinants of capital productivity
The productivity of capital is strongly inluenced by the way the airlines operate their light equipment, which, in
general, represent their most important asset. The capital productivity is affected by variables such as aircraft seat
density, leet composition or mix, aircraft load factor, use of aircraft, and light stage length.
It can be recognized in a simpliied form that the main cost
factors of air transport are represented by labor, depreciation and leasing of aircraft and fuel consumption, which had, in
2002, considering the case of Brazilian airlines, an average
share of 72% of the direct costs. This proportion has had practically no change within the period between 2000-2005.
The main ixed asset item of carriers is represented by light equipment. The ixed assets of Brazilian airlines
represented, on average, around 40% of the total assets in 2004. The main variables that impact the capital productivity of airlines are:
- average seating coniguration of aircrafts, an important
measure implemented by the airlines to improve productivity has been the increase of seats per aircraft. American companies (since the beginning of the 1990’s)
have increased the seating coniguration in trunk lines.
Average seat numbers per aircraft increased by 15% in the United States, according to the Civil Aeronautics Board (between 1989 and 1994). Contrary to the trend observed in the American carriers, the exact opposite occurred in
the case of Brazilian aviation between 1995 and 2002: there was a decrease in the aircraft seat density by 16%;
- leet composition or leet mix: Brazilian carriers, similarly
to the American ones, have substantially reduced the use
of aircrafts that are less eficient in fuel consumption. The
increase of aviation input prices (especially fuel) have
forced this procedure. The leet adequacy in terms of aircraft size, eficiency and engine output has contributed
to the increase in the capital and energy productivity, and, consequently, in the multi-factor productivity;
- leet/aircraft operation: one of the variables with the
strongest impact on the productivity of air transport is the aircraft load factor, which represents the relationship between demand and supply of passenger or freight.
Large load factors indicate an eficient use of the aircraft
and crew, leading to favorable economic results. Douglas and Miller (1974) examined the relationship between aircraft load factor, route length and route density, using
data from the US market in 1969, and concluded that the
aircraft load factor was negatively correlated with the medium stage length, i.e. it increased with the decrease
of light distances. This is exactly contrary to what
would be consistent with the economic theory of welfare
maximization, but consistent with the theory that airline
deregulation forced the carriers to offer a capacity excess.
Bailey, Graham and Kaplan (1985) analyzed the change of
this relationship after the US market deregulation. When comparing the statistics of this study, it became evident that this relationship had changed over time, as predicted by theoretical studies.
The aircraft load factor grew with the increase in the
light stage length, according to Bailey, Graham and
Kaplan (1985) based on US market data for the period
between1976-1981 period, exactly the opposite of what
occurred during the regulation period.
A large portion of the costs of the airlines is ixed costs,
such as crew wages and aircraft depreciation aircraft leasing. The better occupation of the aircraft reduces unit costs (unit costs per passenger). In a regulated market, a
load factor increase is very dificult to implement, as an airline depends on authorization from the regulators to eliminate lights.
The American experience has shown that the leet load
factor has grown considerably since deregulation occurred
in the late 1970’s, due to greater pricing lexibility
permitted by the regulator, and the freedom of airlines to
match supply and demand. Also in Brazil, the load factor
of airlines increased for the period of 2000-2005, whereby
the average load factor of Brazilian airlines reached 62.1%
within this same period;
- use of aircraft: the operating objective of airlines is to use aircrafts more intensively by increasing the number
of light hours/day. The American literature based on
reports of The Civil Aeronautics Board states that the
equipment utilization rate increased by an average of half
an hour per day in the post-deregulation period. Within
Brazilian aviation (between 1995 and 2002), there was an absolute increase in the number of hours lown, despite the reduction in the number of hours lown per aircraft;
- average stage length: the light stage is one of the operating parameters that most inluence the unit cost and productivity of an airline. Airlines with light stage beyond average have
A rapid decline in unit costs, with the increase in the average
light, is a characteristic of air transport. This is due to the
fact that airport charges and other associated costs such
as fees for landing and takeoff are ixed, regardless of the light distance. Therefore, a larger light stage length has
as result a better use of aircraft and crew.
In the case of US irms, the experience has shown that those in pursuit of operational eficiency in both trunk routes (trunk carriers) and “feeder” routes (local service
carriers) have increased the proportion of long distance
lights in order to increase their operational eficiency.
Larger stage length means, in practice, more eficient use of light equipment by reducing proportionally to the
distance traveled the fuel consumption, since the largest
speciic consumption occurs during takeoff and landing.
Doganis (1985) states that an aircraft burns a signiicant
amount of fuel during the aircraft maneuver on the ground, the landing and takeoff (on average, 20 to 30 minutes). During takeoff and on a smaller scale on landing, the fuel consumption is high (relative to the distance traveled
horizontally). Ground maneuvers, takeoffs and landings become proportionately smaller when the medium light
stage length increases.
The Canadian experience, as reported by Oum and Yu
(2001), showed that an airline with a 10% longer light
stage length had its multi-factor productivity increased in the order of 1.7%.
Determinants of energy productivity
Doganis (1985) afirms, by examining the determinants
of air transport costs, that the main variables that
inluence fuel consumption and, consequently, the energy
productivity of an airline are:
- cruise speed: the cruising speed of an aircraft affects its
operating cost, regardless of its size. This effect can be
expressed in terms of its hourly productivity. Since the hourly productivity of an aircraft is the product of its payload in ton times its speed, the higher the cruising speed, the greater the production and the productivity per hour. As, in practice, faster aircraft are also larger, the
advantages of speed and size reinforce each other;
- aircraft size: some technological aspects have a direct
effect on productivity and operating costs of each type of aircraft. Most importantly, the economic point of
view is probably the size of aircraft, its cruising speed and light range with full payload. The signiicance of size, speed and range of an aircraft is reinforced by the
fact that these variables affect its hourly productivity, which in turn affects its operational costs. As a general rule, the larger the aircraft the lower the operating costs per unit of production, i.e. per ton x mile or passenger x mile.
The operating cost per hour lown of a larger aircraft
will be higher than that of a smaller aircraft, but this cost will be even lower when converted to cost per seat-km
or tonne-kilometers. Doganis (1985) states that the size
of an aircraft affects cost and productivity in two ways: the larger aircraft has a proportionally lesser aerodynamic drag, allowing it to carry more pay-load per unit of weight. At the same time, larger aircrafts use larger and
more eficient engines;
- engine performance: the basic characteristic of an aircraft is its engine. The same type of engine may have different performances on different aircrafts and routes. The performance of an engine also depends on variables beyond the operating control of the airline: altitude and
temperature of airports served, light stage length, aircraft
aerodynamics, cruising altitude etc.
The type of aircraft operated has a signiicant effect on
the operating costs. Taking into account this premise, the key question is the extent to which an airline is free to select the type of aircraft it wants to operate, or to what extent the choice is conditioned by the extent and density
of trafic in its routes.
Since the company made the choice of aircraft and its engine for the different segments of its transport network, and due to high investment in maintenance, facilities, training of pilots, engineers and mechanics, it is unlikely to replace it in short-term period.
The correlation analysis between the single productivity factors and the explanatory variables of an airline is detailed in the following section.
CORRELATION BETWEEN SINGLE-FACTOR PRODUCTIVITY AND THEIR EXPLANATORY VARIABLES
It is intended to identify and understand in the context of this research the main variables that explain the multi-factor productivity and the single-multi-factor productivity of airlines (e.g. labor, capital and energy).
These single-factor productivities (labor, capital and energy) are dependent on other variables such as investment and training of crew members and maintenance teams, outsourcing of activities and processes, automation of administrative and operational
processes, average seating coniguration of operating leet of an airline, load factor, cruise speed, stage length,
among others (Fig. 1).
Some variables affect more than a productivity factor. The
investment in the training of pilots, for instance, inluences
both labor and energy productivity. The light stage length inluences both capital and energy productivity.
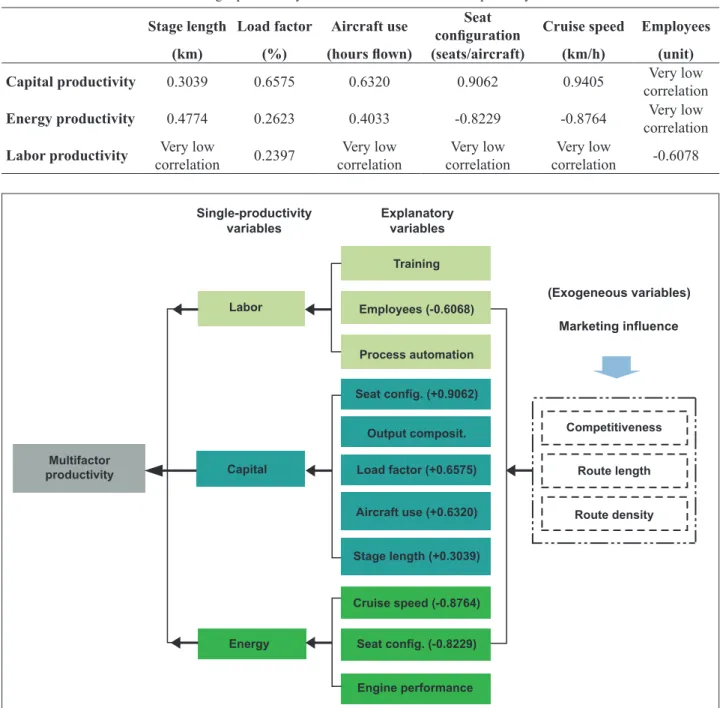
As it can be seen in Table 3, there is, in descending order, a large positive correlation, according to the intervals
deined in Table 1, between capital productivity and
cruise speed (r2=0.9405), capital productivity growth and
seat coniguration/density (r2 = 0.9062).
The study showed that the correlation capital productivity
versus cruise speed is larger among carriers with larger
Table 3. Correlation matrix between single-productivity factor of airlines and its main explanatory variables.
Stage length Load factor Aircraft use conigurationSeat Cruise speed Employees
(km) (%) (hours lown) (seats/aircraft) (km/h) (unit)
Capital productivity 0.3039 0.6575 0.6320 0.9062 0.9405 Very low
correlation
Energy productivity 0.4774 0.2623 0.4033 -0.8229 -0.8764 Very low
correlation
Labor productivity Very low
correlation 0.2397
Very low correlation
Very low correlation
Very low
correlation -0.6078
Figure 1. Productivity model for scheduled airlines, deduced from the collation and analysis of labor, capital and energy productivity and their explanatory variables.
Conig.: coniguration; composit.: composition. Single-productivity
variables
Explanatory variables
(Exogeneous variables) Training
Employees (-0.6068)
Process automation
Seat config. (+0.9062)
Output composit.
Load factor (+0.6575) Capital
Energy Multifactor
productivity
Competitiveness
Route length
Route density Aircraft use (+0.6320)
Stage length (+0.3039)
Cruise speed (-0.8764)
Seat config. (-0.8229)
Engine performance Labor
average stage length and, in the case of the correlation capital productivity versus aircraft size (seats/aircraft), the larger
correlation occurs among airlines with larger aircraft size.
There is also a large positive correlation between capital
productivity and load factor (+0.6775), and capital
productivity versus aircraft utilization in hours lown
(+0.6320).
In the case of the productivity of energy, a large but negative correlation between energy productivity and
cruise speed (-0.8764) and energy productivity and seat
density (-0.8229), and between labor productivity and
number of employees (-0.6078) was veriied.
The study showed also in the case of the correlation energy productivity versus cruise speed that this correlation is larger among airlines operating with lower cruise speed that can be explained by the aircraft engines consumption, which increases proportionally higher with the increasing speed of aircraft.
A medium positive correlation, according to the
criteria deined in Table 2, can be inferred from energy
productivity growth and stage length (+0.4774) and
energy productivity growth and aircraft utilization (+0.4033). And, inally, a small positive correlation is veriied between energy productivity growth and load factor (+0.623) and labor productivity and load factor
(+0.2397).
The correlation labor productivity versus number of
employees of airlines was negative (-0.6078), which was
expected.
Regarding the correlation of productivity labor and other
variables like stage length, load factor, aircraft utilization, aircraft size and cruising speed, it can be considered low
(correlation with load factor) and very low.
The analysis of the determinants of the single productivity factors labor, capital and energy and their explanatory variables led us to the conceptual model as shown in Fig. 1, which reproduces the inter-relationship between the main productivity elements labor, capital and energy and their explanatory variables. The numbers in brackets, in Fig. 1, represent the Pearson correlation between explanatory variables and the respective single-factor productivity, as shown in Table 3.
CONCLUSION
The survey was conducted with 41 international airlines within the categories Full Service Companies (FSC), Low Cost/Low Fare (LCC) and Regional Companies (RC)
between 2000 and 2005 (and as part of this sampling, the
four major Brazilian airlines were included).
Kendrick’s productivity method was used to measure the multiple-factor productivity growth of linear dependence between the single-factor productivity of labor, capital and energy and the productivity explanatory variables of the airlines analysed.
The results of the research conirmed conclusions
from analysis carried out by other researchers such as Bailey, Graham and Kaplan (1985), Douglas and Miller (1974) and Oum and Yu (2001). The largest positive
correlation was veriied between capital productivity
and cruise speed (correlation of 94%), and capital
productivity growth and seat coniguration (correlation of 90%), which has also been conirmed by Kune, Mulder and Poudevigne (2000) in the conclusion: “that
capital is a key production factor in the airline industry and a large part of the improvement of this economic sector depends on investments in infrastructure and
equipment”.
Kune, Mulder and Poudevigne (2000), and Windle (1991)
also identiied among the most important explanatory variables of airlines productivity light and ground
equipment and materials.
The largest negative correlation was found between energy productivity and cruise speed (correlation of 88%), and between labor productivity and number of employees
(correlation of 60%), conirming Oum and Yu’s study (2001), that identiied, among the important productivity
explanatory variables, the average stage length and the average load factor.
Acknowledgements
The authors would like to thank the National (Brazilian)
Research and Development Council (CNPq, Conselho Nacional de Pesquisa e Desenvolvimento) for Project
Research support (Grant no. 154 203/2006-8), which
made this research possible.
REFERENCES
Bailey, E.E., Graham, R.D. and Kaplan, D.P., 1985, “Deregulating the Airlines”, MIT Press, Cambridge,
Massaschussets.
Caves, D.W., Christensen, L.R. and Diewert, 1982,
Cohen, J., 1988, “Statistical power analysis for the behavioral sciences”, 2nd ed., Routledge Academic,
London.
Distexhe, V., Perelman, S., 1994, “Technical eficiency
and productivity growth in an era of deregulation: the case
of airlines”, Swiss Journal of Economics and Statistics, Vol. 130, No. 4, p. 668-669.
Doganis, R., 1985, “Flying off course: the economics of international airlines”, New York Press, New York.
Douglas, G.W., Miller C.J., 1974, “Economic Regulation of Domestic Air transport: Theory and Policy”, The
Brookings Institution, Washington D.C.
Duke, J, Torres, V., 2005, “Multifactor Productivity Change in the Air Transportation Industry”, Monthly
Labor Review, p. 32-45.
Encaoua, D., 1991, “Deregulating European Airlines”,
International Journal of Industrial Organisation, 1991,
Vol. 9, p. 61-81.
Färe, R., Grosskopf, S. and Sickles, R.C., 2001,
“Productivity of U.S. airlines after deregulation”, Department of Agricultural and Resource Economics,
Oregon State University.
Good, D.H., Nadiri, M.I., Röller, L.H. and Sickles, R.C.,
1993, “Eficiency and Productivity Growth Comparisons of European and US air carriers: a irst look at the data”,
The Journal of Productivity Analysis, Vol. 4, p. 115-125.
International Air Transport Association (IATA), 2001,
“Annual Report (various years)”, Geneve, Switzerland.
International Labor Organization (ILO), 2001, “Restructuring of Civil Aviation: Consequences for Management and Personnel”, Reference Document, Geneve, Switzerland.
Kendrick, D.A., 1996, “Handbooks in Economics, Sectoral Economics, Chapter 6”, Vol. 1, 13, Elsevier, Amsterdam,
Netherlands.
Kune, B.C., Mulder, N., and Poudevigne, P., 2000, “La
mesure du capital et de la productivité dans les Transports:
le cas du transport aérien”, Centre d’Etudes Prospectives
et d’ Informations Internationales, Notes de Syntheses du Sen, Paris, France.
McKinsey Global Institute, 1992, “Service Sector Productivity”, McKinsey and Company Inc., Washington,
D.C.
Moreira, D.A., 1994, “Os benefícios da Produtividade Industrial”, Pioneira, São Paulo, Brazil.
Oum, T.H., Yu, C., 2001, “Assessment of Recent
Performance of Canadian Carriers: Focus on Quantitative
Evidence for evaluating”, Report to the Canada
Transportation Act.
Sickles, R.C., Good, D.H., Getachew, L., 2002, “Speciication
of Distance Functions Using Semi- and Nonparametric Methods with an Application to the Dynamic Performance
of Eastern and Western European Air Carriers”, Journal of
Productivity Analysis, Vol. 17, p. 133-155.