Carlos Isidoro Braga Instituto Tecnológico de Aeronáutica São José dos Campos/SP – Brazil [email protected]
Mirabel Cerqueira Rezende Instituto de Aeronáutica e Espaço São José dos Campos/SP – Brazil [email protected]
Michelle Leali Costa* São Paulo State University Guaratinguetá/SP – Brazil [email protected]
*author for correspondence
Methodology for DSC calibration
in high heating rates
Abstract: Despite the large use of differential scanning calorimetry (DSC) technique in advanced polymer materials characterization, the new methodology called DSC in high heating rates was developed. The heating rate during conventional DSC experiments varying from 10 to 20ºC.min-1,
sample mass from 10 to 15mg and standard aluminum sample pan weighting, approximately, 27mg. In order to contribute to a better comprehension of DSC behavior in different heating rates, this work correlates as high
heating rate infl uences to the thermal events in DSC experiments. Samples
of metallic standard (In, Pb, Sn and Zn) with masses varying from 0.570mg to 20.9mg were analyzed in multiples sample heating rate from 4 to 324°C. min-1. In order to make properly all those experiments, a precise and
careful temperature and enthalpy calibrations were performed and deeply discussed. Thus, this work shows a DSC methodology able to generate good and reliable results on experiments under any researcher choice heating rates to characterize the advanced materials used, for example, for
aerospace industry. Also it helps the DSC users to fi nd in their available
instruments, already installed, a better and more accurate DSC test results, improving in just one shot the analysis sensitivity and resolution. Polypropylene melting and enthalpy thermal events are also studied using both the conventional DSC method and high heating rate method.
Keywords: DSC, High heating rate, Calibration, Thermal analysis, Polymers.
LIST OF SYMBOLS
DSC: Differential Scanning Calorimeter
ASTM: Association Standards Testing Materials
In: Indium Metal
Pb: Lead Metal
Sn: Tin Metal
Zn: Zinc Metal
S: Characteristic Glass Transition DSC Curve Shape
R: DSC system total thermal resistance
R-1 : DSC system total thermal conductivity
Rsample: The sample thermal resistance or the thermal resistance related to the sample
Rinstrument: The thermal resistance related to the instrument
Rsample pan: The thermal resistance related to the sample pan
tan α: Alpha angle is proportional to the total system thermal resistance
PRTs: Platinum Resistances Temperature, temperature direct proportional to the resistance
NATAS: North American Thermal Analysis Society
x: axis “x” in a particular graphic
y: axis “y” in a particular graphic
Tmax: maximumpeak temperature
T0: ideal i rst order temperature transition ∆T: difference between Tmax – T0
∆ Hm: melting enthalpy
β: heating rate applied to the sample
τlag: time constant due to the thermal delay effect Tpeak: peak temperature
Tonset: onset temperature
m: sample mass
dQ/dt: derivative of the heat as function of the time or heat l ow
cp: specii c heat
z: factor to correct the sample mass as function of the heating rate
Dp: standard deviation of a specii c parameter
PP: polypropylene sample Received: 16/05/11
INTRODUCTION
In recent years, the fast development in science and technology of materials has improved the production of new products for the aerospace industry. Among them the advance in polymeric composites are an example of recognized success. So, it is also necessary there are techniques to be able to characterize these new polymeric materials in the adequate way. The most commonly technique used in characterization of polymeric matrices is the thermal analyses, speciically, the differential scanning calorimetry (DSC). However, nowadays new generation of methodology in DSC technique is being used in the study of polymers, the DSC in high heating rates (Poe and Mathot, 2006).
DSC is a thermal analysis technique that measures the difference in energy provided to a sample and a reference material in function of a controlled temperature programming. This technique keeps constant the heat supplied to the sample and reference. A control system (servo system) immediately increases the energy supplied to the sample or the reference, depending on if the process involved is endothermic or exothermic. Therefore, the equipment keeps the sample and the reference at the same temperature. The record of the DSC curve is expressed in terms of heat low versus temperature or time (Vasconcelos, 2010).
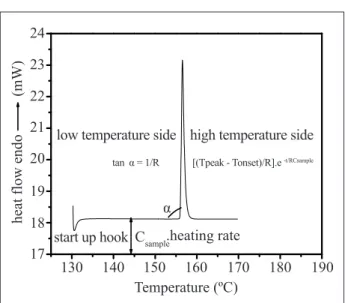
For the proposal methodology presented in this paper does not matter the DSC principle of operation, heat low or power compensation. The thermal events which generate the DSC curves are mainly irst and second order transitions (Canevarolo, 2004). Figure 1 shows the typical DSC curve and represents a standard metal melting, the indium. The melting point maximum peak split the curve in left side of the peak, called here as low temperature side and, right side of the peak, called here as high temperature side. The angle α related to the low temperature side is proportional to R-1, where R is the total thermal resistance of the DSC thermal system, and it is the addition of the sample resistance (Eq. 1), instrument resistance and sample pan resistance (Mathot, 1994; Poel and Mathot, 2006). Or, in another way, R-1 is the system total thermoconductivity.
Rtotal = Rsample+ Rinstrument + Rsample pan (1)
Usually, the worldwide suppliers for DSC purity data analysis software use the curve slope, where tan α ≅ R-1 (van’t Hoff equation) and it is obtained experimentally during the instrument calibration procedure. The “R” value maybe modiied during the furnace ageing, reaching unacceptable values, and this may affect the curve area which is the enthalpy related to the thermal event.
The portion Rsample represents the sample thermal resistance and is heat capacity, sample mass and diffusivity, dependent. While, Rinstrument is the thermal resistance related to the instrument itself and is furnace geometry, furnace mass, furnace material, purge gas type and humidity, dependent. And, inally, Rsample-pan representes the thermal resistances sum between: (a) the sample pan and the equipment, which is sample pan contact area dependent, (b) the sample and sample pan, which is sample contact area dependent, and (c) the thermal resistance related to the sample pan itself, which is mass, material type and purity, dependent (Poe and Mathot, 2006).
Figure 1 shows also, from the left to the right side, the DSC curve beginning, which can appears as descendent or ascendant, indicating how the thermal equilibrium process for both systems takes place: the reference system sample pan and the sample system sample pan. This thermal equilibrium process usually appears during the initial portion of the DSC curve and the reason is a non-appropriate mass balance between both systems, the sample and the reference. The thermal equilibrium above mentioned can also be denominated instrument thermal lag or start up hook.
If the DSC equipment into the laboratory is a heat low principle of operation, the instrument thermal inertia is caused by factors as: mass difference between sample and reference thermocouples, a non homogeneity of the heat distribution into the furnace, and a non homogeneity of the alloy utilized in the detector system. In a power compensation DSC, those factors are related to difference in mass between the platinum resistances Figure 1. Theoretic considerations about a typical DSC curve
(Braga, 2009).
Temperature (ºC) start up hook
low temperature side
tanĮ 5
Į
>[email protected] W5&VDPSOH high temperature side
Csample.heating rate
heat flow endo
(mW)
22 24
thermometer (PRTs), difference in mass between the sample and reference furnace, furnace electronic control response, difference in purity between the furnaces and related parts. This thermal equilibrium lag interferes in the initial temperature utilized in the experiment and will force changes in the sample analysis methodology, mainly in experiments utilizing high heat transfer rates.
Figure 1 shows the DSC indium melting point, the right side of the curve (high temperature side) is system total thermal resistance “R” dependent and, also, sample speciic heat capacity (C) dependent.
For an uniform and perfect crystalline molecular structure, the speciic heat is theoretically ininite, during the whole phase transformation process. Although, that is not applicable to semicrystalline polymers, which show the materials melting point, in the DSC curve, as a peak with certain width (related to the sample: purity, mass, heat capacity, diffusivity and heating rate). As narrower the DSC peak more uniform is the sample crystalline morphology. Above the melting point, the heat capacity increase or decrease smoothly as function of the temperature and those changes are no greater than 5% (Mathot, 1994).
If took into consideration semicrystalline polymers, its thermal conductivity is crystallinity dependent and, obviously, the material thermal history is very important. This property is also affected by the sample anisotropy and, when anisotropy is present, it is recommended appropriate and additional measurements (Santos, 2005).
The polymers thermal conductivity is very low when compared with metallic materials, or some ceramic materials. Taking into consideration the material processing, low thermal conductivity create some real problems: the polymer can be heated and processed in a lower speed and this reduce the production (Santos, 2005). During the cooling, the low conductivity can result in inal products not uniform and shrinkable. It can result cooling stress, extruded deformation, delaminating, molded void etc. (Santos, 2005).
According to Illers (1974) the heating rate is considered as conventional up to 36°C.min-1, and heating rates higher than 36°C.min-1 will be considered high heating rates for DSC experiments or hyper-DSC. Higher heating rates do not mean new DSC equipment, it is a new operation mode for DSC utilizing a proper methodology capable to make possible high heat transfer, cooling or heating the sample utilizing the current equipments already used into the laboratories.
In the year 2000, in the 28° North American Thermal Analysis Society Congress (NATAS) (Pijpers et al., 2000), a work utilizing DSC under high heating rates was presented for the irst time. This study showed how easy is carry out weak transitions experiments, increasing the instrument sensitivity, utilizing high heating rates. To carry out this kind of experiments, Pijpers et al. (Pijpers et al., 2000; Pijpers et al., 2004) suggested to use low mass and small dimensions furnaces. In 2002, the irst publication in periodic about DSC happens, running into high heat transfer, heating or cooling, employed to polymers (Pijpers et al., 2004). In 2004, the academy showed the polymorphs in the pharmaceutical industry being solved by DSC under high heating rates (Gramaglia et al., 2005; Hurtta and Pitkänen, 2004; McGregor et al., 2004; Saunders et al., 2004).
Thus, a conventional DSC analysis, employed to polymers, utilizing 10 and 20°C.min-1 as heating rates, nitrogen or air as purging gas, sample mass around 10mg, aluminum sample pan (~27mg) and temperature range from room temperature to 300°C, the experiment total time is around 28 minutes. However, this experiment can be carried out into high heating rate and take only 1.4min, increasing the number of DSC analysis by day (Poel and Mathot, 2006; Gill and Sauerbrunn, 1993; Pijpers et al., 2000; Pijpers et al., 2004).
Considering to the use of DSC technique in high heat rates, as showed previously, the literature presents some little works in the pharmaceutical area (Gramaglia et al., 2005; Hurtta and Pitkänen, 2004; McGregor et al., 2004; Saunders et al., 2004) and in the characterization of polymer processing in real time (Poel and Mathot, 2006; Gill and Sauerbrunn, 1993; Pijpers et al., 2000; Pijpers et al., 2004; Pijpers et al., 2002). These studies, despite of being rare, show the good potential of this technique in the study of material thermal behavior. Thus, the present work aims to contribute to nationalization and enlargement of the DSC technique in high heating rates use. For this, the present study shows in details the basic principle and the development of this methodology, useable in any DSC equipment and any material, utilizing as proof of concept, the polypropylene polymer characterization.
EXPERIMENTAL Materials
The materials used, in the irst step of this work, are metallic traceable Standards, indium 99.99% pure, tin 99.96% pure, lead 99.98% pure and zinc 99.99% pure. These standards were utilized to perform and study the DSC furnace linearity and symmetry, as well a better DSC understanding, running into high heat transfer.
Also, a polypropylene sample was experimented, kindly offered by Polibrasil Resina S/A company.
Equipment
The instrument utilized in this study is a Perkin Elmer model Pyris 1 connected to a cooling system model Intracooler 2P. It is a power compensation DSC along with low mass furnace, around 1g, which minimize the thermal lag effect.
Calibration
Initially an usual calibration was carried out, utilizing indium standard, following the instrument supplier instructions, ASTM 967 (2008) and ASTM 968 (2008), suggesting to calibrate the temperature and the enthalpy utilizing metallic standards.
Experiments
After perform the calibration utilizing indium standard, carried out under the 967 (2008) and ASTM-968 (2008) conditions, different metallic standards (Zn, In, Pb and Sn) were weighted, approximately, with the same 10mg mass, and tested as they were sample. Those samples were placed, separately, into conventional aluminum sample pan, 27mg mass, and the purpose was to verify the instrument calibration made earlier, also, study the DSC furnace linearity and symmetry. These analyses are performed in the same experimental conditions, sample mass 10mg, heating rate 10°C.min-1, identical test methodology and the same nitrogen purge gas lowing.
In order to study the inluence of mass in the DSC curves obtained in high heating rates, nine different masses of the same sample (indium) were selected, ((20.9; 15.8; 12.7; 9.10; 6.40; 4.03; 1.70; 1.00 and 0.570) mg). These samples were submitted to twelve different heating rates ((4; 9; 16; 25; 36; 64; 100; 144; 196; 225; 256 e 324)°C·min-1). From each DSC curve
the onset melting temperature was obtained, and the peak temperature and the enthalpy associated to each fusion were determined.
Trying to evaluate the thermal resistance decrease, between the DSC furnace and the sample, experiments were carried out utilizing aluminum foil sample pan with 15µm in thickness. The indium metal was used to calibrate the instrument and also used as sample. The calibrations were made in two different heating rates (10 and 100°C.min-1). Multiple heat transfer was tested utilizing the same 12 heating rates performed before. Both, calibration and experiments were carried out with 10.2mg sample mass.
After the instrument calibration being performed and the furnace linearity being veriied, polypropylene experiments were carried out along with 1.00mg sample mass and a set of heating rates of 10, 50, 100, 200, 300, 400, 500 and 600°C.min-1.
RESULTS AND DISCUSSION
Experiments utilizing metallic standards
A proper temperature calibration for high heating rates experiments consists of performing a conventional DSC calibration in an extended temperature range, utilizing primary metallic standards, which have a precise and clear thermal transition in the temperature range of interest. After this irst step calibration, a matrix of calibration has to be illed, experimenting the previously deined standard into different masses and different heating rates, simulating the standard to be a sample, as suggest the literature (Poe and Mathot, 2006).
Once carried out the calibration in the choose heating rates, the DSC furnace linearity and symmetry need to be evaluated. When the DSC furnace presents good symmetry and linearity, the same temperature calibration may be used either for the heating rate or for the cooling rate. If the DSC furnace response is not symmetric in terms of temperature another calibration in the cooling mode is unavoidable (Poe and Mathot, 2006). These long terms calibration procedure seems to be very slow if the user want to make conventional DSC experiments, but it is mandatory if carring out high heat transfer analysis is the user’s choice.
standard, the indium. The experimental values obtained for the onset melting point temperatures, considering all metallic standard studied, are very similar for those respective literature values (Canevarolo, 2004). These results indicate the DSC furnace utilized in this study and presents linearity and symmetry, in the studied temperature range.
For DSC equipment used in present work, Fig. 2 also exhibits a good Pearson correlation coeficient (0.99), indicating that the carried out calibration with just one point of temperature standard is enough to guarantee a proper instrument operation, in a large temperature range. In the case the experimental points do not match with the media straight line, but if the Pearson linear correlation coeficient is good, between 0.98 and 1.00, it means the furnace has a linear behavior.
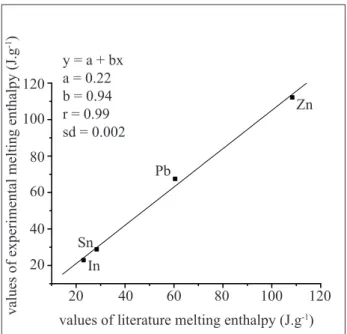
enthalpy values for the DSC analysis is linear, suggesting only one standard material for calibration is enough in a extended temperature range (in this work). In the same way, utilization of at least three temperature standard calibrations, in the range of interest, is recommended, according to the literature suggestion (Poe and Mathot, 2006), with the purpose to get a reliable experimental result. So, after the experimental procedures, the equipment is considered calibrated, in temperature (“x” axis) and in enthalpy (“y” axis).
Figure 2. Experimental melting temperature as function of literature melting temperature using the standards In, Sn, Pb and Zn.
Literature onset temperature (ºC) 150
150
200 200
250 Indium
Tin Y = a + bx a = 0.814 b = 0.99 r = 1.00
Lead
Zinc
250
300 300
350 350
400 400
450 450
Experimental onset temperature (ºC)
In spite of these good results, it is recommended, according to the literature suggestion (Poe and Mathot, 2006), to utilize at least three temperature standard calibrations, in the range of interest, with the purpose to get reliable experimental results.
Those extended calibration procedures were carried out only in the beginning of this work, for a better knowing of the instrument response in an extensive temperature range. A fast way to verify and validate or not the carried out calibration is to make a DSC run with indium metal considering it as a sample. The onset melting temperature indicates if the instrument, already calibrated, is proper to initialize the experiments.
Figure 3 exhibits the enthalpy of fusion calibration, in which the Pearson linear correlation coeficient is 0.98, the
values of literature melting enthalpy (J.g-1)
20 20
40 40
60 60
80 y = a + bx
a = 0.22 b = 0.94 r = 0.99 sd = 0.002
Sn
Pb
Zn
In 80
100 100
120 120
values of experimental melting enthalpy (J.g
-1)
Figure 3. Values of experimental melting enthalpy as function of the values of literature melting enthalpy for the standards In, Sn, Pb and Zn
Tables 1 and 2 exhibit the onset melting temperature and enthalpy of fusion, respectively, obtained from several analyses, several indium masses experimented in different heating rates and the equipment was already calibrated, previously, utilizing 9.1mg of indium mass at 9°C.min-1. All the thermal analyses tests were conducted according to ASTM 3418 (2008), which mention to start the experiment 50°C below the thermal transition studied and the inal temperature 30°C over the studied thermal transition. In the tables, the bold values indicate which the instrument was calibrated.
2006). Also an increase in the enthalpy value is veriied when the same sample is submitted to higher heating rates (keeping the same material and same mass) (Table 2).
Being both thermal events, onset melting temperature and enthalpy of fusion, essentially thermodynamic events, they should not change, neither with mass changes nor with heating rates. And so we can conclude that the variations presented in Tables 1 and 2 suggest a possible problem with the instrument or with the sample. In respect to the irst suspect, the instrument is operating under the supplier speciication and its response is linear, according to the exhausted instrument calibration carried out.
Supported by Illers (1974), Poel and Mathot (2006) and Neuenfeld and Schick (2006) suggestions in the literature, the shift effect in the material melting point temperature, to higher temperature values, is caused by the time the heat takes to diffuse into the sample homogeneously (thermal diffusivity and conductivity). Even so, the sample is not an ideal material, and most of the time it is not 100% pure, and also, the possible presence of polymorphism in the sample can contribute to this behavior. In spite of it all, the DSC
temperature sensor which is located in direct contact with the sample pan and can have its reading affected by the DSC sample pan, which has three times more mass than the DSC sensor. In that situation, the sample pan acts like a thermal resistance between the furnace sensor and the sample, and, an expected delay in the heat transfer takes place.
Among the above-mentioned situations, the sample mass increase helps the thermal inertial factor, which shift the sample onset melting temperature to values greater than those exhibited in the literature.
According to Illers (1974), Poel and Mathot (2006) and Neuenfeld and Schick (2006), the maximum peak temperature concerning the irst order transition, like the melting point temperature, is shifted to higher temperatures with the heating rate increase, due to the sample latent heat be added to the process of fusion, which happen thermodynamically at a constant temperature. Illers (1974) suggests the Eq. 2 to explain these effects.
¨T = Tm ax- T0= 2.¨Hm.R.ȕ+Ylagȕ (2) Table 1 - Experimental values for onset melting temperature using indium sample into the conventional aluminum sample pan,
different masses and different heating rates. The calibration is shown in the table as bold letters
β(°C.min-1) 4.00 9.00 16.0 25.0 36.0 64.0 100 144 196 225 256 324 20.90mg 156.24 157.03 157.03 157.70 158.39 159.55 160.65 161.68 162.78 163.37 163.90 164.67 15.88mg 155.99 156.27 156.73 157.29 157.83 158.72 159.44 160.12 160.73 161.06 161.35 161.83 12.73mg 155.80 156.02 156.36 156.79 157.28 158.16 158.88 159.49 160.00 160.23 160.42 160.79 9.10 mg 156.87 156.54 156.93 157.48 158.13 159.71 161.45 163.35 165.55 166.67 167.66 169.42 6.40 mg 156.18 156.40 156.71 157.07 157.46 158.28 159.19 160.18 161.18 161.84 162.50 163.78 4.03 mg 155.79 155.96 156.15 156.37 156.59 157.04 157.49 157.95 158.43 158.69 158.93 159.50 1.70 mg 155.86 155.98 156.10 156.21 156.33 156.56 156.80 157.04 157.31 157.60 157.70 158.00 1.00 mg 155.94 156.06 156.21 156.35 156.49 156.84 157.26 157.57 158.01 158.23 158.34 158.62 0.57 mg 155.68 155.75 155.83 155.90 155.99 156.15 156.38 156.60 156.76 156.91 157.17 157.42
β(°C.min-1) 4.00 9.00 16.0 25.0 36.0 64.0 100 144 196 225 256 324
20.90mg 29.51 29.65 29.65 29.78 30.09 30.59 31.05 31.71 32.13 32.22 32.74 33.51 15.88mg 29.66 29.74 29.89 30.10 30.31 30.71 31.34 31.75 32.25 32.55 32.69 33.30 12.73mg 29.84 29.96 30.09 30.27 30.46 30.86 31.49 31.96 32.59 32.85 33.25 33.91 9.10 mg 28.68 28.71 28.80 28.89 29.04 29.33 29.48 30.08 30.77 30.78 31.22 32.13 6.40 mg 28.56 29.12 29.22 29.30 29.44 29.86 29.57 30.63 30.46 31.05 31.12 31.73 4.03 mg 29.06 29.09 29.24 29.29 29.42 29.56 30.32 30.01 31.00 31.06 31.47 33.19 1.70 mg 25.19 25.10 25.21 25.19 25.24 25.37 26.52 26.08 26.68 26.19 25.30 25.38 1.00 mg 27.54 27.41 27.57 27.62 27.73 27.93 27.46 27.99 28.30 28.65 29.88 32.51 0.57 mg 27.72 27.40 27.33 26.88 27.05 27.11 26.44 28.19 28.86 30.96 27.51 28.33 Table 2 - Experimental values for enthalpy of fusion using indium sample into the conventional aluminum sample pan, different
where: Tmax is the maximum peak temperature; T0 is the ideal irst order transition, real melting point temperature; ∆Hm is the transformation enthalpy; R is the system thermal resistance; τlag is the time constant due to the thermal delay effect, which depends on the heat capacity, the thermal resistance and the thermal system; where β is the heating rate.
It is very important to mention the thermal inertial effect observed in the thermodynamic experimental measurements, is huge in polymer materials, in which the thermal conductivity and diffusivity are very low, when compared along with metallic materials (Illers, 1974).
According to the ASTM D3418 (2008), the onset melting temperature values for reproducibility should be within ±4.2°C and ±7.3% for the enthalpy. The data obtained during the experiments, and exhibited in Tables 1 and 2, have different experimental values (changing the mass and the heating rate). Considering the differences cited in the ASTM D3418, these both onset melting point temperature and enthalpy of fusion are partially reproducible and may be accepted. Keeping the same idea, based on Table 1, the onset melting point temperature values are satisfactory for the entire list of studied masses up to 100°C.min-1 heating rate.
Evaluating the enthalpy values, they also attend the permitted error cited in ASTM up to 64°C.min-1 heating rate. Thus, considering a conservative criterion for choice, the studies by DSC may be carried out with the conventional DSC calibration (usually performed at 10°C.min-1 heating rate and 10mg sample mass) up to 64°C.min-1 and the sample mass must to be between 0.50 and 20mg.
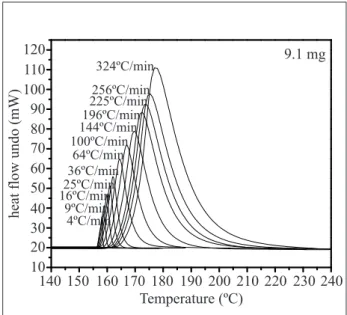
Two sample masses were chosen as representing the studies in this work, 9.10mg sample mass (Fig. 4) and 1.0mg sample mass (Fig. 5), both are indium samples. Figures 4 and 5 exhibit the curves for the indium sample (heat low as function of temperature) in different heating rates using conventional aluminum sample pan. It can be veriied that the heating rate increment shifts the thermal event peak temperature to higher values and the peak becomes higher and wider. These effects are caused by sample mass, sample diffusivity and sample purity.
Figure 4 shows the left side of the indium melting point peaks (low temperature side) in which the left sides are parallel between each other, in other words, the α angle does not change, it is kept basically equal for different heating rates studied. In a similar way, in the literature is found α angle not modiied up to 36°C. min-1 (Mathot, 1994; Poe and Mathot, 2006). In this
case, the sample thermal resistance presents a greater contribution to the system total thermal resistance (R), while the instrument thermal resistance and the sample pan thermal resistance has an insigniicant contribution to the system thermal resistance, and this information matchs with the literature (Mathot, 1994).
Figure 4. DSC curves showing 9.1mg of indium sample experimented at different heating rates and basically the (α) alpha angle is the same
140 10 20 30 40 50 60 70 80 90 100 110 120
150 160
Temperature (ºC)
9.1 mg
heat flow undo (mW)
170 180 190 200 210 220 230 240 4ºC/min
9ºC/min 16ºC/min25ºC/min
36ºC/min 64ºC/min 100ºC/min
144ºC/min196ºC/min 225ºC/min256ºC/min
324ºC/min
Confronting Figs. 4 and 5, the peaks in the left sides (low temperature sides) show different behaviors, in both igures. The peak slope, to the low temperature side (α angle), related to the lower sample mass in the test (1.00mg), presents greater heating rate dependence than the larger sample mass in the test (9.10mg).
The purity data analysis (purity software for DSC experiments) utilizes the van’t Hoff equation and considers in its algorithm the α angle (Mathot, 1994). So, the purity studies carried out by DSC equipments have to take a special attention to chose each test sample mass (1 to 3mg) as recommended by ASTM E928 (2008). This procedure is very important to obtain reliable and repetitive results. Smaller sample mass increases the probability to get purity results non-reproducible and different from the initial expectations (Mathot, 1994).
utilized in this work shall be veriied each time a new equipment, model or brand.
Figures 4 and 5 show, clearly, increasing the heating rate in the DSC experiments, when the sample mass is around 10mg, the onset melting temperature shifts to higher values. However, decreasing the sample mass for values around 1mg, very low shift in the onset melting temperature is promoted (as shown in Table 1). Lower sample mass smaller onset melting temperature shift is observed. The diffusivity and thermal conductivity are the main responsible for the thermal delay, and, into this low mass experimental conditions, the sample response is very close to the thermodynamic theory (Neuenfeld and Schick, 2006; Turi, 1981).
indium melting curve in the high temperature side is important to calculate the DSC curve area, and the DSC curve area is proportional to the enthalpy of fusion in the DSC experiments.
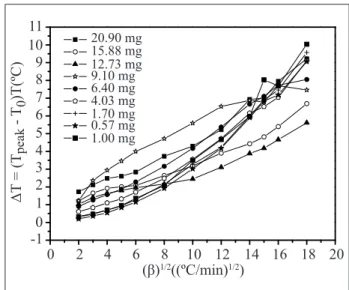
Figure 6 shows a linear relationship between the sample mass and the heating rate up 36 °C min-1 does exist. And, after this value, a more complicate relationship between these results takes place. So, as cited in the literature (Illers, 1974; Neuenfeld and Schick, 2006; Poe and Mathot, 2006), the heating rate is considered conventional up to 36°C.min-1. Above this value this parameter is assumed to be high, and the curve shows to be strongly sample mass dependent. For small samples (<1mg) the ∆T increase is directly proportional to the heating rate square mean root (Poe and Mathot, 2006) and the heat low amplitude is higher compared with the linear response.
20.90 mg 15.88 mg 12.73 mg 9.10 mg 6.40 mg 4.03 mg 1.70 mg 0.57 mg 1.00 mg
0 2
-1 0 1 2 3 4 5 6 7 8 9 10 11
4 6 8
ȕ1/2&PLQ1/2
ǻ7
7
peak
70
7&
10 12 14 16 18 20
Figure 6. Indium peak temperature minus onset melting temperature as function of heating rate (β) square root
Temperature (ºC)
heat flow endo up (mW)
140 150 160 170 180 190 200 210 220
4ºC/min9ºC/min 16ºC/min
25ºC/min 64ºC/min
100ºC/min 144ºC/min
196ºC/min 225ºC/min 256ºC/min 324ºC/min
1.00 mg 27
26 25
24
23 22 21
20 19
18 17
Figure 5. DSC curves showing 1.00mg of indium sample experimented at different heating rates and a great
difference between the (α) alpha angles
In an experiment, in which the same sample type and quantity is submitted to different heating rates, and the DSC curve shift only in the “x” axis (this means, time or temperature), this behavior means the sample thermal resistance has greather impact in the thermal system response, or, the thermal resistance external to the sample has a minimum contribution to the thermal system response. If the opposite case happens, it means, the DSC curve shifts only in the “y” axis, heat low, so, the thermal resistance external to the sample has the major impact in the thermal system response and the sample thermal resistance is meaningless.
The relationship (Tpeak - Tonset) shows how DSC curve depends on the heating rate and the sample mass. Considering that the DSC curve shape affects the total area of the thermal transition, so, the shape of the
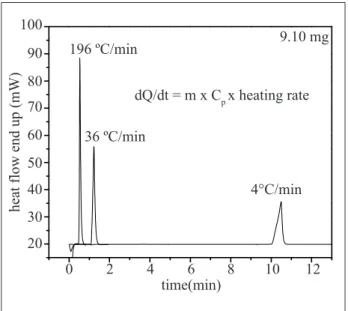
Figure 7 shows the DSC curve for a 9.10mg indium sample, studied in three different heating rates (4, 36 and 196) °C.min-1 as function of time. For the same type of sample, three distinct duration times of the tests, for different heating rates, are observed. The indium melting temperature occurs in less than 1min when the heating rate is set to 196°C.min-1. Also, the melting point peak becomes narrower, heighter and proportional to the heating rate increase. However, the peak area, related to the energy necessary to melt the indium metal, is the same for any heating rate used (Canevarolo, 2004; Ionashiro and Giolito, 1980; Wendlandt, 1986; Wunderlich, 1990).
instrument sensitivity is increased proportionally to the heating rate increase. This afirmative is conirmed, experimentally, in Figure 7. On the other hand, the heating rate decreasing improves the instrument resolution and decreases the instrument sensitivity (Kasap, 1997; Chagas, 1999).
dQ
dt = m.cp.` (3)
where: m is the sample mass, cp is the sample speciic heat, β is the heating rate and dQ/dt é the derivative of heat as function of time which is the heat low.
Even so, the sample pan mass, used in the experiment is fundamental to be considered. So, the aluminum foil sample pan has been considered in this experiment (~5mg) instead of conventional aluminum sample pan (~27mg). Thus, the aluminum foil sample pan will promote a much better heat transfer in the system: furnace, sample pan and sample.
Table 3 exhibits the experimental results using 10.2mg indium sample mass in an aluminum foil sample pan which was submitted to different heating rates. The DSC instrument was calibrated using 10mg of indium at 10°C.min-1 and, both, calibration and experiments were executed using aluminum foil sample pan. The experiments were all done under ASTM E 3418 (2008). Although the conventional aluminum sample pans were replaced by aluminum foil sample pan, the obtained results kept the same tendency, shifting the DSC thermal events to higher temperature values when compared to the available literature. The same tendency happens to the melting enthalpy values.
Table 4 exhibits the experimental values for enthalpy of melting, peak temperature and onset temperature for melting, for a 10.2mg-indium sample, heated at different heating rates, with the instrument calibrated at 100°C.min-1 and either the calibration and the experiments were performed in aluminum foil sample pans. The results obtained, either the measured onset melting temperature or the measured enthalpy of melting, are inside the error permitted by the ASTM 3418 (2008). This behavior suggests that experiments performed in high heating rates and using aluminum sample pan improve the results. Another approach is related to sample pans, which can be made of different material types (copper, aluminum, stainless steel, platinum, gold, glass and others) and can change the sample pan thermal conductivity, the heat capacity or the thermal diffusivity during the experiments, which modify the heat transmission in the sample direction and, consequently, the inal DSC curve shape.
Figure 7:Heating rate affecting the instrument resolution and sensitivity, from the equation dQ/dt = m.cp.β
time(min) 36 ºC/min
4°C/min 196 ºC/min 9.10 mg
dQ/dt = m x Cp x heating rate
0 20 30 40 50 60 70 80 90 100
2 4 6 8 10 12
heat flow end up (mW)
β(°C.min-1) 4.00 9.00 16.0 25.0 36.0 64.0 100 144 196 225 256 324
Tonset (°C) 156.31 156.55 156.88 157.25 157.83 158.44 159.33 160.25 160.88 161.28 161.60 162.19 Tpeak (°C) 157.99 159.19 158.95 159.79 160.73 163.19 164.77 166.44 168.37 168.85 169.92 171.53
∆H (J.g-1) 28.19 28.43 28.55 28.70 28.73 28.96 29.29 29.48 29.96 30.00 29.99 30.71
Table 3 - Experimental values for 10.2mg indium sample and the calibration was carried out at 10°C.min-1, both, calibration and
experiments carried out into aluminum foil sample pan
β(°C.min-1) 4.00 9.00 16.0 25.0 36.0 64.0 100 144 196 225 256 324
Tonset (°C) 153.51 153.71 153.31 153.72 154.20 155.15 156.71 157.59 158.41 158.55 158.79 159.42 Tpeak (°C) 154.86 155.52 155.85 156.64 157.54 159.08 161.92 163.92 165.93 164.51 165.37 166.52
∆H (J.g-1) 27.47 27.52 27.70 27.76 27.87 28.24 28.39 28.53 28.88 28.41 28.89 29.20
Table 4 - Experimental values for 10.2mg indium sample and the calibration was carried out at 100°C.min-1, both, calibration and
Besides this, using the aluminum foil sample pan in the experiments, the temperature thermal lag has decrease and, as consequence, the onset melting temperature standard deviation (Dp). Comparing the onset melting temperature presented in Table 2 in the line of 9.10mg with the values presented in Table 3, the standard deviation, Dp,changed from 4.51 to 2.04 and to 2.27 for the values presented in Table 4.
Analogous to the studies already mentioned and carried out for the onset melting temperature, the standard deviation of 1.13 calculated for the melting enthalpy, presented in Table 2, line of 9.10mg, goes down to 0.75 (Table 3) and to 0.55 according to Table 4. These decreases observed in the standard deviation values show experimental results nearer to the literature results, either for onset melting temperature or for enthalpy of melting, as both are thermodynamic values and should not be heating rate dependent.
According to Table 4, the onset melting temperature experimental values are inside the permitted error, in accordance with ASTM D3418 (2008), up to 144°C. min-1 heating rate. On the other hand, the melting peak temperature values are inside the ASTM D3418 (2008) tolerance limit up to 36°C.min-1. And, finally, the values of enthalpies of melting are inside the permitted error for the heating rates studied in the present work.
The heat generated by the DSC furnace is transmitted to the sample environment, reachs the sample pan, the interface area between the sample and the sample pan, and inally, propagates across the sample. This propagation of energy does not occur instantaneously, it takes a time to reach the entire sample and, consequently, the sample thermal equilibrium. In the DSC instruments, usually, the heat transfer occurs mainly by thermal conduction, approximately, from -150 to 600oC, and, in higher temperatures, the thermal radiation process takes place and becomes the main source of heat in the DSC thermal system. From above this temperature in which the type of heat transfer changes, it is also important to select a proper purge gas before start the experiment, taking into consideration the gas thermal conductivity.
As the smaller the sample, easier to reach the thermal equilibrium across the sample in a shorter time. This thermal equilibrium is dependent of sample characteristics and this phenomenon is known as thermal lag or thermal inertia, caused by the sample thermal diffusivity process.
As bigger the ratio between the sample pan mass and the sample mass utilized in a specific experiment,
larger is the shifting effect in the thermal events (onset melting temperature and peak temperature) due to the sample pan thermal diffusivity effect. These statements drive to three different situations which can happen during the DSC experiment: sample mass loss during the heating process, sample mass gain in oxidative atmosphere or the sample mass stays constant during the experiment. In each case the ratio between the sample pan mass and sample mass has different values (Braga, 2009). Also this ratio affects directly the instrument resolution.
The shift in both onset melting temperature and peak temperature during the DSC experiments is caused by the sum of diffusivities: sample diffusivity, furnace diffusivity and sample pan diffusivity. The DSC temperature calibration purpose is to minimize these thermal diffusivity effects.
For a better understanding, an analogy is propose: considering the heat as a luid lowing to the sample direction, the DSC sample pan acts like a “screen” avoiding the heat to reach the sample; the sample pan absorbs heat before sample. As the higher the sample pan heat capacity (copper, aluminum, stainless steel, platinum, gold, silver etc.), smaller is “screen”, becoming more dificult the heat to reach the sample. The opposite is true (Braga, 2009). Thus, if the “screen” size is dependent sample pan temperature, so, the quantity of heat which reaches the sample varies, which suggests it can lightly change the heating rate established, by the DSC operator, in his working plan.
Thus, variations in the DSC curve shape can be observed consequently in the curve’s area, which is numerically equal to the enthalpy of melting. This condition explains why the melting enthalpies values vary during experiments with high heating rates or high heat transfer (Table 2 to 4) (Braga, 2009).
Polypropylene experiments
After the detailed study utilizing several metallic standards for a better DSC instrument understanding, its limitations and responses when running into different heating rates, experiments in a polymeric sample, the polypropylene (PP), which was submitted to high heat transfer trying to simulate industrial processing, as extrusion or injection, were carried out.
The polypropylene melting temperature which is associate with the material crystalline portion is in the range of 112 to 208°C (the more frequent value is 160°C) and the melting enthalpy in the range of 40 and 209 J.g-1 depends on the crystallinity, that can change from 40 to 70% (Canevarolo, 2004; Wellen and Rabello, 2005; Mothé and Azevedo, 2002; ASTM E 793, 2006; ASTM E 794, 2006).
ASTM D3418 (2008), ASTM E793 (2006) and ASTM E794 (2006) describe the procedures to determine the melting temperature, melting enthalpy and enthalpy of crystallization for polymers. As suggest the ASTM D3418 (2008), the polymer should be submitted to a irst heating at a higher heating rate, to erase the sample thermal history, followed by a lower cooling rate to allow the polymer crystal to be organized, following by another heat in which the polymer melting temperature is registered.
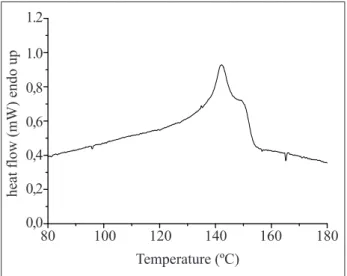
Figure 8 exhibits the DSC curve which is related the second PP melting using 1mg sample mass and, both, heating and cooling rate at 10°C.min-1 and aluminum foil sample pan. Table 5 exhibits the melting and crystallization temperatures, as well the respective enthalpies of melting are in Figure 8. Thus, the melting temperature for this PP sample is 142°C and its enthalpy is 45J.g-1, suggesting low crystallinity for this polymer, when compared with the literature values (Canevarolo, 2002).
The supercooling degree, which is expressed as being the difference between the onset melting temperature and crystallization temperature, is 29°C. The small difference between the melting and crystallization peak areas (15%) is following the literature, as good as 20% for polymeric material (Canevarolo, 2002)
Figure 9 exhibits the DSC crystalline melting curves, at the second PP heating, obtained at different heating rates, and 1mg sample mass inside of an aluminum foil sample pan. The instrument calibration was performed for each heating rate studied. All the samples were, at the begging, heated and cooled at 10°C.min-1.
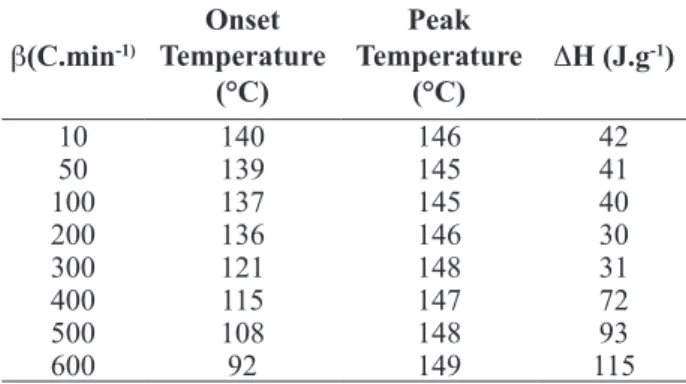
Table 6 presents the melting temperature and enthalpy for each heating rate tested. It is observed, as expected, the onset melting temperature varies between 121 to 140°C. The melting peak temperature shifts very lightly between 145 to 148°C and the enthalpies of fusion obtained are inside of an acceptable range of 33%.
The error founded in the enthalpy values, may be explained based in the low thermal conductivity values imputed for polymers materials 0.03 to 0.61 (W.m -1.°C-1) (Chagas, 1999; Halliday and Resnick, 1992). This
80 0,0 0,2 0,4 0,6 0,8 1.0 1.2
100 120 140 160 180
Temperature (ºC)
heat flow (mW) endo up
Figure 8. Polypropylene DSC curve in the second heating, experimenting 1mg sample mass and 10 °C.min-1 heating rate
Event Tonset (°C) Tpeak (°C) ∆H (J.g-1)
First heating 140 146 42
Second heating 133 142 45
Cooling 104 101 -53
Table 5 - Values of polypropylene thermal behavior, studied at 10°C.min-1
80 80
60
40
20
0
100 120 140 160 180 200 220
Temperature (ºC)
600 ºC.min-1
500 ºC.min-1
400 ºC.min-1
300 ºC.min-1
200 ºC.min-1
100 ºC.min-1
50 ºC.min-1
10 ºC.min-1
heat flow endo up (mW)
Figure 9. Polypropylene DSC melting curves under different heating rates
during the experiments for different heating rates are not appropriate for the tests performed in heating rates greater than 100°C.min-1, as the enthalpies of fusion values do not match each other.
same instrument and it permits that the better and deep characterization of advanced material used in aerospace ield be done. As expected by the conventional thermal analysis theory, for the same sample mass if the heating rate increase occurs the shift of the transition temperature for higher values, caused by the thermal inertial effect. Similar behavior is observed for the enthalpy of fusion values. The indium sample study, utilizing different masses and different heating rates, shows that conventional analyses are considered up to 36 °C.min-1. Above this heating rate is observed the mass dependence. A greater dependence with the heating rate, proportional to the total system thermal resistance, is also observed for lower mass values. Same sample mass and different heating rates promote curve shifts only in the “x” axis (time or temperature), which means the sample thermal resistance affect predominantly the thermal system response. To minimize the thermal gradient inside the sample, if the heating rate is increased by a “z” factor, the sample mass should be reduced by the same factor “z”. The use of aluminum foil sample pan (~5mg) is recommended instead of conventional aluminum sample pan (~27mg), to promote a better heat transfer among furnace, sample pan and sample. The high heating rate mode in the DSC may be utilized to characterize advanced polymer materials, preferentially to ind the melting peak temperature and crystallization temperature, but these measurements depend greatly on the polymers thermal properties.
ACkNOwLEDgMENT
The authors express gratitude to the National Council for Scientiic and Technological Development (CNPq) by the inancial support processes 305478/2009-5 and 152384/2007-3.
REFERENCES
ASTM D3418-08, Association Standards Testing Materials, 2008, ASTM D3418-08: “Test method for transition temperatures of polymers by differential scanning calorimetry”, Philadelphia, USA.
ASTM E793, Association Standards Testing Materials, 2006, ASTM E793: “Test method for enthalpies of fusion and crystallization by differential scanning calorimetry”, Philadelphia, USA.
ASTM E794, Association Standards Testing Materials, 2006, ASTM E794: “Test method for melting and crystallization temperatures by thermal analysis”, Philadelphia, USA.
ASTM E928, Association Standards Testing Materials, 2008, ASTM E928: “Test method for purity by differential scanning calorimetry”, Philadelphia, USA.
β(C.min-1)
Onset Temperature
(°C)
Peak Temperature
(°C)
ΔH (J.g-1)
10 140 146 42
50 139 145 41
100 137 145 40
200 136 146 30
300 121 148 31
400 115 147 72
500 108 148 93
600 92 149 115
Table 6 - Onset melting temperatures, peak temperatures, and melting enthalpies, obtained in 1mg of polypropylene sample into an aluminum foil sample pan. Samples were submitted to different heating rates
Supported in the literature results, it is known that the sample mass reducing is inversely proportional to the heating rate increase (Poe and Mathot, 2006; Poe and Mathot, 2007) which can minimize the thermal inertial effect inside the sample, helping to obtain good enthalpy results. This study was not carried out in this work, due to the laboratory where the experiments were executed do not have an analytical balance limitation to measure masses lower than 1mg. However, it can be confirmed that DSC in high heating rates mode guarantees a better accuracy to characterize polymers, specially to measure the peak temperatures of the crystalline fusion as this value is lightly affected by the heating rate imposed to the thermal system, applying 1mg sample mass.
It is mandatory to be mentioned that the DSC instruments in high heating rate mode do not replace the conventional DSC mode, but the high heating mode appears as an additional tool to amplify the researchers capability to investigate a sample, in low or high heating rates, utilizing the same instrument already installed in the laboratory.
CONCLUSIONS
ASTM E967, Association Standards Testing Materials, 2008, ASTM E967: “Standard practice for temperature calibration of differential scanning calorimetry and differential thermal analyzers” ,Philadelphia, USA.
ASTM E968, Association Standards Testing Materials, 2008, ASTM E968: “Standard practice for heat low calibration of differential scanning calorimeters” Philadelphia, USA.
Braga, C. I., 2009, “Desenvolvimento de metodologia para análises de DSC em altas taxas de transferência de calor” (in Portuguese), Master Thesis, Instituto Tecnológico de Aeronáutica, S.J.Campos, S.Paulo, Brazil.
Canevarolo Jr, S. V., 2002, “Ciência dos Polímeros”, Artliber Editora, São Paulo, Brazil.
Canevarolo Jr, S. V. et al., 2004, “Técnicas de Caracterização de polímeros”, Artliber Editora, São Paulo, Brazil, pp.209-285.
Chagas, A. P., 1999, “Termodinâmica Química”, Editora da Unicamp, Campinas, São Paulo, Brazil.
Gill, P. S.; Sauerbrunn, S. R. & Reading, M., 1993, Journal of Thermal Analysis and Calorimetry, Vol. 40, pp. 931-939.
Gramaglia, D., Conway, B.R., Kett, V.L., Malcolm, R. K., Batchelor, H. K. 2005, “International Journal of Pharmaceutics”, Vol. 301, pp. 1-5 .
Halliday, D., Resnick, R., Walker, J., 1992, “Fundamentos de Física Gravitação, Ondas e Termodinâmica” (in Portuguese), Vol. 2, São Paulo, Brazil, LCT.
Hurtta, M. Pitkänen, I., 2004, “Thermochimica Acta”, Vol. 419, pp. 19-29.
Illers, K. H., 1974, “DSC calibration during cooling. A survey of possible compounds”, European Polymer Journal, Vol. 10, pp. 911-916.
Ionashiro, M.; Giolito, E. I.,1980, “Nomenclatura, Padrões e Apresentação dos Resultados em Análise Térmica”, Parte II. Cerâmica, Vol. 34, pp. 225-230.
Kasap, S.O.,1997, “Principles of Electrical Engineering Materials and Devices”, New York, USA, Irwin Professional Publishing.
McGregor, C., Saunders, M. H., Buckton, G., Saklatvala, R. D., 2004, “Thermochimica Acta”, Vol. 417, pp. 231-237.
Mothé, C. G., Azevedo, A. D., 2002, “Análise térmica de materiais”, (in Portuguese), iEditora, Rio de Janeiro, Brazil.
Mathot, V. B. F., 1994, “Calorimetry and Thermal Analysis of Polymers”, Hanser Publishers, New York.
Nascimento, M. L. F., 2000, “Condutividade elétrica de vidros de boratos, silicatos e sílico-sulfatos de íons alcalinos” (in Portuguese), Master Thesis, Universidade de São Paulo, Physics Institute, São Paulo, Brazil.
Neuenfeld, S., Schick, C., 2006, “Verifying the symmetry of differential scanning calorimeters concerning heating and cooling using liquid crystal secondary temperature standards”. Thermochimica Acta, Vol. 446, pp. 55-65.
Pijpers, F.J. et al., 2000, “Metastability in polymer systems studied under extreme conditions: high pressure, scan-iso T-t ramps and high scanning rates”, Proceedings NATAS (North American Thermal Analysis Society) 28th Conference, October 4-6,Orlando, USA.
Pijpers, F.J. et al., 2002, “High-Speed calorimetry for the study of kinetics of (de)vitriication; crystallization and melting of macromolecules”, Macromolecules, Vol. 35, pp. 3601-3613.
Pijpers, F.J. et al., 2004, “Metastability In Polymer Systems Studied At Extreme Conditions,Including Low to Very High Scanning Rates”, Proceedings NATAS (North American Thermal Analysis Society) 30th Conference.
Poel, G. V. & Mathot, V. B. F., 2006, Thermochimica Acta, Vol. 446, pp. 41-54.
Poel, G. V., Mathot, V. B. F., 2007, Thermochimica Acta, Vol. 461, pp. 107-21.
Santos, W. N., 2005, “Polímeros: Ciência e Tecnologia”,Vol. 15, No. 4, pp. 289-295.
Saunders, M., Podluii, K., Shergill, S., Buckton, G., Royall, P., 2004, “International Journal of Pharmaceutics”, Vol. 274, pp. 35-40.
Turi, E., 1981, “Thermal Characterization of Polymer Materials”, Editor Academic Press Inc, Boston, USA.
Vasconcelos, G. C., Mazur, R.L; Botelho, E.C, Rezende, M.C, Costa, M.L. 2010, “J. Aerosp.Technol. Manag.”, Vol. 2, No. 2, pp. 155-162.
Wellen, R., Rabello, M., 2005, “Journal of Materials Science”, Vol. 40, No. 23, pp. 6099-6102.
Wendlandt, W. W., 1986, “Thermal Analysis”, Wiley, edition3, New York, USA.