Key words: traffic accidents, driver, citizenship, vehicle type, United Arab Emirates.
Palavras-Chave: acidentes de tráfego, motorista, cidadania, tipo de veículo, Emirados Árabes Unidos.
Recommended Citation * Email: [email protected].
Research Directory
Submitted 31 Jul 2012; received in revised form 9 Sep 2012; accepted 10 Sep 2012
Driver and vehicle type parameters’ contribution
to traffic safety in UAE
[A contribuição dos parâmetros de motorista e tipo de veículo para a segurança do tráfego nos Emirados Árabes Unidos]
ALHOSN University, United Arab Emirates, ALHOSN University, United Arab Emirates, University of New Brunswick, Canada, ALHOSN University, United Arab Emirates
Resumo
Estudos anteriores de segurança de tráfego mostraram claramente que o motorista ou o fator humano é um dos principais contribuintes para acidentes de trânsito. Assim, para melhor compreender a natureza do acidente é crucial analisar todas as características relacionadas aos motoristas envolvidos nos mesmos. Este artigo aborda esse aspecto por meio da utilização de um conjunto de dados representativos dos acidentes de trânsito dos Emirados Árabes Unidos no período entre 2007 e 2010. O foco principal do artigo é analisar a relação entre acidentes de trânsito e a cidadania de origem do motorista para todos os tipos de veículos envolvidos. Isso se deve ao fato de que os motoristas nos Emirados Árabes Unidos são de origens diferentes (mais de 100 nacionalidades) e, portanto, torna-se muito importante identificar cidadanias com maior envolvimento em acidentes de trânsito para cada tipo de veículo. Propicia-se que as autoridades de trânsito possam dar atenção especial a estas cidadanias e tipos de veículo, por meio de programas especiais de conscientização de trânsito, sistemas de multas ou outras medidas preventivas destinadas a reduzir a freqüência de acidentes e seus níveis de gravidade. Os resultados indicaram que, para todos os tipos de veículos, os motoristas nacionais dos Emirates Árabes representam a cidadania com a maior taxa de envolvimento em acidentes de trânsito (30,02%), seguido por paquistaneses (21,26%) e indianos (11,95%). Estatísticas de acidentes de tráfego com veículos leves mostram uma tendência geral de aumento no número de acidentes para todas as cidadanias. A principal contribuição do trabalho é a sua singularidade na análise do banco de dados desses acidentes após a implementação de uma nova e unificada lei de trânsito nos Emirados Árabes Unidos.
Alkheder, S. A., Sabouni, R., Naggar, H. E. and Sabouni, A. R. (2013) Driver and vehicle type parameters’ contribution to traffic safety in UAE. Journal of Transport Literature, vol. 7, n. 2, pp. 403-430.
Sharaf A. Alkheder*, Reem Sabouni, Hany El Naggar, Abdul Rahim Sabouni
Abstract
Former traffic safety studies showed clearly that driver or human factor is a major contributor to road accidents. Hence, to better understand the traffic accident nature it’s so vital to analyze all characteristics related to drivers involved in these accidents. This article focuses on this aspect through using a dataset representing UAE traffic accidents in the time interval between 2007 and 2010. A major focus was given in this article to analyzing the relation between traffic accidents and driver citizenship for all types of involved vehicles. This was due to the fact that drivers in UAE came from different backgrounds (over than 100 citizenships) and hence it’s so important to identify citizenships with major involvement in road accidents for each vehicle type. This will allow traffic authorities to give special attentions to these citizenships and vehicle types through special traffic awareness programs, fining system or other preventive measures aiming to reduce the accidents frequency and severity levels. Results indicated that for all types of vehicles emirates nationals drivers represent the citizenship with the highest involvement rate in traffic accidents (30.02%) followed by Pakistanis (21.26%) then comes the Indians drivers with a percentage of 11.95%. Light vehicle type traffic accidents statistics shows that a general trend can be seen for all citizenships where there is an increase in the number of traffic accidents over the course of the three years. The main contribution of the paper is its uniqueness in analyzing such accidents database after the implementation of the new unified traffic law in UAE.
Introduction
Over the past few decades developing countries witnessed an excessive growth in population
associated with large percentage of car ownership due to economic prosperity and reduction
in car prices over time. This increased dramatically the traffic volumes on the street networks
and caused – since the rate of increase in car ownership is way faster that the rate of
developing new transportation infrastructure – serious traffic problems such as road accidents,
traffic jams and excessive time delays. Investigating traffic accidents – as a multi-dimensional
problem of engineering, social and legislative nature - is a research priority for most countries
in order to reduce both accidents severity and frequency by investigating the three accidents
stages: pre-accident, time of accident and post-accident stage. Many developing countries are
in the process of developing complete digital databases for traffic accidents with all related
attributes to be used in comprehensive analysis aiming to identify mainly the reasons behind
traffic accidents and the best countermeasures to reduce the extent of this phenomenon.
A study done by Treat et al. in 1977 showed that human was the major contributor to road
accidents (over than 90% involvement as a contributing factor and 57 % as a single factor)
followed by environmental (4.7% as a single factor) and vehicle (2.4% as a single factor)
respectively. Most accidents can be related to aggressive & faulty driving (see Bener et al.,
2004). Young driver deaths represent the majority among different categories of fatalities due
to lack of experience and knowledge in traffic safety issues (Malhotra, 1990; Trivedi and
Rawal, 2011). Some models (Gregersen and Bjurulf, 1996) can be seen in the literature that
were developed to study young driver contribution to road accidents with special attention to
their driving behavior. Other studies showed that the physical condition of the driver plays an
important role in accidents occurrence (Bekibele et al, 2007). Among these are drug usage
(Asogwa, 1980), driver vision problems (Humphries, 1987; Toczolowski et al, 1996; Szlyk,
1995) and driver fatigue (Horne and Reyner, 2000) that were studied extensively in the
literature.
Causalities and fatalities in GCC countries from road accidents showed a higher value as
compared to developing countries at same levels of car ownership ( Bener and Crundall ,
behavior plays a major role in these accidents and hence needs an in depth investigation to
identify and quantify the extent of the problem in order to put realistic and effective safety
solutions.
The paper is mainly organized into three sections. The first section reviews the UAE road
accidents over the past decade and its relationship to the drive licensure. Then another section
is introduced to discuss the characteristics of the involved drivers in road accidents with a
major focus on the role of driver citizenship. Finally, the third section studies the trend of
traffic accidents over time especially in the period following the implementation of the unified
traffic law.
1. UAE Accidents and Driver Licensing
Driver has a very important role in traffic accidents and most of the time he/she holds the
major responsibility as he/she has the highest control level on the road. In the coming sections
we focus on identifying the relationships that drivers' licensing, drivers' citizenships and
vehicle types have with traffic accidents. Reviewing the statistics related to driver licensing
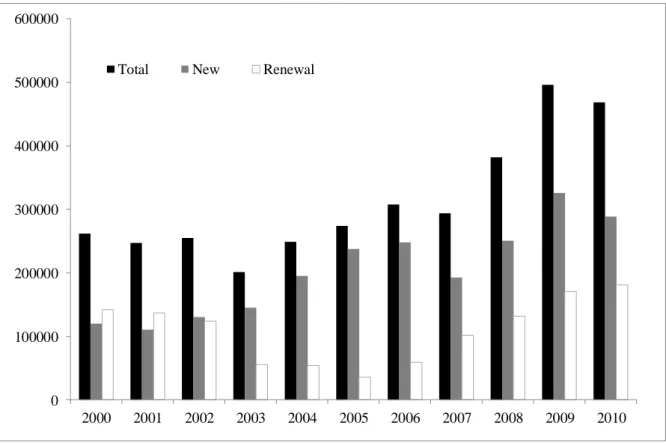
over the past 11 years from 2000 to 2010 (Figure 1) reveals that the total number of driver's
licenses issued over these years has increased significantly reaching a total number of about
496138 in 2009 while it was 262045 in 2000. The majority of these licenses are issued for the
first time (new licenses especially after 2003) while the rest are renewals. The large number
of newly issued licenses can be related to traffic accidents in that most of new license holders
are usually lack the driving experience which increase the risk of getting involved in a traffic
accident.
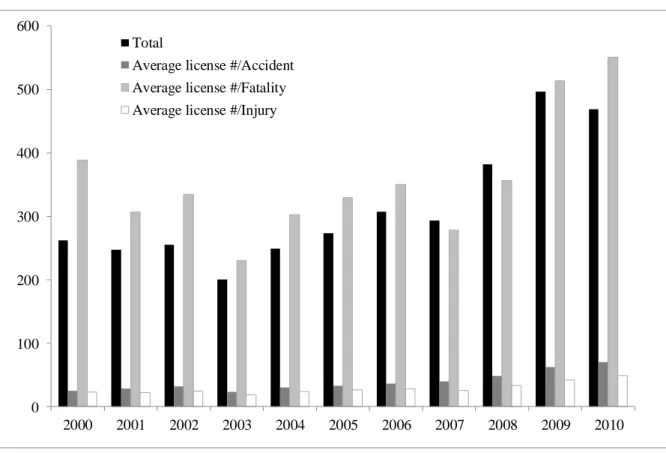
From these statistics we calculated the average number of licenses per accident, per fatality
and per injury (Figure 2). As can be seen from the figure, the average number of licenses per
accident, per fatality and per injury is increasing over time with the rate for fatality being the
highest. This match the increase in the total numbers of issued licenses. However in order to
understand the real trend we need to compare these rates to the total number of issued
licenses. So we divided these license averages per accident, per fatality and per injury by the
total number of licenses. Results show that roughly for accident and injury categories, the
years. While for fatality, it's clear that the average number of licensees associated with each
fatality is decreasing over years which indicate that there is an increase in the accident
severity (fatality) over time with more cars being involved in these accidents upon their
occurrence.
0 100000 200000 300000 400000 500000 600000
2000 2001 2002 2003 2004 2005 2006 2007 2008 2009 2010 Total New Renewal
Figure 1 - Total, new and renewed license numbers for 11 year period
Finally, looking at the statistics that is related to the average number of fines per license
shows that there is a significant increase in the number of fines issued per license (13 in 2009
and 5 in 2000 on average). This can be related to the large increase in the number of driving
licenses issued over the past 11 years (especially new ones) from one side and the higher level
of law enforcement from the other side. Statistics relating fines to nationality show that
citizens with higher number of fines are also the citizens with higher rates of accidents. For
example, overspeeding in UAE represent the major type of fines that is also clearly contribute
0 100 200 300 400 500 600
2000 2001 2002 2003 2004 2005 2006 2007 2008 2009 2010 Total
Average license #/Accident
Average license #/Fatality Average license #/Injury
Figure 2 - Average numbers of licenses per accident, per fatality and per injury (Total number is given in thousands)
2. Drivers’ Characteristics and Traffic Accidents
In-depth analysis is performed to better understand the characteristics of the drivers who are
involved in such traffic accidents. Statistics regarding accidents' totals for 4 years (2007,
2008, 2009, 2010) based on the driver/responsible party citizenship for each vehicle type are
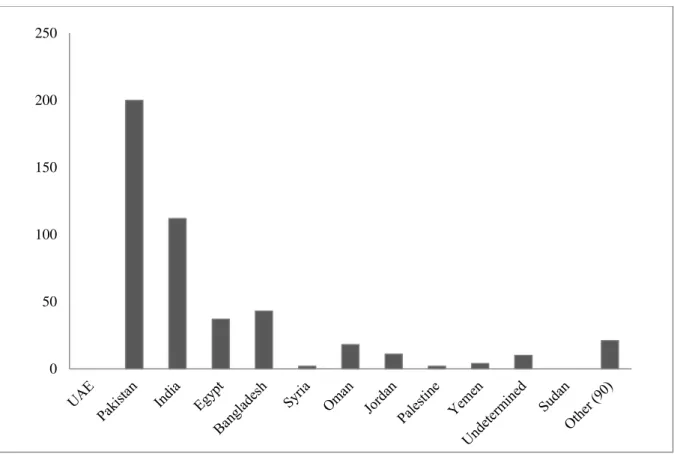
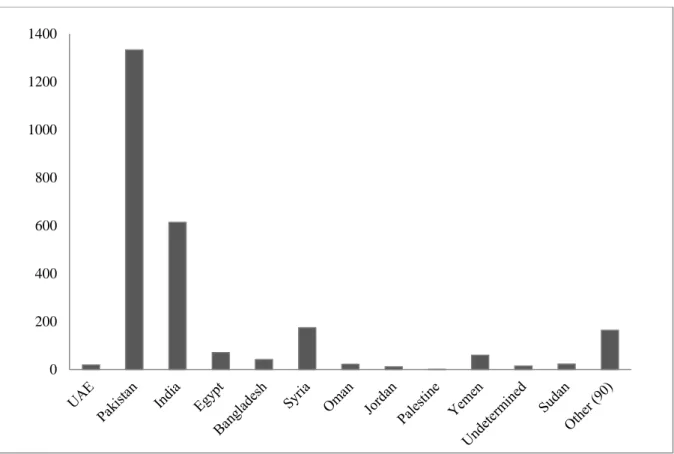
collected and analyzed. Figure 3 shows the 4 years accidents' (2007-2010) totals and
Figure 3a. 4 year accidents' totals distribution according to driver citizenship for all vehicle types.
Figure 3b. 4 year accidents' percentage distribution according to driver citizenship for all vehicle types.
0 2000 4000 6000 8000 10000 12000
UAE; 30.02 Pakistan; 21.26
India; 11.95
Egypt; 6.60
Bangladesh; 4.77 Syria; 3.49
Oman; 2.49 Jordan; 2.32
Palestine; 1.99 Yemen; 1.74
Undetermined; 1.91 Sudan; 1.39
From the results presented in Figure 3, the 4 years accidents' totals and percentages for all
types of vehicles show that the highest percentage of accidents was for emirates nationals
drivers (30.02%) followed by Pakistanis (21.26%) then comes the Indians drivers with a
percentage of 11.95%. The figure shows also the other 9 citizenships that have a major
contribution to traffic accidents while for the rest of citizenships (90 citizenships) their
contribution doesn’t exceed 10.07%. The fact that many Pakistanis and Indians work as drivers may explain their high percentage of involvement in traffic accidents. A proposal
might be to develop a traffic safety trainings and brochures in different languages to increase
the traffic safety awareness for different citizenships. Figures 4 to 11 show for each type of
vehicle the distribution of traffic accidents according to the driver citizenship. For the light
vehicle (Figure 4), emirates nationals, Pakistanis, Indians and Egyptians represent the major
citizenships that are involved in traffic accidents for the past four years. For motor cyclists'
accidents (Figure 5), emirates nationals, Indians, Egyptians, Bangladeshis, and Pakistanis
represent the citizenships with the highest contribution to traffic accidents.
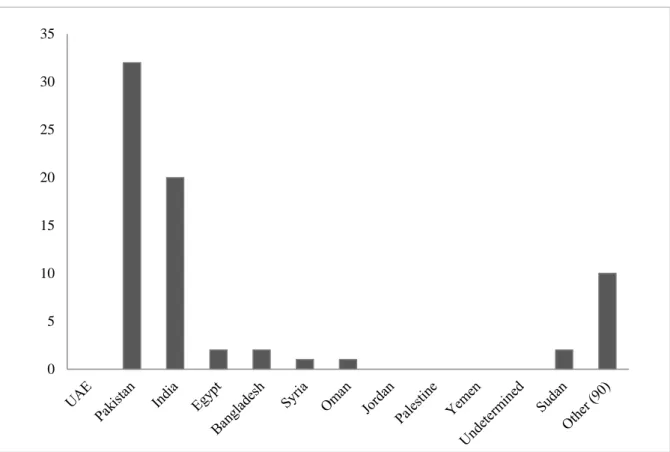
Figures 6 and 7 show the traffic accident distribution results based on citizenship for both
light and heavy buses. As expected, the most contribution to accidents for these two types of
vehicles is done by Pakistanis and Indians drivers. The same conclusion can be made from
Figures 8, 9, and 10 for the traffic accidents that are related to the light mechanical vehicle,
heavy mechanical vehicle, and heavy shipment vehicle. This can be interpreted by the fact the
Pakistanis and Indians represent the major citizenships that work in these types of industries
either in public transportation as drivers, or in construction industries or other heavy industry
business. Again, more attention, trainings, workshops and public awareness programs for the
highest involved citizenships in traffic accidents need to be developed to reduce their
involvement in traffic accidents and hence improve the traffic safety levels.
Figure 4. Distributions of traffic accidents according to driver citizenship for light vehicle
Figure 5. Distributions of traffic accidents according to driver citizenship for motor cyclists
0 1000 2000 3000 4000 5000 6000 7000 8000 9000 10000
Figure 6. Distributions of traffic accidents according to driver citizenship for light bus
Figure 7. Distributions of traffic accidents according to driver citizenship for heavy bus
0 50 100 150 200 250
Figure 8. Distributions of traffic accidents according to driver citizenship for light mechanical vehicle
Figure 9. Distributions of traffic accidents according to driver citizenship for heavy mechanical vehicle
0 5 10 15 20 25 30 35
Figure 10. Distributions of traffic accidents according to driver citizenship for heavy shipment vehicle
Figure 11. Distributions of traffic accidents according to driver citizenship for undefined vehicle
0 200 400 600 800 1000 1200 1400
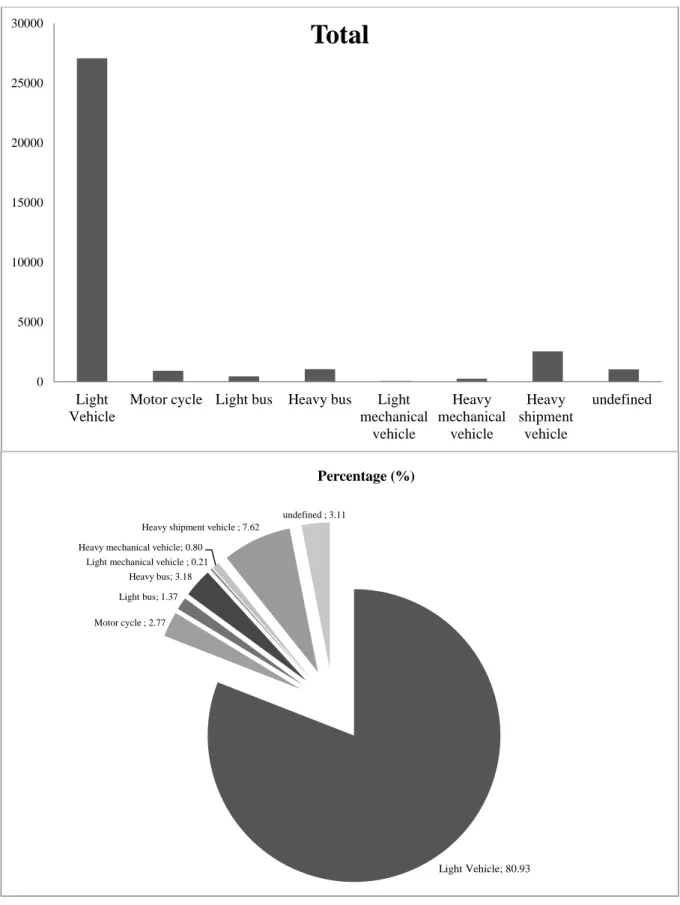
Furthermore, accidents' totals and percentages for 4 years (2007, 2008, 2009, 2010) for all
citizenships per each vehicle type can be analyzed as shown in Figure 12. Results indicate that
most of these traffic accidents are caused by light vehicles (80.93%) followed by heavy
shipment vehicles (7.62%). More focus on these vehicle types is needed and the reasons
behind their high contribution in traffic accidents need to be identified.
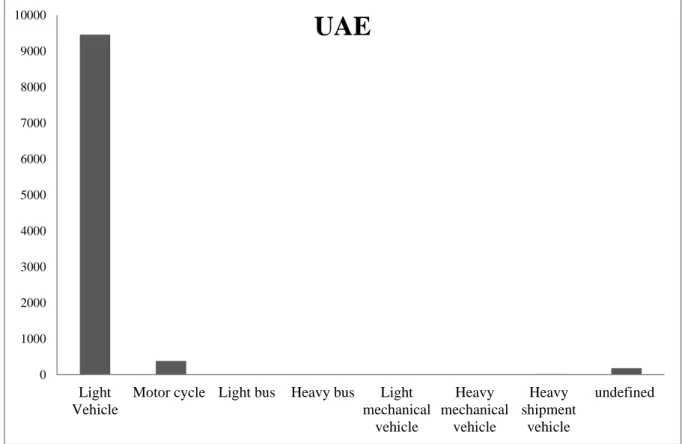
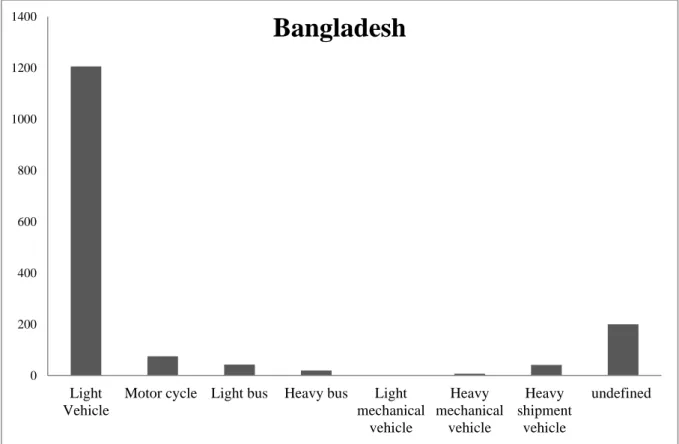
Figure 13 shows the distribution of the total four years' accidents per citizenship for all types
of vehicles. For the citizenships that have major contribution in traffic accidents, clear trends
can be seen. For example, most of the traffic accidents for emirates nationals were
concentrated in the light vehicle and motorcycle with the light vehicle accidents composing
the highest percentage. Traffic accidents related to light vehicle, heavy shipment vehicle, and
heavy bus represent the major types of accidents for Pakistani citizenship while light vehicle
and heavy shipment vehicle accidents were the major types for Indian citizenship. For the rest
of citizenships, traffic accidents caused by light vehicle dominated all types of vehicles'
Figure 12. Four years accidents' totals and percentages distributed according to vehicle type for all citizenships
0 5000 10000 15000 20000 25000 30000
Light Vehicle
Motor cycle Light bus Heavy bus Light mechanical
vehicle
Heavy mechanical
vehicle
Heavy shipment
vehicle
undefined
Total
Light Vehicle; 80.93
Motor cycle ; 2.77 Light bus; 1.37
Heavy bus; 3.18 Light mechanical vehicle ; 0.21 Heavy mechanical vehicle; 0.80
Heavy shipment vehicle ; 7.62
undefined ; 3.11
Figure 13 (1). Four years accidents' totals distributed according to citizenship - Emirates citizenship
Figure 13 (2). Four years accidents' totals distributed according to citizenship - Pakistanis citizenship
0 1000 2000 3000 4000 5000 6000 7000 8000 9000 10000 Light Vehicle
Motor cycle Light bus Heavy bus Light mechanical vehicle Heavy mechanical vehicle Heavy shipment vehicle undefined
UAE
0 500 1000 1500 2000 2500 3000 3500 4000 4500 5000 Light VehicleFigure 13 (3). Four years accidents' totals distributed according to citizenship - Indian citizenship
Figure 13 (4). Four years accidents' totals distributed according to citizenship - Egyptian citizenship
0 500 1000 1500 2000 2500 3000
Light Vehicle
Motor cycle Light bus Heavy bus Light mechanical
vehicle
Heavy mechanical
vehicle
Heavy shipment
vehicle
undefined
India
0 500 1000 1500 2000 2500
Light Vehicle
Motor cycle Light bus Heavy bus Light mechanical
vehicle
Heavy mechanical
vehicle
Heavy shipment
vehicle
Figure 13 (5). Four years accidents' totals distributed according to citizenship - Bangladeshi citizenship
Figure 13 (6). Four years accidents' totals distributed according to citizenship - Syrian citizenship
0 200 400 600 800 1000 1200 1400 Light Vehicle
Motor cycle Light bus Heavy bus Light mechanical vehicle Heavy mechanical vehicle Heavy shipment vehicle undefined
Bangladesh
0 100 200 300 400 500 600 700 800 900 1000 Light VehicleFigure 13 (7). Four years accidents' totals distributed according to citizenship - Omani citizenship
Figure 13 (8). Four years accidents' totals distributed according to citizenship - Jordanian citizenship
0 100 200 300 400 500 600 700 800 Light Vehicle
Motor cycle Light bus Heavy bus Light mechanical vehicle Heavy mechanical vehicle Heavy shipment vehicle undefined
Oman
0 100 200 300 400 500 600 700 800 Light VehicleFigure 13 (9). Four years accidents' totals distributed according to citizenship - Palestinian citizenship
Figure 13 (10). Four years accidents' totals distributed according to citizenship - Yemeni citizenship
0 100 200 300 400 500 600 700
Light Vehicle
Motor cycle Light bus Heavy bus Light mechanical
vehicle
Heavy mechanical
vehicle
Heavy shipment
vehicle
undefined
Palestine
0 100 200 300 400 500 600
Light Vehicle
Motor cycle Light bus Heavy bus Light mechanical
vehicle
Heavy mechanical
vehicle
Heavy shipment
vehicle
Figure 13 (11). Four years accidents' totals distributed according to citizenship - Sudani citizenship
Figure 13 (12). Four years accidents' totals distributed according to citizenship - Other citizenship
0 50 100 150 200 250 300 350 400 450 500 Light Vehicle
Motor cycle Light bus Heavy bus Light mechanical vehicle Heavy mechanical vehicle Heavy shipment vehicle undefined
Sudan
0 500 1000 1500 2000 2500 3000 Light VehicleFigure 13 (13). Four years accidents' totals distributed according to citizenship - Undetermined citizenship
3. Accidents vs. Time and Driver Citizenship
Also, a further analysis is made based on the traffic accidents statistics for the last four years
(2007, 2008, 2009, 2010) for each vehicle type depending on the involved driver citizenship
(Figures 14 to 21). For the four years' traffic accidents that are related to the light vehicle type
(Figure 14), A general trend can be seen for all citizenships where there is an increase in the
number of traffic accidents related to light vehicle type over the course of the first three years
followed with a noticeable reduction in the last year (2010) for the major citizenships
specifically. The rate of increase for the major citizenships is slower between the years 2008
and 2009 after the implementation of the unified traffic enforcement law compared to the
rates of the years 2007 and 2008.
Figure 15 shows the accidents' 4-years totals for the motorcycle type for all citizenships. The
increasing trends in accidents total exist for the major citizenships (Emirates nationals,
Pakistanis, Indians, Egyptians, and Bangladeshi) for the years 2007 and 2008. However, for
all these major citizenships and after the year 2008, we can see clear reduction after the 0
100 200 300 400 500 600
Light Vehicle
Motor cycle Light bus Heavy bus Light mechanical
vehicle
Heavy mechanical
vehicle
Heavy shipment
vehicle
implementation of the unified traffic enforcement law with an exception for the Pakistanis
citizenship. For the light bus vehicle types (Figure 16) and for Pakistanis and Indians
citizenships there is a tremendous increase in the total traffic accidents over the course of the
four years except for the year 2010 for Pakistanis that shows noticeable decrease. For the
heavy bus vehicle types (Figure 17) and for both Pakistanis and Indians, the same increasing
trend can be seen for the years 2007 to 2009 with a remarkable decrease for the year 2010 for
both citizenships. For the heavy shipment vehicle accidents' type (Figure 20), Pakistanis
citizenship accidents show permanent increase over the first three years’ time span with a
reduction in last year (2010) while the Indian citizenship accidents show an increase between
2007 and 2008 then the rate goes down at 2009 and 2010. Similar important relationships for
the rest of vehicle types and citizenships can be drawn for the rest of the figures. These
remarks can be used to identify the highly involved citizenships and vehicle types in UAE
road accidents so more focus can be directed to these categories through reviewing existing
traffic laws in a way that ensure more restrict fines on these categories besides working on
increasing the traffic safety awareness levels among these targeted groups.
Figure 14. Traffic accidents rates for the last four years (2007, 2008, 2009, 2010) for light vehicle type based on the driver citizenship
0 500 1000 1500 2000 2500 3000 3500
Figure 15. Traffic accidents rates for the last four years (2007, 2008, 2009, 2010) for motorcycle type based on the driver citizenship
Figure 16. Traffic accidents rates for the last four years (2007, 2008, 2009, 2010) for light bus type based on the driver citizenship
0 20 40 60 80 100 120 140
2007 2008 2009 2010
0 10 20 30 40 50 60 70 80 90
Figure 17. Traffic accidents rates for the last four years (2007, 2008, 2009, 2010) for heavy bus type based on the driver citizenship
Figure 18. Traffic accidents rates for the last four years (2007, 2008, 2009, 2010) for light mechanical vehicle type based on the driver citizenship
0 50 100 150 200 250
2007 2008 2009 2010
0 2 4 6 8 10 12 14
Figure 19. Traffic accidents rates for the last four years (2007, 2008, 2009, 2010) for heavy mechanical vehicle type based on the driver citizenship
Figure 20. Traffic accidents rates for the last four years (2007, 2008, 2009, 2010) for heavy shipment vehicle type based on the driver citizenship
0 10 20 30 40 50 60
2007 2008 2009 2010
0 50 100 150 200 250 300 350 400 450 500
Figure 21. Traffic accidents rates for the last four years (2007, 2008, 2009, 2010) for undefined vehicle type based on the driver citizenship
Currently no statistics are available to describe the average age per nationality. However,
work experience in the field can confirm that some citizenships (e.g., Pakistan and India) are
associated with higher accident rates because of younger (and less experienced) citizens. This
is also true due to the cultural difference and different driving behaviors available at UAE
compared to their home countries.
0 20 40 60 80 100 120
Conclusion
Driver has a very important role in traffic accidents and most of the time he/she holds the
major responsibility (more than 90% as per previous research) as he/she has the highest
control level on the road. A focus was placed on identifying the relationships that drivers'
licensing, drivers' citizenships and vehicle types have with traffic accidents.
Analysis and results obtained reveals a number of important findings. There has been an
excessive increase in the number of new driver's licenses issued over the past 11 years where
they almost doubled in number in 2009 as compared to that in 2000 (496138 in 2009 while it
was 262045 in 2000). Most of these licenses are newly issued licenses. The lack of experience
that usually associates new drivers can play a major role in traffic accident occurrence. For
fatality associated accidents, results indicate that the average number of licenses associated
with each fatality is decreasing over years which indicate that there is an increase in the
accident severity (fatality) over time with more cars being involved in these accidents upon
their occurrence. A significant increase in the number of fines issued per license can be seen
clearly which rises on average from 5 fines/license in 2000 to 13 fines/license in 2009. The
major increase happened after year 2008 after the implementation of the unified law which
reflects that a stronger traffic enforcement law took place which played a major role in traffic
accidents reduction.
Regarding the citizenship of the drivers who are involved in traffic accidents over the last 4
years, results indicated that for all types of vehicles emirates nationals drivers represent the
citizenship with the highest involvement rate in traffic accidents (30.02%) followed by
Pakistanis (21.26%) then comes the Indians drivers with a percentage of 11.95%. The same
result was obtained for the light vehicle accidents, this type of vehicle accidents represent the
major portion of all vehicles accidents, where the major contributing citizenships, in
descending order according to number of accidents they are involved in, are: emirates
nationals (largest contribution), Pakistanis, Indians and Egyptians. This might be interpreted
by the fact that emirates nationals own large number of light vehicles. Also for Pakistanis and
Indians high contribution to accidents, this can be related to the fact that huge numbers of
order represented the citizenships with the highest contribution to traffic accidents. For
industrial and construction vehicles accidents (i.e., light and heavy buses, light and heavy
mechanical vehicle, and heavy shipment vehicle), the most contribution to accidents for these
types of vehicles is done by Pakistanis and Indians drivers. The fact that Pakistanis and
Indians represent the major citizenships that work in these types of industries either in public
transportation as drivers, or in construction industries or other heavy industry business can
explain this trend.
Light vehicle type traffic accidents statistics for the years (2007, 2008, 2009, 2010) shows that
a general trend can be seen for all citizenships where there is an increase in the number of
traffic accidents over the course of the first three years followed with a noticeable reduction in
the last year (2010) for the major citizenships specifically. The rate of increase for the major
citizenships is slower between the years 2008 and 2009 after the implementation of the
unified traffic enforcement law compared to the rates of the years 2007 and 2008. The
increasing trends in accidents total exist for the major citizenships (Emirates nationals,
Pakistanis, Indians, Egyptians, and Bangladeshi) for the years 2007 and 2008. However, for
all these major citizenships and after the year 2008, we can see clear reduction after the
implementation of the unified traffic enforcement law with an exception for the Pakistanis
citizenship. For the light bus vehicle types and for Pakistanis and Indians citizenships there is
a tremendous increase in the total traffic accidents over the course of the four years except for
the year 2010 for Pakistanis that shows noticeable decrease. For the heavy bus vehicle types
and for both Pakistanis and Indians, the same increasing trend can be seen for the years 2007
to 2009 with a remarkable decrease for the year 2010 for both citizenships. For the heavy
shipment vehicle accidents' type, Pakistanis citizenship accidents show permanent increase
over the first three years’ time span with a reduction in last year (2010) while the Indian
citizenship accidents show an increase between 2007 and 2008 then the rate goes down at
2009 and 2010. The major contribution of this paper was its uniqueness in analyzing such
accidents database after the implementation of the new unified traffic law in UAE. The paper
succeeds in identifying those citizenships with major involvement in road accidents in UAE
for future remedy. Due to the lack of available statistics, some important aspects such as the
References
Asogwa S. E. (1980) Some characteristics of drivers and riders involved in road traffic accidents in Nigeria. East African Medical Journal, vol. 57, pp. 399-404.
Bekibele C., Fawole O., Bamgboye A., Adekunle L., Ajav R., Baiyeroju A. (2007) Risk factors for road traffic accidents among drivers of public institutions in Ibadan, Nigeria, African Journal of Health Sciences, vol. 14, pp. 137-142.
Bener A. and Jadaan K. S. (1992) A perspective on road fatalities in Saudi Arabia. Accident Analysis & Prevention, vol. 24, pp. 143-148.
Bener A. (2001) Road Traffic Injuries in developing countries: Motor Vehicle Accidents in the United Arab Emirates: Strategies for prevention. Global Forum for Health Research, the 10/90 Gap in Health Research, Forum 5, Geneva, pp. 221-222.
Bener A., Abu-Zidan F., Bensiali A., Al-Mulla A., Jadaan K. (2003) Strategy to improve road safety in developing countries. Saudi Med Journal, vol. 24, pp. 603-608.
Bener A., Crundall D., Haigney D., Benisiali A., Al-Falasi A. (2004) Driver Behavior, Stress, Error and Violations on the Road: A cross-cultural comparison study, 3rd International Conference on Traffic &Transport Psychology, Nottingham, UK.
Bener A. and Crundall D. (2005) Road traffic accidents in the United Arab Emirates compared to Western countries, Advances in Transportation Studies an international Journal, Section A 6, pp. 5-12.
Gregersen, N. and Bjurulf, P. (1996) Young novice drivers: Toward a model of their accident involvement. Accident Analysis & Prevention, vol. 28, pp. 229-241.
Horne J. and Reyner L. (2000) Sleep Related Vehicle Accidents, Sleep Research Laboratory, Loughborough University.
Humphries D. (1987) Three South African studies on the relation between road accidents and drivers’ vision. Ophthalmic and Physiological Optics, vol. 7, pp. 73-79.
Jadaan K., Bener A., Al-Zahrani A. (1992) Some aspects of road user behaviour in selected Gulf countries. Journal of Traffic Medicine, vol. 20, n. 3, pp. 129-135.
Malhotra V. (1990) Prevention of road accidents-role of health services. Swasth Hind, pp. 92-93.
Szlyk J., Seiple W., Viana M. (1995) Relative effects of age and compromised vision on driving performance. Human Factors, vol. 37, pp. 430-436.
Toczolowski J., Gerkowwicz M., Pracka A., Rycerz H. (1996) Vision defects in two age groups of drivers who caused road accidents. Klinika Oczna, vol. 98, pp. 221-224.
Treat J., Tumbas N., McDonald S., Shinar D., Hume R., Mayer R., Stanisfer R., Castellan N. (1977) Tri-level study of the causes of traffic accidents. Report No. DOT-HS-034-3-535-77 (TAC).