109
Abstract
The Minas-Rio Project is the biggest project from Anglo American in the world and considers Vertimill in the regrinding circuit to adequate the particle size distribu-tion to feed slurry pipeline that will pump the ore from Conceição do Mato Dentro in Minas Gerais State to Acu Port in Rio de Janeiro State, Brazil. A Vertimill pilot test campaign was carried out at Metso’s pilot plant facility located in York city, Pennsyl-vania State, USA, to provided information to sizing the industrial grinding circuit. The main objective of this work is proposing a way to simulate the industrial Vertimill using the population balance model, normally used to simulate ball mills. The simula-tions were based on the selection and breakage funcsimula-tions determined from the labora-tory tests using a batch ball mill. The simulations were performed using a Vertimill model implemented in the ModsimTM plant-wide simulator. The results of simulations
shows that was possible to simulate the pilot tests, with good accuracy, considering simple laboratory tests with small quantities of samples.
keywords: Vertimill, Simulation, Grinding, Population Balance Model,
Itabirites, ModsimTM.
Resumo
O Projeto Minas-Rio é o maior projeto da Anglo American no mundo e consi-dera um circuito de remoagem com Vertimill para adequar a distribuição de tamanho de partículas para alimentar o mineroduto que irá transportar o minério da cidade de Conceição do Mato Dentro, no Estado de Minas Gerais, ao Porto do Açu, no Rio de Janeiro, Brasil. Uma campanha de testes em escala-piloto com Vertimill foi realizada nas instalações da Metso localizadas na cidade de York, Estado da Pensilvânia, EUA, para fornecer informações para o dimensionamento do circuito de moagem indus-trial. O principal objetivo desse trabalho é propor uma forma de simular o circuito industrial com Vertimill, utilizando o modelo de balanço populacional, normalmen-te usado para simular moinhos de bolas. As simulações foram baseadas na função seleção e na função quebra determinadas a partir dos testes de laboratório utilizan-do um moinho de bolas de batelada. As simulações foram realizadas utilizanutilizan-do um modelo de Vertimill implementado no simulador de processos minerais ModsimTM. Os resultados das simulações mostraram que é possível simular os testes-piloto, com boa precisão, através de testes simpliicados em escala de laboratório, com pequenas quantidades de amostras.
Palavras-chave: vertimill, simulação, moagem, modelo do balanço populacional, itabiritos, ModsimTM.
Douglas Batista Mazzinghy
Anglo American – Desenvolvimento Belo Horizonte – Minas Gerais – Brazil [email protected]
José Francisco Cabello Russo
Anglo American – Desenvolvimento Belo Horizonte – Minas Gerais – Brazil [email protected]
Roberto Galéry
Universidade Federal de Minas Gerais Belo Horizonte – Minas Gerais – Brazil [email protected]
Claudio Luiz Schneider
Centro de Tecnologia Mineral Rio de Janeiro – Rio de Janeiro - Brazil [email protected]
Simulations of Vertimill
Pilot Scale tests for Itabirite
Simulação de testes de Vertimill
em Escala Piloto com Itabirito
Mining
Mineração
1. Introduction
The Vertimill has been used in regrind circuits over last 30 years. The principle is very simple and there have
been reports that this type of mill is approximately 30% more eficient than conventional ball mills
(VANDER-BEEK, 1998; JANKOVIC et al., 2006; JUNIOR et al., 2011).
MAZZINGHY et al., 2013
110
plain that the higher eficiency of the Vertimill is due to the higher frequency of lower energy impacts and, by the same token, smaller frequency of higher energy impacts when compared to conventional ball mills.
The Minas-Rio Project, located in Conceição do Mato Dentro city, Minas Gerais State, Brazil, predicts the largest slurry pipeline around the world with a length of 525km. The Vertimill circuits
of the project were considered to ad-equate the particle size distribution of the iron ore concentrate to feed the pipeline. There are 16 Vertimills VTM-1500 in the regrind circuit. Anglo American carried out a Vertimill pilot test campaign in Metso’s pilot plant facility, located in York city, Pennsylvania State, USA. The objective of the pilot tests was to deter-mine the speciic energy consumption required to obtain a product with 88%
< 0.044mm. The samples were produced in Anglo American pilot plant facilities including crushing, grinding, desliming and lotation to obtain the inal concen-trate that was sent to Metso for Vertimill pilot tests.
The main objective of the paper is to propose a way to simulate the Indus-trial Vertimill using the population bal-ance model, normally used to simulate conventional ball mills.
2. Modeling
2.1 Population balance model
The population balance was for-mulated for chemical engineering pur-poses by HULBURT & KATZ (1964). It is used to describe a wide range of
particle processes as agglomeration, locculation, crystallization, polymer-ization, etc.
The size-mass balance model that
describes the batch grinding process through successive events of particle breakage is given in Equation 1 (AUS-TIN et al. 1984).
m
i(t)
is the mass fraction of particles contained in size class i after grinding time t;b
ijrepresents the size distributionpro-duced by a breakage event;
S
i represents the speciic rate of breakage of particles in size class i.The population balance model was used
with success to represent an industrial Tower Mill operational by MORRELL et al. 1993.
2.2 Specific selection function
The selection function has a proportionality relationship with the
power consumed by the grinding action according to Equation 2 (HERBST &
FUERSTENAU, 1973).
S
i(h
-1)
is the selection function foreach size class;
S
iE (t/kWh) is the energyspeciic selection function;
H
(t) is mill holdup;P
(kW) is net grinding power.Parameters obtained from simple laboratory batch grinding tests can be used for simulating and scaling-up large industrial mills.
The speciic selection function
S
iEisindependent of the dimensions of the mill and may be modeled using Equation 3 (RAJAMANI & HERBST, 1984).
(1)
(2)
(3)
(d
i/d
1)
is the dimensionless particle size (normalized at 1mm);S1
E, ζ1, ζ2 are characteristic parameters of the mate-rial and the grinding conditions.
The parameter
S1
E, from Equation3, is multiplied by a scaling factor equal 1.35 to represent the highest eficiency of the Vertimill, (MAZZINGHY, 2012 MAZZINGHY et al., 2013).
T h e Ve r t i m i l l m o d e l w a s
implemented in the ModsimTM
plant-wide simulator.
The models used in ModsimTM can
be found in KING (2002).
2.3 Breakage function
The breakage function model is given in Equation 4 (AUSTIN et al.
1984), where
B
ij is the cumulative break-age function and the parametersφ
,
γ
,
β
are dependent of the ore.
)
(
1
1
)
(
)
(
t
j
m
j
S
i
j
ij
b
t
i
m
i
S
dt
t
i
dm
∑
−
=
+
−
=
⎟
⎠
⎞
⎜
⎝
⎛
=
H
P
S
S
i iE⎪⎭
⎪
⎬
⎫
⎪⎩
⎪
⎨
⎧
⎥
⎦
⎤
⎢
⎣
⎡
⎟⎟
⎠
⎞
⎜⎜
⎝
⎛
+
⎟⎟
⎠
⎞
⎜⎜
⎝
⎛
=
2 1 i 2 1 i 1 E E id
d
ln
d
d
ln
exp
1
S
S
ζ
ζ
(
)
β γ
φ
φ
⎟
⎟
⎠
⎞
⎜
⎜
⎝
⎛
−
+
⎟
⎟
⎠
⎞
⎜
⎜
⎝
⎛
=
− − j i j i j ix
x
x
x
B
1 1111
(5)
(6)
(7)
(8)
2.4 External Classification
The external classiication can be described by the logistic function model
developed by AUSTIN et al. (1984), deined as shown in the Equation 5:
e(d
i)
is the actual classiication function;d
i is the particle of fraction size i (mm);d
50c is the particle size corrected (50%chance to go to underlow or overlow);
λ
is the sharpness classiication parameter. The sharpness classifcation parameterλ
can be estimated as follows in Equa-tion 6.The
SI
can be estimated as follows in Equation 7.d
25 is the size of 25% passing (mm);d
75 is the size of 75% passing (mm).Equation 8 presents the corrected classiication function
c(di)
.c(d
i)
is the corrected classiication func- tion; α is the feed’s short circuit directly to the coarse product.3. Experimental
3.1 Vertimill Pilot Tests
Metso’s pilot plant facility is equipped with instruments to measure and register the data from the pilot test. The target of the continuous test was to determine the speciic energy required to grind the material to eighty eight
percent (88%) passing 0.044mm. The tests were performed in closed circuit with a high frequency screen and in direct and reverse coniguration.
The screw speed of the Vertimill was 87rpm. Samples from different
lows of circuit were collected during the tests for solids concentration and particle size distribution analysis.
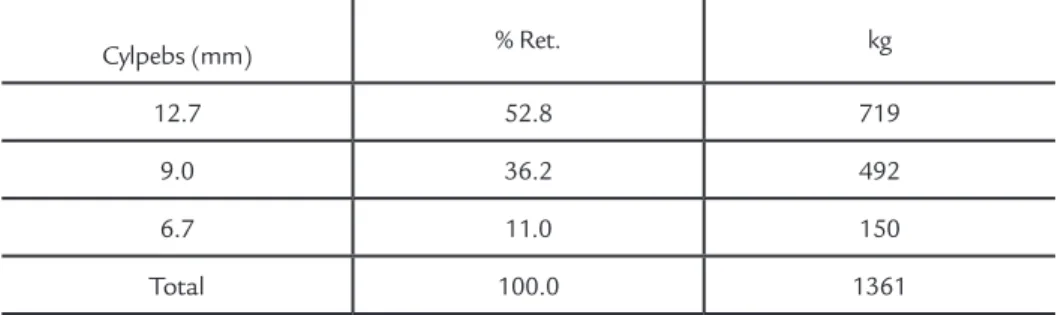
Table 1 shows the cylpebs size distribution used in the Vertimill pilot test.
Table 1 Cylpebs size distribution used in the Vertimill pilot tests
Cylpebs (mm) % Ret. kg
12.7 52.8 719
9.0 36.2 492
6.7 11.0 150
Total 100.0 1361
( )
−λ⎟⎟
⎠
⎞
⎜⎜
⎝
⎛
+
=
c i i
d
d
d
e
50
1
1
)
ln(
1972
,
2
SI
=
λ
75 25
d
d
SI
=
( )
d
(
1
)
e
(
d
)
c
i=
α
+
−
α
i3.2 Batch Mill Tests
The selection and breakage func-tions were determined using a batch ball mill. Three tests were carried out in diferent time intervals on a wet basis (70% solids concentration by weight).
The time intervals considered were: 15, 30 and 45 minutes. The tests are designed to reach the desired product size distribution specified as a
P
80value. The batch tests were carried
out considering the same cylpebs size distribution using on the Vertimill pilot test campaing. Table 2 shows the opera-tional variables used in the batch ball mill tests.
Mill Diameter (m) 0.203
Mill Length (m) 0.254
Cypebs Filing (%) 40.0
Critical Speed (%) 76.0
112
4. Results and discussions
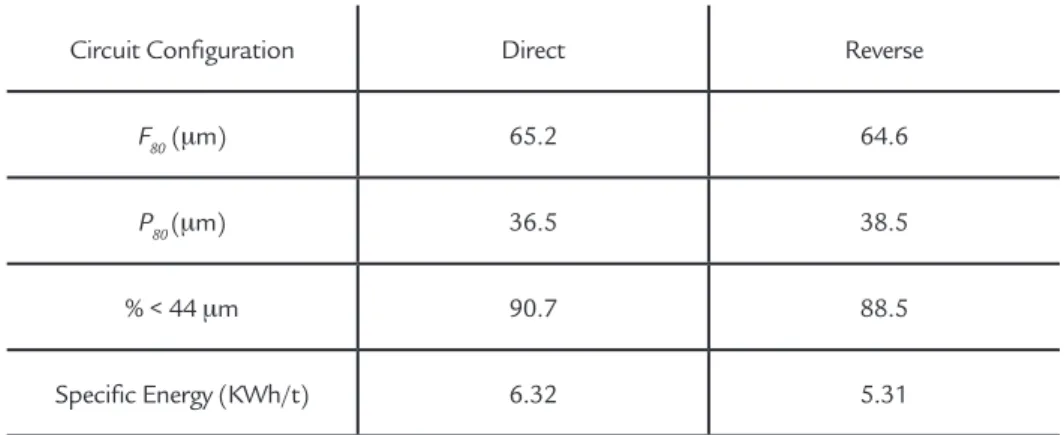
4.1 Vertimill Pilot Test
Table 3 shows the results obtained during the Vertimill pilot tests.
Circuit Configuration Direct Reverse
F80 (μm) 65.2 64.6
P80 (μm) 36.5 38.5
% < 44 μm 90.7 88.5
Specific Energy (KWh/t) 6.32 5.31
Table 4 shows the classification parameters for high frequency screening
determined based on mass balance of the Vertimill pilot tests.
Table 3 Results from
the Vertimill pilot test campaign.
Table 4
Classifications parameters for high frequency screening obtained from Vertimill pilot tests.
Table 5
Parameters based on the specific energy model obtained from laboratory tests
Circuit Configuration Direct Reverse
d50c (microns) 31.27 33.99
Short-circuit to underflow 0.29 0.39
Sharpness index 0.52 0.54
4.2 Breakage Parameters
An optimization software devel-oped by Mineral Technologies Inter-national, called BatchMillTM was used
to determine the grinding parameters. Ta b l e 5 s h o w s t h e s e l e c -tion and breakage func-tions
pa-rameters determined from batch mill tests based on the specific energy model.
Selection Function Breakage Function
S1E (t/kWh) ζ
1 ζ2 γ β ø
9.780 0.898 -0.154 1.250 2.765 0.237
Figure 1
Selection and breakage functions based on the specific energy model.
The parameters
S1
E presented inTable 5 were multiplied by a factor of 1.35 to correct for the higher efi-ciency of the Vertimill with respect to
the conventional ball mill (MAZZIN-GHY, 2012).
In this case, the parameters
S1
Eproduced the value 13.203 t/kWh.
113 Data from the mass balance of each
test was used to perform simulations using
the population balance model. Figure 2 shows the simulations based on the
spe-ciic energy model for direct and reverse circuit coniguration, respectively.
Figure 2 Simulation results for direct (left) and reverse (right) circuit configuration.
Symbols represent the measured particle size distribution obtained in the Vertimill pilot tests and the solid line is the corresponding model response.
For both circuit configuration,
direct and reverse, the specific en-ergy model predicted more fines in the product.
The multiplier factor equaling 1.35 was considered to represent the higher
eficiency of Vertimill when compared to the conventional ball mill.
Table 6 show the mass balance obtained from experimental data and the simulation results.
Table 6 Mass balance obtained from experimental data and simulation results.
Results Circuit F80 (m) P80 (m) C.L (%)
Mass Balance
Direct 65.2
36.5 174
Simulation 34.0 187
Mass Balance
Reverse 64.6
38.5 225
Simulation 35.9 234
The values of P80 and the circulating loads found in the simulations present
a small difference between the mass balance values.
5. Conclusions
The particle size distribution of the Vertimill pilot scale tests in direct and reverse conigurations was obtained, with good accuracy, by simulations using the population balance model. The
methodol-ogy used in this study can help the process engineers to understand and scale-up to industrial Vertimill from batch ball mill tests. A multiplier factor equal to 1.35 was applied on the parameter
S1
E to simulatethe higher eficiency of the Vertimill when compared with conventional ball mill.
For both circuit conigurations, di-rect and reverse, the speciic energy model predicted more ines in the product.
4.3 Simulations
6. References
AUSTIN, L. G., KLIMPEL, R. R., LUCKIE, P. T. Process engineering of size reduc-tion, SME - AIME, 1984.
HERBST J. A., FUERSTENAU D. W. Mathematical Simulation of Dry Ball Milling using Speciic Power Information, Trans. AIME, v. 254, p. 343, 1973.
HULBURT, H. M., KATZ, S. Some problems in particle technology: a statistical me-chanical formulation. Chemical Engineering Science, v.19, p.555-574, 1964. JANKOVIC A., VALERY W., CLARKE G. Design and Implementation of an AVC
Grinding Circuit at BHP Billiton Cannington. In: SAG 2006 Conference.
JUNIOR, L. T. S., GOMES, M. P. D., GOMIDES, R. B., JUNIOR, G. G. O., PHILLIPS, W. Advantages and disadvantages of using tower mill in Paracatu Kin-ross Concentrate regrind. In: ENTMME, 24. Salvador/Bahia, 2011.
KING, R.P. Modeling and Simulation of Mineral Processing Systems, Butterworth--Heinemann. Oxford, 2002. p.147.
114
Received: 4 February 2013 - Accepted: 28 August 2014. Mining and Metallurgy, v.93, p. 74-85, 1984.
MAZZINGHY, D.B. Methodology for simulation and scale-up of Tower Mills. Belo Horizonte: Universidade federal de Minas Gerais, 2012. (PhD Thesis)
MAZZINGHY, D. B., SCHNEIDER, C. L., ALVES, V. K., GALÉRY, R. Applying the Population Balance Model to Predict the Vertimill Product Particle Size Distri-bution.Proceedings of the 13th European Symposium on Comminution & Clas-siication. Braunschweig, Germany, 2013.
MORRELL, S., STERNS, U.J., WELLER, K.R. The application of population balan-ce models to very ine grinding in tower mills. In: INTERNATIONAL MINERAL PROCESSING CONGRESS, 18. Sidney, 1993. p.61-66 XVIII International Mine-ral Processing Congress, pp. 61-66, Sydney, 1993.