Rafael Moreira Claro Carlos Augusto Monteiro
Departamento de Nutrição. Faculdade de Saúde Pública. Universidade de São Paulo. São Paulo, SP, Brasil
Correspondence:
Rafael Moreira Claro
Núcleo de Pesquisas Epidemiológicas em Nutrição e Saúde
Depto de Nutrição
Av. Dr. Arnaldo, 715 – Cerqueira Cesar 01246-904 São Paulo, SP, Brasil E-mail: [email protected] Received: 7/1/2009 Approved: 6/6/2010
Article available from: www.scielo.br/rsp
Family income, food prices, and
household purchases of fruits
and vegetables in Brazil
ABSTRACT
OBJECTIVE: To analyze the infl uence of family income and food prices on the participation of fruits and vegetables in the food purchases of Brazilian households.
METHODS: Data analyzed refers to the Household Budget Survey conducted by the Instituto Brasileiro de Geografi a e Estatística on a probabilistic sample of 48,470 Brazilian households between 2002 and 2003. Fruit and vegetable participation in total food purchases was expressed as a percentage of total calories purchased and as calories from fruit and vegetables adjusted for total calories purchased. A multiple regression analysis was employed to estimate elasticity coeffi cients, controlling for sociodemographic variables and price of other foods.
RESULTS: Fruit and vegetable participation in total food purchases increased as the price of these foods decreased, or as income increased. A 1% decrease in the price of fruit and vegetables would increase their participation by 0.79%, whereas a 1% increase in family income would increase participation by 0.27%. The effect of income tended to be smaller among higher income strata.
CONCLUSIONS: Reducing the price of fruit and vegetables, either by supporting their production or through fi scal measures, is a promising public policy instrument, capable of increasing the participation of these foods in the diet of the Brazilian population.
DESCRIPTORS: Food, economics. Income. Food Consumption. Fruit. Greens. Diet Surveys. Prices.
INTRODUCTION
Evidence from the literature points towards an association between insuffi cient intake of fruits and vegetables (F&V) and higher risk of diseases such as certain types of cancer and cardiovascular disease.14,16,a The World Health Organization
(WHO) estimates that, worldwide, approximately 2.7 million deaths per year can be attributed to insuffi cient F&V intake, making it one of the ten primary factors behind the global burden of disease.18
WHO and the Food and Agriculture Organization of the United Nations (FAO) recommend a minimum daily F&V intake of 400 g.18 This would correspond,
in Brazil, to between 6% and 7% of the total calories of a 2,300 kcal per day diet.b Household availability of F&V among the Brazilian population,
a World Health Organization. Global strategy on diet, physical activity and health. Geneva; 2003. (WHO Technical Report Series, 916).
c Haddad L. What can food policy do to redirect diet transition? Washington: International Food Policy Research Institute; 2003. (FCND discussion papers, 165).
d Instituto Brasileiro de Geografi a e Estatística. Pesquisa de orçamentos familiares. POF 2002/2003: análise da disponibilidade domiciliar de alimentos e do estado nutricional no Brasil. Rio de Janeiro; 2004.
e Instituto Brasileiro de Geografi a e Estatística. Estudo Nacional da Despesa Familiar - ENDEF 1974/75. Rio de Janeiro; 1978. f Conversor de Aquisições de Alimento em Energia e Nutrientes (AQUINUT), Versão 1.0 [internet]. São Paulo: Núcleo de Pesquisas Epidemiológicas em Nutrição e Saúde da Universidade de São Paulo; [s.d.] [cited 2008 Oct 6] Available from: http://www.fsp.usp.br/nupens g Núcleo de Estudos e Pesquisas em Alimentação. Tabela brasileira de composição de alimentos - TACO. Campinas: Flamboyant; 2004. h United States Department of Agriculture. Agricultural Research Service. USDA national nutrient database for standard reference: release 15. Beltsville; 2002.
according to data from the 2002/03 Household Budget Survey (POF) conducted by the Instituto Brasileiro de Geografi a e Estatística (IBGE), corresponded to 2.4% of total available calories, falling short of minimum recommended values in all geographic regions and economic strata.13
Food choices are complex decisions that are infl uenced by both biological factors and social, cultural, and economic variables.9 Among the latter, family income
and food prices play an important role.5 Economic
factors seem to have decisive infl uence on F&V intake. Studies from developed countries indicate that diets rich in F&V are more expensive than other diets,6 and
that economic restrictions (such as those faced by low-income families) favor diets with low F&V content and high energy density (due mostly to the high frequency of processed cereals, oils and fats, and sugars).3,4
The need to approach the issue of dietary patterns by means of public economic policies seems to be a consensus in the literature.7,8,12 One potential
interven-tion would be the concession of economic incentives to the consumer, reducing the price of healthy foods relative to non-healthy ones.7,a Interventions of this sort
have the potential to reach a large share of the popula-tion while having an impact in terms of the promopopula-tion of a healthy diet.
Few studies, most of which were carried out in devel-oped countries, have attempted to identify and quantify the infl uence of family income and food prices on dietary patterns.2,c The present study aimed to analyze
the infl uence of family income and food prices on the participation of F&V in the diet of Brazilian families.
METHODS
The data analyzed were obtained form the POF carried out by IBGE between 1 July 2002 and 30 June 2003 on a probabilistic sample of 48,470 households.d POF
2002/03, a cross-sectional study, used a complex clus-tered sampling procedure, with probabilistic selection of census tracts as a fi rst step, followed by the selection of households within each tract. For the selection process, the 215,790 tracts of the 2000 Demographic Census were stratifi ed into groups that were highly homoge-neous with respect to geographic and socioeconomic characteristics. Variables considered in stratifi cation included the location of the tract (Region, State, state
capital/metropolitan area/non-capital, urban/rural) and the range of variation in socioeconomic status among the tract’s households (mean years of schooling of heads of household, according to the 1996 population count) of each geographic site. This process led to 443 strata of geographically and socioeconomically homogeneous households. Households within each tract were selected by simple random sampling without reposition. Household visits were carried out uniformly throughout the study’s four trimesters, so as to reproduce the seasonal variation in income and food purchases (and in purchases of other items as well) in the strata. The major information from the 2002/03 POF analyzed in the present study was a registry of food and drink purchases kept by the household members themselves (or by the interviewer, when necessary) for seven consecutive days. Such a short reference period does not allow us to determine the usual pattern of food purchases of each studied household. We therefore chose to regard as the study unit clusters of households within each of the 443 sampling strata, which ensured study units with a good range of geographic and socio-economic variation, and whose annual food purchase patterns could be determined precisely. The mean number of households investigated within each study unit (stratum) was 109.4, ranging from nine to 804. Purchases of the same food item by the same household were added (roughly 1.3 thousand different food items were mentioned) so as to establish the amount of foods purchased in each study unit. When appropriate, we excluded the inedible portions of food items using the appropriate correction factors.e The total purchased
amount for each food item was converted into energy (kcal) using the Aquinut program,f which is based
largely on the Taco food composition tableg and, for
foods not present in this chart, on the United States Department of Agirulture offi cial nutrient database, version 15.h Following conversion to energy, records
i National Research Council. Commission of Life Sciences. Recommended dietary allowances. 10.ed. Washington, DC; 1989.
and by the number of days in the registry (seven). The fraction of an AE unit attributed to each individual was computed by dividing recommended energy intake for the individual’s sex and age group by that recom-mended for the 18 to 50 years group (2,550 kcal).i AE
fractions were added to obtain the total number of AE units in the stratum.
The relative participation of F&V in total food purchases within a stratum was expressed, for descrip-tive purposes, as a percentage of all calories purchased. In addition, it was calculated the amount of F&V calories adjusted for total calories purchased in the stratum using the residual method.17 This procedure
allows to investigate the association between the rela-tive participation of F&V in total food purchases (and not the absolute amount purchased) and the potential determinants of this participation, such as family income and food prices.
The mean price of F&V and other food purchases in each stratum, expressed in R$/1,000 kcal, was obtained by dividing the total expenditure with a food group by the total calories obtained and multiplying the result by one thousand.
Mean income, expressed in R$/person/month, was obtained by dividing the total monthly income of all households in the stratum by the total population of the stratum. Likewise, the mean age and mean years of schooling of all inhabitants aged 18 years or older were calculated using an analogous approach. The proportion of women and of woman heads of household, in addi-tion to the proporaddi-tion of individuals aged under fi ve or over 64 years, were also estimated. Geographic Region (dichotomized as North/Northeast or South/Southeast/ Center-West) and rural/urban status complemented our characterization of study units.
The major variables – per capita income and price of F&V and other foods – as well as other variables included in the sociodemographic characterization of strata were initially described by central tendency and dispersion measures. The linear association between these variables and income was analyzed using linear regression models having the variable of interest as the outcome and income quartiles (continuous variable) as the explanatory variable.
The relationship between per capita income and price of F&V, with the relative participation of F&V in total calorie purchases (expressed as calories in the group adjusted for total calories) was investigated using multiple regression models by calculating elasticity coeffi cients. These coeffi cients indicate the percent variation (positive or negative) in participation of F&V given a one-percentage-point variation in family income
(income elasticity) or in the price of F&V (own price elasticity). Briefl y, elasticity coeffi cients correspond to the regression coeffi cients (β) of explanatory variables in log-log multiple linear regression models.2,11 The
general model used can be defi ned as:
ln(F&V) = α + β1 ln(I) +β2 ln(Price_A) +β3 ln(Price_B) + χ1(CV) (1),
where:
• F&V is the amount of F&V-derived calories adjusted for total calories purchased;
• I is monthly per capita income (R$);
• Price_A is the price of F&V per unit of energy (R$/1,000 kcal);
• Price_B is the price of foods in the set complemen-tary to F&V per unit of energy (R$/1,000 kcal); • CV are confounding variables.
Variables tested as potential confounders for the asso-ciation between income and prices and F&V participa-tion in total food purchases included: geographic region and rural/urban status of the stratum; mean age of individuals and mean years of schooling of adults (age
≥ 18 years); proportion of woman heads of households, of women, of children younger than age fi ve years, and of adults aged 65 or more, in addition to the mean price paid for the set of foods complementary to F&V. We included as control variables whose introduction in the model led to a variation equal to or greater than 10% on the regression coeffi cient of income or F&V price. Extensions to the general regression model – including quadratic terms for family income and food prices – were tested in order to identify nonlinear relationships between these variables and F&V participation in total food purchases.
All analytical procedures were carried out using the svy family of commands in Stata v.8.2 software, which allowed to considerate the sampling strategy used in POF-IBGE 2002/03.
RESULTS
j Engel E. Die Productions-und Consumtionsverhältnisse des Konigreichs Sachsen. Königlich Sächsischen; 1857. (Zeitschrift des Statistischen Bureaus des Königlich Sächsischen Ministeriums des Innern, 8, 9).
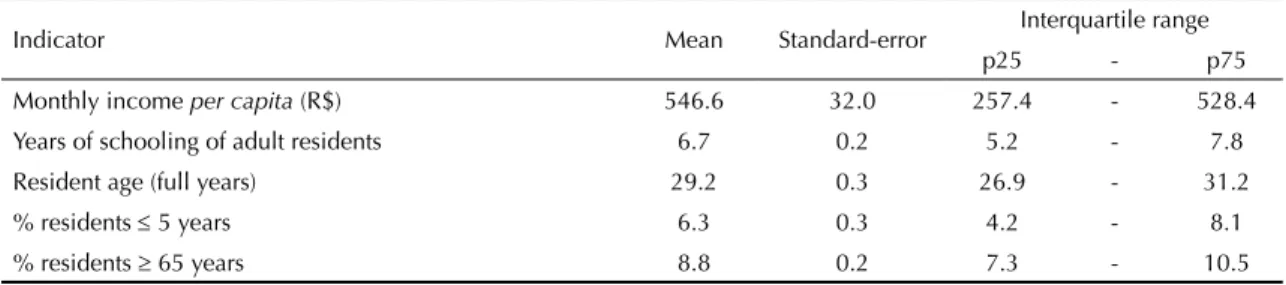
Table 1. Sociodemographic characterization of the 443 household strata studied. Brazil, 2002/03.
Indicator Mean Standard-error Interquartile range
p25 - p75
Monthly income per capita (R$) 546.6 32.0 257.4 - 528.4 Years of schooling of adult residents 6.7 0.2 5.2 - 7.8
Resident age (full years) 29.2 0.3 26.9 - 31.2
% residents ≤ 5 years 6.3 0.3 4.2 - 8.1
% residents ≥ 65 years 8.8 0.2 7.3 - 10.5
Table 2. Mean calories purchased for household consumption, relative participation of fruits and vegetables in total calories, and food prices according to per capita income distribution. Brazil, 2002/03.
Increasing quartiles of per capita income distribution
Total calories purchased (kcal/ AE/ day)
Calories from F&V(kcal/ AE/ day)
F&V participation (% of total calories
purchased)
F&V price (R$/1,000kcal)
Price of other foods (R$/1,000kcal)
1º 2060.3* 32.0* 1.6* 4.13* 0.82*
2º 2231.1 42.0 1.9 4.51 0.92
3º 1936.2 49.9 2.7 4.53 1.11
4º 1884.0 75.7 4.0 5.10 1.53
Total 2028.3 49.6 2.5 4.46 1.06
AE: adult-equivalent; F&V: fruits and vegetables
*p < 0.001 for linear trend in variation according to increasing income class.
Both relative participation of F&V and its price and other foods tended to increase along with the economic level of families (Table 2).
Income elasticity in the model controlling for food prices and sociodemographic variables (model 3) was 0.27, indicating that a one-percentage-point increase in
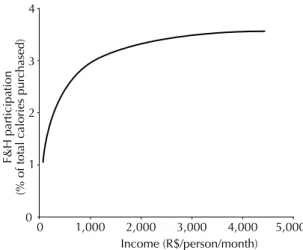
per capita monthly income would increase the partici-pation of F&V in total food purchases by 0.27%. In the same model, price elasticity was -0.79, indicating an opposite effect 2.5 times greater than that of income, with a one-percentage-point reduction in price of F&V leading to a 0.79% increase in participation of this group in total household calorie purchases (Table 3). The Figure presents the curve of predicted values for relative participation of F&V in total calorie purchases according to variations in per capita income, given by a fourth regression model that, in addition to control-ling for food prices and sociodemographic variables, includes a simple and a quadratic term for per capita
income (both signifi cant at p < 0.05). The slope of the curve is greater when variations in income occur in the segment of households with lower income, and decreases progressively until almost disappearing in the higher-income segment. Unlike what we found for income, there was no evidence of signifi cant nonlinear relationships between food prices and F&V participa-tion in total calorie purchases.
DISCUSSION
We found an increase in the participation of F&V in the total food purchases of Brazilian households along with decreases in F&V price or increases in family income. The magnitude of income-elasticity tended to be smaller in higher income strata, since the participa-tion of food in household expenditures decreases as income increases.j F&V price-elasticity showed no
consistent relationship with income stratum.
The association with income and food prices detected in the present study do not refers to absolute purchases of fruits and vegetables, but to their relative participation in the total of foods purchased. There is not reason to believe that the results obtained would be substan-tially altered if we had been able to evaluate also food consumed outside home. The proportion of food that is acquired for consumption in the household represents 76% of total food purchases in urban households and 88% in rural ones.15 If we assume that the price of foods
location and socioeconomic characteristics, which were studied uniformly throughout the year.
The major advancement in the present study, in relation to the available literature, resides in the application of nutrition-related procedures to a nationwide database. Few prior studies have estimated income-elasticity and F&V price-elasticity in the diet of populations from developing countries, especially with the intent to promote healthy dietary practices. In most studies, F&V intake is evaluated according to its participation in total household expenditures or based on the absolute amount purchased.k,l This does not allow one to evaluate
the most important aspect of F&V intake, namely whether F&V are added to the diet in replacement of foods with higher energy density and lower nutritional value. A study2 of data generated by a POF carried out
by the Fundação Instituto de Pesquisas Econômicas (Fipe), on a representative sample of the population of the city of São Paulo, Southeastern Brazil, and using methods similar to those adopted in the present study, found a similar relationship between elasticity coeffi -cients. As in the present one, the study conducted with Fipe data found a weaker infl uence of income on F&V participation when compared to that exerted by F&V price, though the magnitude of both elasticity values was lower, 0.03 and -0.20, respectively.2
The results of the present study indicate that income increases, especially among poorer families, and reduc-tion in F&V prices are an effective form of increasing the participation of F&V in the diet of Brazilian house-holds (from 2.5% of total calories to the recommended 6-7%). The primary means to increase the income of the poorest strata of society in a direct and immediate manner seems to be the direct transfer of income.10
Successful income transfer programs have been imple-mented in Brazil in recent years.m The participation of
F&V in the diet of poorer families is likely to have been even lower in the absence of such programs.
Policies that lead to reduction of the price of F&V relative to that of other foods are not in operation in Brazil. Such a measure is highly likely to obtain effec-tive results in the short term, since it directly infl uences consumers’ choices. Reducing the tax burden on F&V – which is currently at around 28% for fruits and 22% for vegetablesn – is a potentially successful intervention,
given that it does not require great fi nancial investments from public administration (it is based on renouncing due taxes), in addition to targeting the reduction in price to the consumer. Our results show that reducing the mean price of F&V by 20% would raise the participa-tion of these foods in the Brazilian diet by about 16% (or from current levels to approximately 3% of total calories). The obvious disadvantage of tax exemption is the risk of an imbalance in the relationship between
k Hoffmann R. Elasticidades-renda das despesas com consumo físico de alimentos no Brasil metropolitano em 1995-1996. Agric São Paulo. 2000;47(1):111-22.
l You Z, Epperson JE, Huang CL. Consumer demand for fresh fruits and vegetables in the United States. Research Bulletin. Athens; 1998 [cited 2009 Apr 4]. (Research Bulletin University of Georgia, 431). Available from: http://pubs.caes.uga.edu/caespubs/pubs/PDF/RB431.pdf m Ministério da Saúde. Avaliação do programa Bolsa Alimentação. Brasília, DF; 2005.
n Amaral GL, Olenike JE, Viggiano LMFA. Estudo sobre o verdadeiro custo da tributação no Brasil. Curitiba: Instituto Brasileiro de Planejamento Tributário, [s.d.] [cited 2009 Apr 4]. Available from: http://www.ibpt.com.br/img/_publicacao/9169/142.pdf Figure. Predicted values in a regression model for relative
participation of fruit and vegetables in total calories accor-ding to variations in the magnitude of family income. Brazil, 2002/03.
Note: model controlled for food price and
sociodemographic variables, with simple and quadratic terms for family income
Income (R$/person/month)
F&H participation
(% of total calories pur
chased)
0 1 2 3 4
0 1,000 2,000 3,000 4,000 5,000
Table 3. Elasticity of relative participation of fruit and vegetables in household calorie purchases in relation to per capita family income and fruit and vegetable price, obtained using regression models. Brazil, 2002/03.
Explanatory variables Models
1 2 3
Per capita income (R$) 0.52 0.62 0.27
Price of fruit and vegetables
(R$/1,000 cal) a -0.77 -0.79
R2 0.64 0.73 0.79
Note: All regression coeffi cients presented are statistically signifi cant at p < 0.001.
a Variable not used in the model. Model 1: adjusted for per capita income;
Model 2: adjusted for per capita income and mean F&V price;
1. Abdulai A, Aubert D. A cross-section analysis of household demand for food and nutrients in Tanzania.
Agri Econ. 2004;31(1):67-79. DOI:10.1111/j.1574-0862.2004.tb00222.x
2. Claro RM, Carmo HCE, Machado FMS, Monteiro CA. Renda, preço dos alimentos e participação de frutas e hortaliças no consumo alimentar das famílias do município de São Paulo. Rev Saude Publica. 2007;41(4):557-64. DOI:10.1590/S0034-89102007000400009
3. Darmon N, Ferguson E, Briend A. Do economic constraints encourage the selection of energy dense diets? Appetite. 2003;41(3):315-22. DOI:10.1016/ S0195-6663(03)00113-2
4. Darmon N, Ferguson EL, Briend A. A cost constraint alone has adverse effects on food selection and nutrient density: An analysis of human diets by linear programming. J Nutr. 2002;132(12):3764-71.
5. De Irala-Estevez J, Groth M, Johansson L, Oltersdorf U, Prattala R, Martinez-Gonzalez MA. A systematic review of socio-economic differences in food habits in Europe: consumption of fruit and vegetables.
Eur J Clin Nutr. 2000;54(9):706-14. DOI:10.1038/ sj.ejcn.1601080
6. Drewnowski A, Darmon N, Ferguson E, Briend A. Replacing fats and sweets with vegetable and fruits – a question of cost. Am J Public Health.
2004;94(9):1555-9. DOI:10.2105/AJPH.94.9.1555
7. Drewnowski A, Darmon N. Food choices and diet costs: an economic analysis. J Nutr. 2005;135(4):900-4.
8. Drewnowski A, Rolls BJ. How to modify the food environment. J Nutr. 2005;135(4):898-9.
9. European Food Information Council. The determinants of food choice. EUFIC Rev. 2005;17:1-7.
10. Fernald LCH, Gertler PJ, Neufeld LM. Role of cash in conditional cash transfer programmes for child helth, growth, and development: an analysis of Mexico’s Oportunidades. Lancet. 2008;371(9615):828-37. DOI:10.1016/S0140-6736(08)60382-7
11. Guo X, Popkin BM, Mroz TA, Zhai F. Food price can favorably alter macronutrient intake in China. J Nutr. 1999;129(5):994-01.
12. Jacobson MF, Brownell KD. Small taxes on soft drinks and snack foods to promote health. Am J Public Health.
2000;90(6):854-7. DOI:10.2105/AJPH.90.6.854
13. Levy-Costa RB, Sichieri R, Pontes NS, Monteiro CA. Disponibilidade domiciliar de alimentos no Brasil: distribuição e evolução (1974-2003). Rev Saude Publica. 2005;39(4):530-40. DOI:10.1590/S0034-89102005000400003
14. Liu S, Manson JE, Lee IM, Cole SR, Hennekens CH, Willett WC, et al. Fruit and vegetable intake and risk of cardiovascular disease: the Women’s Health Study. Am J Clin Nutr. 2000;72(4):922-8.
15. Sarno F, Claro RM, Levy RB, Bandoni DH, Ferreira SRG, Monteiro CA. Estimativa de consumo de sódio pela população brasileira, 2002-2003. Rev Saude Publica. 2009;43(2):219-25. DOI:10.1590/S0034-89102009005000002
16. Van Duyn MA, Pivonka E. Overview of the health benefi ts of fruit and vegetable consumption for the dietetics professional: selected literature. J Am Diet Assoc. 2000;100(12):1511-21. DOI:10.1016/S0002-8223(00)00420-X
17. Willett W, Stampfer MJ. Total energy intake: Implication for epidemiologic analyses. Am J Epidemiol. 1986;124(1):17-27.
18. World Health Organization. Reducing risks, promoting healthy life. Geneva; 2002.(The world health report 2002).
REFERENCES
Article based on the doctoral thesis of Claro RM, presented at the Faculdade de Saúde Pública da Universidade de São Paulo, in 2010.
Claro RM was supported by Fundação de Amparo à Pesquisa do Estado de São Paulo (Fapesp - Process no. 2007/00064-8; doctoral scholarship).
Work presented at the Campus of Excellence 2008, in Maspalomas/Gran Canaria. The authors declare no confl ict of interest.
supply and demand for these foods, in case that supply is not equally stimulated.
Creating special lines of credit aimed at F&V produc-tion could constitute an alternative for promoting its price reduction. This alternative has the advantage of stimulating supply and demand simultaneously, minimizing the risk of shortages and consequent price increases. The disadvantage of this type of process is the possibility that the price reduction could be absorbed during the chain from production to commercializa-tion of F&V and never reach the fi nal consumer. The imposition of a small tax on unhealthy foods or food
groups – such as, for instances, foods with high sodium or sugar content – could provide a solution for obtaining resources for subsidizing F&V. In the present study, we analyze the impact of variations in the price of specifi c food groups on F&V intake; however, we did not detect a pattern capable of conclusively indicating the best candidates for these taxations.