INTRODUCTION
Article/Artigo
1. Programa de Pós Graduação em Saúde Coletiva, Universidade Federal do Espírito Santo, Vitória, ES. 2. Departamento de Medicina Social e Unidade de Medicina Tropical, Universidade Federal do Espírito Santo, Vitória, ES. 3. Departamento de Estatística, Universidade Federal do Espírito Santo, Vitória, ES.
Address to: Dra. Poliane Barbosa Sampaio. R. Maria Eleonora Pereira 605/302, Bloco 15, Edifício Fênix II, Jardim da Penha, 29060-180 Vitória, ES, Brasil.
Phone 55 27 8153-3565
e-mail: [email protected]
Received in 03/07/2011
Accepted in 30/09/2011
Spatial analysis of new cases of leprosy in the State of Espírito Santo,
Brazil, between 2004 and 2009
Análise espacial dos casos novos de hanseníase no Estado do Espírito Santo, Brazil,
entre 2004 e 2009
Poliane Barbosa Sampaio
1, Tiago Lessa Rossi
1, Crispim Ceruti Junior
2and
Eliana Zandonade
1,3ABSTACT
Introduction: Leprosy in Brazil is a public health issue, and there are many regions in the State of Espírito Santo with high endemic incidence levels of leprosy, characterizing this state as a priority for leprosy programs. he aim of this study was to determine the spatial distribution of coeicients of new cases of leprosy in the State of Espírito Santo, Brazil. Methods: We conducted a descriptive and ecologic study based on the spatial distribution of leprosy in the State of Espírito Santo between 2004 and 2009. Data were gathered from the available records of the Espírito Santo State Health Secretary. he global and local Bayesian empirical methods were used to produce an estimate of leprosy risk, smoothing the luctuation efects of the detection coeicients. Results: he study resulted in a coeicient adjustment of new cases in 10 towns that changed their classiication, among which, 2 went from low to medium, 4 from medium to high, 3 from high to very high, and 1 from very high to hyper-endemic. An average variation of 1.02, luctuating between 0 and 12.39 cases/100,000 inhabitants, was found in a comparative calculation between the Local Ebest value and the average coeicient of new leprosy cases in the State of Espírito Santo. Conclusions: he spatial analysis of leprosy favors the establishment of control strategies with a beter cost-beneit relationship since it reveals speciic and priority regions, thereby enabling the development of actions that can interfere in the transmission chain.
Keywords: Leprosy. Epidemiology. Spatial distribution.
RESUMO
Introdução: A hanseníase no Brasil ainda é um problema de saúde publica e, no Estado do Espírito Santo, Brasil, há várias regiões com elevados níveis endêmicos, fato que o coloca entre os prioritários para o programa de controle da hanseníase. O objetivo deste estudo é determinar a distribuição espacial dos coeicientes de casos novos de hanseníase no Estado do Espírito Santo. Métodos: Estudo descritivo, ecológico baseado na distribuição espacial da hanseníase no Estado do Espírito Santo, entre 2004 e 2009. A fonte de dados utilizada foram os registros disponíveis na Secretaria de Estado da Saúde do Espírito Santo. Na análise espacial, foi aplicado o método bayesiano empírico global e local para produzir uma estimativa do risco da hanseníase, suavizando o efeito da lutuação dos coeicientes de detecção. Resultados:
O estudo resultou em ajuste de coeiciente de casos novos em 10 municípios que mudaram de classiicação, sendo dois de baixo para médio, quatro de médio para alto, três de alto para muito alto e um município mudou da categoria muito alto para hiperendêmico. Através de um calculo comparativo entre o Ebest Local e o coeiciente médio de detecção de casos novos de hanseníase do Estado do Espírito Santo houve uma variação média de 1,02, lutuando entre zero a 12,39 por 100.000 habitantes. Conclusões: A análise espacial da hanseníase favorece o estabelecimento de estratégias de controle com uma melhor relação custo-benefício, pois indica regiões especíicas e prioritárias, planejando ações a im de interferir na cadeia de transmissão.
Palavras-chaves: Hanseníase. Epidemiologia. Distribuição espacial.
In 2009, the World Health Organization (WHO) reported 244,796 new cases of leprosy in 141 countries; thus, leprosy is still an important public health issue in the world1. Brazil has recently
prioritized the transmission of leprosy between adolescents aged <15 years2 as the indicator of
leprosy endemic monitoring, thus strengthening the idea of the active transmission of this disease3.
Leprosy is an important endemic disease that is caused by the Hansen (Mycobacterium leprae) bacillus, which has high infectivity and a long incubation period. Its prevalence in Brazil, according to the 2010 WHO epidemiologic report, is 21.94 cases/100,000 inhabitants. Regarding the absolute number of leprosy cases, Brazil has the highest number in Latin America and the second highest endemic incidence ater India. If we consider the quality of health services and access to public health in Brazil, these numbers may have been underestimated1,4.
Since leprosy is a disease with a heterogeneous distribution, distinct tendencies are found in relation to its control and prevalence. Characteristic of the aforementioned situation, the State of Rio Grande do Sul, Brazil, has reached the goal of reducing its prevalence, and in 2008 presented a coeicient of 1.65 cases/100,000 inhabitants, which is lower than the coeicient found in Brazil2,5. In 2009, the State
of Espírito Santo was the only state in the southeast of the country presenting high endemic levels, thus being categorized as a priority region for control programs of this disease2,6,7.
Epidemiologically, there was a decrease in its prevalence; however, the coefficient of leprosy detection was not altered. At the highest endemic level position, 43,175 new cases were reported in 2,000 locations in Brazil with a detection coeicient of2.70 cases/10,000 inhabitants. In 2008, 38,992 cases were detected, with a detection coeicient of 20.56 cases/10,000 inhabitants2. he persistence
METHODS
RESULTS
TABLE 1 -New annual cases of leprosy and detection coeicients in Espírito Santo, Brazil, 2004-2009.
General coeicient
Year Population New cases detection
2004 3,298,541 1,554 47.11
2005 3,464,280 1,512 43.65
2006 3,464,280 1,209 34.90
2007 3,519,712 1,233 35.03
2008 3,453,648 1,097 31.76
2009 3,487,094 1,048 30.05
Source: National System of Notiication.
prevalence that is not detected by the health system, which only detects existing late cases8.
his study aimed to determine the spatial distribution of new leprosy coeicient cases in the State of Espírito Santo from 2004-2009.
his was a descriptive and ecologic study using the secondary data available in the records of the Espírito Santo State Health Secretary. he State of Espírito Santo is made up of 78 towns with a population of ~3,487,094 inhabitants in 2009 (Source: IBGE, 2007)9.
We analyzed the leprosy case data of town dwellers identiied from 2004-2009. he raw incidence rate was calculated by dividing the sum of new cases in the 6 years analyzed by the sum of the population in that period and the result was multiplied by 100,000.
he Bayesian approach (i.e., local and global empirical Bayesian methods10) was used for the spatial analysis of the data and for the
correction of the epidemiologic rate. he local empirical Bayesian estimator is a form-adjusted rate: bi =witi + (l - wi)m. Where, ti is the risk rate for leprosy, m is the global rate for the State of Espírito Santo, and wi is the weight between 0 and 1, which depends on the size of the population in the area (i).
Next, the spatial correlations of new leprosy case coeicients and town components were analyzed. his analysis allowed the elimination of random luctuations of rates, and according to this analysis, it was possible to determine whether the spatial distribution of the new cases was random or whether it followed a spatial occurrence patern.
From 2004-2009, the coeicient detection for leprosy in the State of Espírito Santo varied between hyper-endemic to very high (Table 1). he average detection in that period was 37.08 cases/100,000 inhabitants, which was also classiied as very high.
he analysis of the average detection of leprosy in the towns showed that in the 78 towns of the State of Espírito Santo, 25 (32%) were classiied as hyper-endemic, 21 (26.9%) as having very high endemicity, and 2 (2.6%) as having low endemicity.
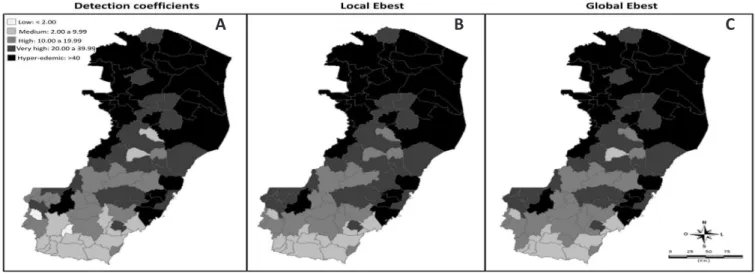
When the detection of leprosy in the state was compared against the average in the neighboring areas, the Bayesian method generated corrected and less unstable coeicients (i.e., Ebest Local and Ebest Global values). he thematic map produced shows that 10 (12.8%) towns changed classiication according to the oicial parameters (Figure 1). Among the towns that changed classiication, only 2, i.e., Divino de São Lourenço and Jerônimo Monteiro, changed from low to medium; 4 towns, i.e., Alegre, Marilândia, São Roque do Canaã, and Vargem Alta, changed from medium to high, 3 towns, i.e., Irupi, Iúna, and Santa Leopoldina, changed from high to very high, and 1 town, i.e., Vila Pavão, changed from very high to hyper-endemic.
A comparative calculation between the Local Ebest value and the average coeicient of new leprosy cases in the State of Espírito Santo To complement the spatial autocorrelation studies, the Moran I index was calculated for spatial dependency at a global level, on the basis of the assumption of normality and randomization, with the understanding that in most cases it varies between -1 and +1, and when there is no spatial correlation its value is close to zero11.
he analysis was conducted using the following programs to generate maps, rate, and index calculations: Excel, R 2.6.2, SPSS 11.5, and Terra View 3.3.1.
Ethical considerations
Regarding the ethical aspects of this study, it is important to stress the fact that this research endeavor was made in accordance with resolution no. 196/96 of the National Health Board, and this project was approved by the Ethics Board for Research of the Federal University of Espírito Santo under no. 069/10.
FIGURE 1 -Maps of the detection average coeicient for leprosy cases. Espírito Santo, Brazil, 2004-2009.
A: Gross coeicient. B: Adjusted coeicient using the Local Ebest method. C: Adjusted coeicient using the Global Ebest method.
showed an average variation of 1.02, luctuating between 0-12.39 cases/100,000 inhabitants.
Analysis of the spatial distribution of new cases based on the average detection coeicient, which is probably inluenced by the operational procedures of the control program, is best carried out by using smoothing techniques. he spatial distribution patern of leprosy in Espírito Santo, ater the use of the Bayesian empirical model of smoothing, showed a concentrated patern of cases in the northern macro-region of the state.
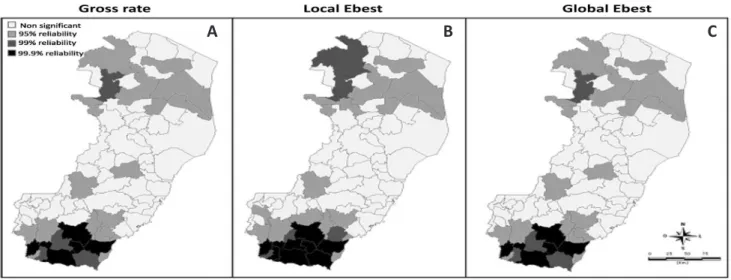
A value of 0.425 (p < 0.001) for the Moran Index was calculated using the local Ebest data. It is important to highlight the existence of spatial autocorrelation in the State of Espírito Santo in relation to the average detection coeicients, as shown in Figure 2.
The conglomerate detection test identified the existence of 2 clusters: 1 in the south, with 99.9% reliability, encompassing the towns of Cachoeiro de Itapemirim, Presidente Kennedy, São Jose do Calçado, Apiacá, Mimoso do Sul, Atílio Vivacqua, and Muqui e Itapemirim; and another in the North, with 99% reliability, consisting of only 2 towns, i.e., Ecoporanga and Barra de São Francisco.
FIGURE 2 -Maps of Moran spatial correlation of cities in the State of Espírito Santo according to conglomerates of leprosy detection. Espírito Santo, Brazil, 2004-2009.
A: Gross coeicient. B: Adjusted coeicient using the Local Ebest method. C: Adjusted coeicient using the Global Ebest method.
A B C
DISCUSSION
Mirroring the distribution of leprosy in Brazil, the distribution of leprosy in the State of Espírito Santo has an irregular distribution among areas; thus, public health managers must acknowledge the epidemiologic situation so as to take priority actions depending on each situation.
Spatial analysis is a tool capable of strengthening control programs for leprosy in endemic towns. he choice of this type of method reduces operational costs and does not hinder other analyses; however, it is important to consider its limitations, such as the use of secondary data, which are oten inconsistent when it comes to the quantity and quality of information.
Recent articles using the spatial distribution technique to detect leprosy cases from detection coeicients show that the use of smoothing techniques is eicient, even when these techniques are inluenced by the operational procedures of the control program.
This method is useful because it captures spatial effects due to the inluences of neighboring towns, rendering the analysis of the existence of a high transmission potential in determined areas possible, as well as the possibility of the under-registration of cases from the deduction of the random luctuation of cases12-14.
Each spatial analysis technique has its own advantages and disadvantages. The use of smoothing techniques allows the identiication of areas with more transmission power. his leads to a reflection on the need to identify leprosy risk factors that may contribute to its increase in certain areas and suggests the investigation of a more active strategy such as the use of efective surveillance of cases among household contacts15,16.
he calculation of these Local and Global Ebest values shows an approach that is capable of detecting endemic areas and they provide support for control strategies for leprosy since this method smoothens the fractionation of regions based on political and administrative criteria that, in turn, may hide areas of risk.
An ecologic study of childhood tuberculosis conducted in the State of Espírito Santo corroborated the use of spatial analysis methodologies so as to adjust small areas with a low incidence of the disease and to acknowledge possible areas of recent transmission17.
here are towns in the northern macro-region of the state that have a low detection index in relation to neighboring towns. his almost epidemiologic silence of a few diagnosed cases shows that the local health service has low sensitivity to detect leprosy. hus, this distribution in the state is as worrying as the one in the towns with a high detection coeicient.
he authors declare that there is no conlict of interest. CONFLICT OF INTEREST
FINANCIAL SUPPORT
REFERENCES he conglomerate in the northern region of the state is part of
cluster 4 of the Health Ministry, together with towns in the southern part of Bahia and the northeastern part of Minas Gerais18. The
northern macro-region of the state is classiied as a hyper-endemic region, conirming its priority condition for programs to control the disease in this state.
A study based on the spatialization of leprosy in Manaus, conducted by Imbiriba et al., used thematic maps to show that areas with high concentration rates of leprosy are directly related to socio-demographic characteristics, and also showed consolidated endemic disease in poor areas, justifying the fostering of transmission by a dispersed population with high susceptibility, precarious life conditions, and poor access to health services19.
According to Magalhães et al., high detection rates of leprosy are related to poverty and social factors16. Many situations observed
in recent studies show inequalities among the regions in Brazil with the northern and northeastern regions in a disadvantageous position in relation to the southern and southeastern regions, which despite recent advances, still present leprosy as a considerable public health problem. hus, the challenges regarding leprosy are large2,12,20.
Detection coeicients are indicators of the transmissibility of leprosy21. Nevertheless, the reduction of such coeicients is related to
the way in which health services are organized to provide assistance for health and leprosy. hus, this decrease may be a result of a lack of awareness and a substitution of active detection by passive detection or even incorrect diagnosis22.
Domestic contacts represent the main contagious route of the disease, and active detection of leprosy cases represents the most eicient way to eradicate the disease. Surveillance actions must be made with intra-domestic contacts since people in the same family are more exposed to the disease. his strategy is important to eradicate or reduce leprosy cases23.
In the case of leprosy, a spatial analysis using geostatistics helps to identify risk areas, thus supporting control and eradication strategies for the disease. his method also impedes the artiicial fractioning of regions based on political and administrative criteria. However, this analysis tool requires reliable information, both from maps and epidemiologic data in relation to leprosy24.
he results of the present study conirm the gravity of the leprosy situation in the northern macro-region of the State of Espírito Santo as shown by the heterogeneous spatial distribution of the disease. he Bayesian empirical local method was useful to understand the spatial efects due to the inluence of neighboring towns as shown in the smoothest and easiest to understand thematic map.
Despite the ecologic limitations of the study, spatial analysis allows the observation of areas that should be prioritized by control and plan actions for the disease. Professional training of health professionals seems to be necessary as well as the expansion of case searching, especially regarding informers so as to reduce its transmission.
This study received financial support through the official announcement MCT/CNPq/CT - Health/MS/SCTIE DECIT no. 034/2008, Additional studies for aiding interventions for the control of leprosy in the counties of cluster no. 4 (ES, BA and MG).
1. World Health Organization (WHO). Weekly epidemiological record 2010; 85:337-348.
2. Ministério da Saúde, Secretaria de Vigilância em Saúde. Programa Nacional de Controle da Hanseníase. Hanseníase no Brasil: dados e indicadores selecionados. Brasília (DF): Ministério da Saúde; 2009.
3. Cunha MDC, Cavaliere FAM, Hercules FM, Duraes SMB, Oliveira MLW, Matos HJ. Os indicadores da hanseníase e as estratégias de eliminação da doença, em município endêmico do Estado do Rio de Janeiro. Cad Saude Publica 2007; 23:1187-1197.
4. Lapa T, Ximenes R, Silva N, Souza W, Albuquerque MFM, Campozana G. Vigilância da hanseníase em Olinda, Brasil, utilizando técnicas de análise espacial. Cad Saude Publica 2001; 17:1153-1162.
5. Silva Sobrinho A, Mathias TAF. Perspectivas de eliminação da hanseníase como problema de saúde pública no Estado do Paraná, Brasil. Cad Saude Publica 2008; 24:303-314.
6. Moreira MV, Waldman EA, Martins CL. Hanseníase no Estado do Espírito Santo, Brasil: uma endemia em ascensão? Cad Saude Publica 2008; 24:1619-1630. 7. Secretaria de Estado da Saúde do Espírito Santo, Superintendência de
Planejamento Epidemiologia e Informação. Programa estadual de controle da hanseníase no Espírito Santo. Hanseníase - dados epidemiológicos - ano 2009. Vitória: Secretaria de Estado da Saúde do Espírito Santo; 2009.
8. Goulart IMB, Santos MS, Muniz DLO, Barbosa FM, Cardoso Netto J, Chaves JGM, et al. Caracterização da endemia hansênica no Município de Uberlândia - Minas Gerais, Brasil 1996-2000. Hansenol Int 2006; 31:33-40. 9. Fundação Instituto Brasileiro de Geograia e Estatística. Censo Demográico
2007 - Agregado por setores censitários dos resultados do universo. Espírito Santo: IBGE; 2007.
10. Bailey TC, Gatrell AC. Interactive Spatial Data Analysis. London:
Essex-Longman; 1995.
11. Anselin L. Local indicators of spatial Asssociation - LISA. Geogr Anal 1995; 27:93-115.
12. Villa TCS, Cunha TN, Santos CB. Distribuição espacial de doenças endêmicas no município de Ribeirão Preto (SP). Cienc Saude Colet 2011; 16 (supl 1): 1289-1294.
13. Amaral EP, Lana FCF. Análise espacial da Hanseníase na microrregião de Almenara, MG, Brasil. Rev Bras Enferm 2008; 61 (esp):701-707.
14. Silva DRX, Ignotti E, Souza-Santos R, Hacon SS. Hanseníase, condições sociais e desmatamento na Amazônia brasileira. Rev Panam Salud Publica 2010; 27:268-275.
15. Queiroz JW, Dias GH, Nobre ML, Dias MCS, Araújo SF, Barbosa JD, et al. Geographic Information Systems and Applied Spatial Statistics Are Eicient Tools to Study Hansen’s Disease (Leprosy) and to Determine Areas of Greater Risk of Disease. Am J Trop Med Hyg 2010; 82:306-314.
16. Magalhães MCC, Rojas LI. Diferenciação territorial da hanseníase no Brasil. Epidemiol Serv Saude 2007; 16:75-84.
17. Sales CMM, Figueiredo TAM, Zandonade E, Maciel ELN. Análise Espacial da tuberculose infantil no Estado do Espírito Santo, 2000 a 2007. Rev Soc Bras Med Trop 2010; 43:435-439.
18. Penna MLF, Oliveira MLW, Penna G. Spatial Distribuition of leprosy in the Amazon Region of Brazil. Emerg Infect Dis 2009; 15:650-652
20. Declercq E. Leprosy statistics 2009: some thoughts. Lepr Rev 2011; 82:87-89. 21. International Federation of Anti-Leprosy Associations (ILEP). he interpretation
of epidemiological indicators in leprosy. London: Technical Bulletin; 2001. 22. Pinto Neto JM, Villa TCS. Características epidemiológicas dos comunicantes
de hanseníase que desenvolveram a doença, notiicados no Centro de Saúde de
Fernandópolis (1993 a 1997). Hansen Int 1999; 24:129-136.
23. Leite KKC, Costa JML, Barral A, Caldas AJM, Corrêa RGCF, Aquino DMC. Peril epidemiológico dos contatos de casos de hanseníase em área hiperendêmica na Amazônia do Maranhão. Cad Saude Colet 2009; 17:235-249.