Gloria Valeria da VeigaI
Rosana Salles da CostaI
Marina Campos AraújoII
Amanda de Moura SouzaII
Ilana Nogueira BezerraII
Flávia dos Santos BarbosaIII
Rosely SichierIV
Rosangela Alves PereiraI
I Departamento de Nutrição Social e Aplicada. Instituto de Nutrição Josué de Castro. Universidade Federal do Rio de Janeiro. Rio de Janeiro, RJ, Brasil II Programa de Pós-Graduação em Saúde
Coletiva. Instituto de Medicina Social. Universidade do Estado do Rio de Janeiro. Rio de Janeiro, RJ, Brasil
III Departamento de Nutrição Social. Instituto de Nutrição. Universidade do Estado do Rio de Janeiro. Rio de Janeiro, RJ, Brasil IV Departamento de Epidemiologia. Instituto
de Medicina Social. Universidade Estadual do Rio de Janeiro. Rio de Janeiro, RJ, Brasil Correspondence:
Gloria V Veiga
Departamento de Nutrição Social e Aplicada, Instituto de Nutrição Josué de Castro – UERJ Av. Carlos Chagas Filho, 373 Bloco J 2º andar 21941-590 Rio de Janeiro, RJ, Brasil E-mail: [email protected] Received: 11/28/2011 Approved: 9/9/2012
Article available from: www.scielo.br/rsp
Inadequate nutrient intake in
Brazilian adolescents
ABSTRACT
OBJECTIVE: to assess energy and nutrient consumption and the prevalence of inadequate micronutrient intake among Brazilian adolescents.
METHODS: A random sample composed of 6,797 adolescents (49.7% girls), between 10 and 18 years old, was evaluated in the fi rst National Dietary Survey, part of the Household Budget Survey carried out in 2008-2009. Expansion factors, sample complexity design and correction of intraindividual variability were considered. The prevalence of inadequate micronutrient intake was based on the proportion of adolescents with intake below the Estimated Average Requirement. The prevalence of intake above the Tolerable Upper Intake Level (UL) was estimated for sodium.
RESULTS: The mean energy intake ranged between 1,869 kcal (10 to 13 year old females) and 2,198 kcal (14 to 18 year old males). Of the total energy intake, 57% came from carbohydrates, 27% from lipids and about 16% from proteins. Inadequacies were higher for calcium (> 95%), phosphorous (54% to 69%) and vitamins A (66% to 85%), E (100%) and C (27% to 49%). More than 70% of adolescents reported sodium intake above the UL.
CONCLUSIONS: Mean energy consumption and distribution of macro-nutrients were adequate, but prevalence of inadequate vitamin and mineral intake were high and notable consumption of sodium above the recommended levels, low levels of calcium consumption and, in 14 to 18 year old females, important inadequacies in iron intake were found.
Inadequate micronutrient intake in adolescents Veiga GV et al
Interest in adolescents’ diet and nutrition is justifi ed by the evidence linking diet at this stage of life with the risks of chronic illness in adult life.23
In Brazil, high levels of consumption of high calorie food, high concentrations of sodium, saturated fat, sugar, sweetened drinks and fast food snacks, as well as low levels of fruit and vegetable consumption20 is
considered to be an important risk factor for obesity
and co-morbidities.26 Consequently, overweight and
obesity has increased dramatically among Brazilian adolescents in the last 35 years,a as well as diseases
associated with obesity.30
Adolescents are also susceptible to nutritional defi cien-cies, especially iron, calcium, zinc and vitamins A, C, D, E and B, due to their bodies’ increased demand for nutrients to meet the fast growth rate which characte-rizes this stage of life.29
Study with a probabilistic sample in the city of São Paulo,32 Southeastern Brazil, revealed a high proportion
of adolescents aged 14 to 18 with inadequate magne-sium and vitamins A, B6, C and E intake.
In 2008-2009, the IBGE (Brazilian Institute of Geography and Statistics) undertook the 5th Household
Budget Surveywhich included a survey of individuals’ diets, consisting of the fi rst National Dietary Survey.b
This study aimed to estimate calorie and nutrient consumption and the prevalence of inadequate nutrient intake among Brazilian adolescents.
METHODS
Data from the National Dietary Survey, part of the 2008-2009 Household Budget Survey, was used. More detailed information on the sample and data collection have been previously published.b In short, the
2008-2009 Household Budget Survey used two stage cluster sampling. In the fi rst stage, primary sample units (PSU), previously stratifi ed according to the head of household mean income, were selected. The PSU were selected for sampling, with probability proportional to the number of residences in each PSU, which corresponded to the geographically based PSU of the 2000 Demographic Census. In the second stage, permanent residences were selected by simple random sampling, without replace-ment, in each PSU. Of the 68,373 residences sampled, a subsample of 25% was calculated for the National Dietary Survey, so that a quarter of the residences in each PSU were selected, totaling 16,764 residences.
INTRODUCTION
a Instituto Brasileiro de Geografi a e Estatística. Pesquisa de Orçamentos Familiares, 2008-2009: antropometria e estado nutricional de crianças, adolescentes e adultos no Brasil. Rio de Janeiro; 2010.
b Instituto Brasileiro de Geografi a e Estatistica. Pesquisa de Orcamentos Familiares, 2008-2009: analise do consumo alimentar pessoal no Brasil. Rio de Janeiro; 2011.
Taking into consideration the 19% of no responses, 13,569 residences were evaluated. All inhabitants aged ten and over took part, totaling 34,032 individuals. Of these, 6,939 were adolescents (20.4%) aged between ten and 18 years, 3,519 female (51.7%). Those who were pregnant and/or breastfeeding were excluded from the study (n = 142), leaving a total of 6,797 adolescents studied, of which 3,377 were female (49.7%). Data collection lasted 12 months and was carried out between 2008 and 2009.
Food intake was estimated by means of two non-consecutive days’ food records, proceeding
required to estimate habitual consumption.31 The
adolescents interviewed were instructed to note all food and beverages consumed on the days in question in a special notebook, noting time, quantity consumed in portion size, method of preparation and place consumed (in the home or outside the home). A question was included on sugar and/or sweetener consumption. If any of the adolescents were unable to complete the food record, it was fi lled out with the help of another member of the household or someone nominated by them.
Data was introduced by interviewers in the homes of the interviewees, using a data entry program specially designed for the food intake module, at the same time as the completed notebooks were collected. At this time, the foods recorded were also checked and any necessary corrections based on standardized survey procedures were made. This program includes a database with around 1,500 items (food, beverages and dishes) based on food and beverages taken from 5,686 records contained in the 2002-2003 Household Budget Survey database of household food and beverage acquisition. Food items which did not appear in the database were included by the interviewers. At the end of the research, 1,971 food, beverages and dishes had been cited.
Quality control of the data collected on food intake was carried out based on partial analyses, such as verifying frequency of the response, mean of items consumed on the fi rst and second days’ food records, with local coordinators being periodically informed of inconsistencies and the need for adjustments in the data collection. Details on the pre-test, training, validation of the data collection instrument and data input have been published.b When checking data consistency, those
adolescents (less than 1%) with incomplete records were excluded. Based on consistency analysis, values were allocated when the quantities reported were consi-dered to be unlikely.b The use of soya oil in all methods
into account. The addition of 10% (standardized) of the volume of sugar to consumed liquids such as fruit juice, coffee, latte, tea and mate was assumed when the adolescent reported preferring sugar and 5% for those who reported using sugar and sweetener.
To estimate calorie, macro and micronutrient intake (calcium, phosphorous, iron, sodium, zinc, vitamins A, C, E and B12), tables of nutritional compositionc and portion
sizes,19 which had been specially drawn up to analyze
the food and dishes in the National Dietary Survey were used. These tables were created based on data available in the Brazilian Table of Food Compositiond and in the
Nutrition Data System for Research database.e
Population means (and their respective standard errors) of energy consumption and macronutrients, percentiles of distributions of intake and the rates of prevalence of inadequate micronutrient intake were estimated based on the data from two non-consecutive days’ food records, corrected for intra-individual variance.31 The
method used to estimate usual intake and the prevalence of inadequate intake of micronutrients was developed by the National Cancer Institute of the United States.31
This method consists of a mixed non-linear model divided into two parts. The fi rst is based on a logistic regression model with random effects to estimate the probability of consumption; the second part considers the transformed data to achieve symmetry of distribu-tion and estimates the amount of consumpdistribu-tion by linear regression with random effects. As all of the nutrients investigated were consumed usually (fewer than 5% of zeros), it was assumed that the probability of estimated consumption in the fi rst part of the model is equal to 1, meaning that only the second part of the model needs
to considered when estimating usual consumption.31
All of the models used look at the fi ve regions of the country (North, Northeast, South, Southeast and Midwest) and the location of the residence (urban/rural) as co-variables. To estimate the percentage of usual intake of calories coming from protein, carbohydrates and fats, an extension of the National Cancer Institute method for bivariate model was used.7
Estimates of standard errors obtained using the National Cancer Institute model are based on assumptions of the observations’ independence and equal distribution and a simple random sample. Such assumptions do not apply to the data obtained in a complex sample such as the Household Budget Survey. Thus, the standard errors were estimated using the balanced repeated replication technique, with Fay’s modifi cation5 (1989) as used by
Barbosa et al.2
Prevalence rates of inadequate intake were estimated according to gender, age group (ten to 13 years old and 14 to 18 years old) and proportion of adolescents with intake below the Estimated Average Requirement Estimated Average Requirement, as proposed by the
US Institute of Medicine.18 TheEstimated Average
Requirement represents the average of daily ingestion of a nutrient that is estimated to meet the needs of 50% of the healthy population.11-18
For iron, the estimate of inadequate intake was calcu-lated using the manually determined probabilistic approach,15 as distribution of necessity of this nutrient
is asymmetrical among women of childbearing age, which is not taken into account in the premises upon which Estimated Average Requirement use is based. Probabilistic sampling was used for both sexes with the aim of facilitating comparison. To begin with, the (10th,
15th, 25th, 50th, 75th and 90th) percentiles were estimated
for usual iron intake. Probability of inadequate intake according to gender and age group was associated to each. These probabilities of inadequate intake are according to specifi ed iron intake recommended by
the US Institute of Medicine by sex and age groups15
(2001). The risk of inadequate intake corresponds to the number of individuals in each interval of iron intake, multiplied by the respective probability of inadequate intake, and the prevalence of inadequate iron intake corresponded to the sum of the percentage of indivi-duals with inadequate intake in each percentile. Using this method, it is not possible to calculate standard error for inadequate iron intake.
For sodium intake, values above the tolerable upper intake level were considered inappropriate.14 That was
used because of the very high levels of sodium intake in Brazil.28
All of the estimates were calculated using Statistical Analysis System software, version 9.3, taking into account expansion factors in the Household Budget Survey 2008-2009 and the complexity of the sample design. All of the analyses were stratifi ed by the adoles-cents’ gender and age group.
The research protocol was approved by the Ethics
Committee of the Instituto de Medicina Social,
Universidade do Estado do Rio de Janeiro (CAAE
0011.0.259.000-11).
RESULTS
Mean energy intake varied between 1,869 kcal in adolescent females aged ten to 13 years old and
c Instituto Brasileiro de Geografi a e Estatística. Pesquisa de Orçamentos Familiares, 2008-2009: tabela de composição nutricional dos alimentos consumidos no Brasil. Rio de Janeiro; 2011.
d Universidade Estadual de Campinas, Núcleo de Estudos e Pesquisas em Alimentação: tabela brasileira de composição de alimentos; versão 2. 2.ed. Campinas: NEPA; 2006 [cited 2011 Jul]. Available from http://www.unicamp.br/nepa/taco/contar/taco_versao2.pdf
Inadequate micronutrient intake in adolescents Veiga GV et al
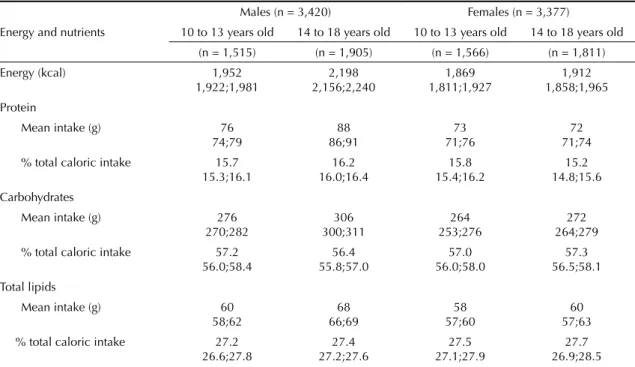
2,198 kcal in males aged 14 to 18 years old. There were no differences verifi ed among the age groups with regards total energy and macronutrients in the females’ diets. However, in adolescent males, the 14 to 18 age group presented higher energy, protein and fat intake than those aged 10 to 13 years old. The percentage contribution of macronutrients to total energy intake was approximately 57% for carbohydrates, 16% protein and 27% lipids (Table 1).
Regardless of gender and age group, almost 100% of adolescents showed inadequate intake of calcium and vitamin E. Around two thirds or more of adolescents showed inadequate intake of phosphorous and vitamin A and a third inadequate vitamin C intake. As for sodium intake, more than 70% of adolescents showed intake above the tolerable upper intake level (Tables 2 and 3).
Among the males, the prevalence of inadequate phos-phorous intake was higher among those aged 10 to 13, and that of vitamins A and C was higher among the 14 to 18 age group, as was excessive sodium intake (Table 2). Adolescent females aged between 14 and 18 showed a higher prevalence of inadequate iron intake compared with those aged 10 to 13, who, in turn, show a higher prevalence of excessive sodium intake (Table 3).
Higher prevalence of excessive sodium intake was observed in adolescent males (both age groups) and of vitamins A and C in adolescent females (only in the 14 to 18 age group). The adolescent girls aged 14 to 18 had a higher prevalence of inadequate phosphorous
and iron intake that adolescent boys of the same age (Tables 2 and 3).
DISCUSSION
Almost all of the Brazilian adolescents in the study showed inadequate intake of calcium and vitamin E and, in lower but still signifi cant proportions (around 2/3 of the adolescents), inadequate phosphorous and vitamin A intake and around 1/3 did not consume sufficient vitamin C. Although there were small differences between the genders, the defi ciencies are relevant to both.
As regards calcium, not even the 10% of the sample who consumed the most calcium (90th percentile) reached
the nutritional recommendation of 1,100 mg/day. Methodological differences in assessing food intake and inadequate nutrient consumption makes it diffi cult to compare results between studies; however, inade-quate intake of micronutrients observed in the National Dietary Survey data confi rms what has been revealed in other studies carried out in Brazil, irrespective of the method of analyzing inadequate intake,32 and in other
emerging6,27 and developed countries.10
In this study, inadequate calcium and phosphorous intake may be related to low consumption of milk and dairy products, which are the principle dietary sources, as dairy products, fruit and vegetables are among the least frequently consumed foods among Brazilian adolescents.b The low levels of milk and dairy products
consumed by adolescents have been associated to
Table 1. Sample size, mean and 95% confi dence interval in calorie and macronutrients intake and contribution of macronutrient to total caloric intake among adolescents, according to sex and age. Brazil, 2008-2009.
Males (n = 3,420) Females (n = 3,377)
Energy and nutrients 10 to 13 years old 14 to 18 years old 10 to 13 years old 14 to 18 years old
(n = 1,515) (n = 1,905) (n = 1,566) (n = 1,811)
Energy (kcal) 1,952 2,198 1,869 1,912
1,922;1,981 2,156;2,240 1,811;1,927 1,858;1,965
Protein
Mean intake (g) 76 88 73 72
74;79 86;91 71;76 71;74
% total caloric intake 15.7 16.2 15.8 15.2
15.3;16.1 16.0;16.4 15.4;16.2 14.8;15.6
Carbohydrates
Mean intake (g) 276 306 264 272
270;282 300;311 253;276 264;279
% total caloric intake 57.2 56.4 57.0 57.3
56.0;58.4 55.8;57.0 56.0;58.0 56.5;58.1
Total lipids
Mean intake (g) 60 68 58 60
58;62 66;69 57;60 57;63
% total caloric intake 27.2 27.4 27.5 27.7
according to age. Brazil, 2008-2009.
Micronutrients
10 to 13 years old 14 to 18 years old
Reference
intakes 10 25 50 75 90
% of inadequacy
Reference
intakes 10 25 50 75 90
% of inadequacy
Calcium (mg) 1,100 243 340 482 666 875 96.5
95.6;97.5
1,100 263 365 514 704 924 95.4
94.5-96.3
Phosphorous (mg) 1,055 548 697 902 1,157 1,436 66.3
63.8;68.7
1,055 623 791 1,017 1,295 1,604 54.1
51.0-57.1
Iron (mg) 5.9 6.2 8.2 10.8 13.9 17.2 8.5b 7.7 7.6 9.8 12.7 16.2 19.9 11.8
Sodium (mg) 2,200 1,889 2,375 3,013 3,765 4,557 81.0a
79.5;82.4
2,300 2,230 2,775 3,491 4,318 5,186 88.4
86.2-90.7
Zinc (mg) 7.0 5.9 7.6 9.9 12.9 16.1 19.2
15.7;22.8
8.5 7.0 8.9 11.6 14.9 18.6 21.6
18.4-24.8
Vitamin A (mg) 445 135 201 311 473 680 71.8
67.8;75.8
630 143 213 327 497 717 85.6
83.7-87.6
Vitamin B12 (mcg) 1.5 1.8 2.6 3.7 5.3 7.3 5.2
3.3;7.2
2.0 2.1 2.9 4.1 5.9 8.1 9.1
6.6-11.5
Vitamin E (mg) 9.0 2.2 2.9 3.8 5.0 6.2 99.3
99.0;99.5
12.0 2.5 3.3 4.4 5.6 6.9 99.9
99.8-100.0
Vitamin C (mg) 39.0 17.8 35.9 74.0 143.4 253.0 27.5
22.1;32.8
63.0 14.9 31.3 65.1 127.5 225.2 48.8
46.7-50.9
EAR: Estimated Average Requirements
a Estimate based on UL (tolerable upper intake level)
Inadequate micronutrient intake in adolescents
V
eiga GV et al
Table 3. Reference Intakes (EAR), intake percentiles (10, 25, 50, 75 and 90), prevalence and 95% confi dence interval of inadequate micronutrient intake among adolescent girls according to
age. Brazil, 2008-2009.
Micronutrients
10 to 13 years old 14 to 18 years old
Reference
intakes 10 25 50 75 90
% of inadequacy
Reference
intakes 10 25 50 75 90
% of inadequacy
Calcium (mg) 1,100 238 331 469 651 857 96.8
96.4;97.3
1,100 237 332 468 647 850 97.0
96.0;97.9
Phosphorous (mg) 1,055 533 679 882 1,128 1,399 68.8
65.1;72.5
1,055 528 674 874 1,118 1,393 69.4
65.2;73.6
Iron (mg) 5.7 5.8 7.7 10.2 13.2 16.5 10.7b 7.9 6.0 7.9 10.5 13.5 16.8 25.0
Sodium (mg) 2,200 1,747 2,203 2,815 3,530 4,290 75.1a
72.0;78.2
2,300 1,718 2,173 2,774 3,493 4,239 69.9
68.3;71.6
Zinc (mg) 7.0 5.6 7.2 9.5 12.3 15.4 22.5
19.8;25.2
7.3 5.7 7.3 9.6 12.5 15.7 24.7
20.7;28.7
Vitamin A (mg) 420 141 211 326 496 713 65.8
62.9;68.8
485 145 217 337 510 729 72.3
66.4;78.3
Vitamin B12 (mcg) 1.5 1.9 2.6 3.8 5.5 7.5 4.7
2.8;6.7
2.0 1.9 2.7 3.8 5.4 7.4 11.7
6.3;17.1
Vitamin E (mg) 9.0 2.0 2.7 3.6 4.6 5.8 99.6
99.4;99.8
12.0 2.1 2.8 3.7 4.8 6.0 100.0
100.0;100.0
Vitamin C (mg) 39.0 16.1 33.2 68.5 133.9 235.9 30.1
26.5;33.6
56.0 18.5 37.5 76.6 148.1 256.0 38.0
32.5;43.5
EAR: Estimated Average Requirements
a Estimate based on UL (tolerable upper intake level)
increased consumption of soft drinks and other swee-tened drinks,6 which, in turn, have been associated with
being overweight in adolescence.22
Adequate calcium and phosphorous intake in adoles-cence is critical in achieving peak bone mass and main-taining skeletal integrity and consequent prevention of osteoporosis and fractures in adult life.4 Another
possible additional role played by calcium in preventing chronic illness such as high blood pressure and obesity,3
indicates the damage which defi ciency of this mineral may do to health.
Vitamins A, C and E were also the nutrients with the highest prevalence of inadequate intake in adolescents aged 14 to 18 in São Paulo, Southeastern Brazil,32
evalu-ated using the Estimevalu-ated Average Requirement method. Prevalence rates similar to those found in this study for vitamin E (almost 100%) and vitamin A (for example: for male and female adolescents prevalence rates of 78% and 71% were estimated in SP, versus 85.6% and 72.3% in this study, respectively). However, the prevalence of
inadequate vitamin C was higher in SP (79% versus
48.8% for males and 53% versus 38% for females).
These nutrients were also those which had the highest prevalence of inadequate intake in the diet of American adolescents,25 although less so than those
observed in Brazil.
In addition to these vitamins’ importance in meeting the demands of satisfactory growth and bodily changes inherent to puberty, their functions as anti-oxidants and, possibly, protectors against cardiovascular disease stand out.11-13,15 The high prevalence of inadequate
consump-tion of these nutrients observed in Brazilian adolescents may signify increased risk of developing these diseases.
Low levels of fruit and vegetable consumption have been observed in the Brazilian population in general21
and may explain inadequate vitamin intake, especially of vitamin C, which has its main sources in these foods. Mean daily intake per capita of fruit and vegetables observed in adolescents were below 100 g, much below the 400 g/day recommended to protect health and diminish the risk of illness.18Adolescents are the
age group with the lowest consumption of these foods,b
in Brazil and in other countries.10
Overall, the inadequate micronutrient intake observed were similar for both genders, with the exception of iron and phosphorous, which were more inadequate in females, especially in the 14 to 18 age group.
The most notable differences in prevalence rates of inadequate micronutrient intake between the age groups
were related to iron and vitamin B12, being twice as high (for iron) and almost three times as high (for vitamin B12) in the 14-18 year olds than in the younger group. The lower iron intake observed among 14 to 18 year olds makes them more vulnerable to anemia due to lack of iron, which is highly prevalent among Brazilian adolescents of both genders.24 The greater inadequacy
of iron observed in females compared to males of the same age, in the second half of adolescence, may be associated with this group’s lower intake of the nutrient, as the values of the percentiles are lower than the values for the males, although needs are similar for both groups (7.9 mg for females and 7.7 mg for males).
We also observed a high percentage of adolescents with sodium intake above the biologically tolerable daily intake and which, probably, does not place the indivi-duals at risk of adverse effects (above 70% in females and above 80% in males). The median sodium consumption for both sexes in both age groups, especially in males (3,013 mg for those aged ten to 13 and 3,491 mg for those aged 14 to 18), is above the recommended daily intake of 2,300 mg.14 High salt content in adolescents’ diet may
be associated with the large amounts of processed food consumed by the Brazilian population.b
Assessing adequate energy intake in adolescents is a complex task, as energy needs estimated for this age group are established based on equations which take into consideration variables such as gender, age, weight and physical activity, as well as additional energy to be stored and for growth.16 Energy needs for sedentary
adolescents aged ten to 18, taking into consideration reference weight and height, would be 1,798 kcal to 2,383 kcal for males and 1,617 kcal to 1,690 kcal for females.16 Thus, the mean values observed in Brazilian
adolescents would be, relatively, within expected levels for male adolescents (1,952 kcal to 2,198 kcal), although a little over the expected levels for females (1,869 kcal to 1,912 kcal). It was decided to compare estimates for sedentary adolescents due to the high prevalence of sedentary Brazilian teenagers.9
The contribution of macronutrients to total energy intake observed in the adolescents studied was found to be within the acceptable limits set by the US Institute of Medicine which recommend that this should vary between 45% and 65% for carbohydrates, 10% to 30% for proteins and 25% to 35% for lipids, for the population of the United States and Canada aged 4 to 18 years old. These guidelines show limits asso-ciated with nutritional adequacy and reduced risk of
chronic diseases. However, the Guia Alimentar para
a População Brasileira (Food Guide for the Brazilian
Population)f sets this distribution as 55% to 75% for
Inadequate micronutrient intake in adolescents Veiga GV et al
carbohydrates, 15% to 30% for lipids and 10% to 15% for proteins. Thus, the means observed in this study are within the Brazilian recommended guidelines for lipids (27%), carbohydrates (57%) and slightly higher for proteins (16%). Despite the acceptable percentage distribution of macronutrients, adolescents are the age group with the highest mean per capita consumption of cookies and soft drinks, which are signifi cant sources of simple sugars. Moreover, adolescents in the 14 to 18 age group had the highest mean fat consumption compared to adults and the elderly,b which may explain
the higher absolute consumption of carbohydrates and lipids and the consequent increase in calories observed in this age group.
Studies carried out on Brazilian adolescents have
shown high lipid intake20 and carbohydrate and
protein consumption within or above recommended guidelines,8 results comparable with those observed
in this study, expect with regards to fat consumption, for which we observed a lower contribution to total calorie consumption.
There are a variety of methods which can be used to estimate individual dietary intake. The method chosen for the National Dietary Survey was to use food records from two non-consecutive days. This method was chosen mainly due to the need to interfere as little as possible in the Household Budget Survey data collection, in which information on expenditure was recorded in a notebook,33 as well as having the
advantage of not being reliant on memory. However, as with other methods of assessing food intake, this is also subject to errors in estimating consumption, as there is
the possibility that the results include some degree of underestimation. A limitation of the study was the fact that not having been adopted criteria to exclude underes-timates and correct for underesunderes-timates, as this procee-ding may lead to overestimating inadequate intake of nutrients. However, appropriate statistical procedures were applied to minimize the effect of intra-individual variability and remove outliers for both under – and overestimates of nutrient intake.1
This was a pioneering study in Brazil as it estimated individual dietary intake in a nationally representative probabilistic sample of adolescents, which allowed this population’s intake of energy and nutrients and the prevalence of inadequate micronutrient intake to be described. Although the means of energy consumption and the distribution of macronutrients were adequate, there were high rates or inadequate intake of micro-nutrients such as calcium, phosphorous, sodium and vitamins A, E and C in both genders and age groups. Inadequate iron intake also proved to be relevant to adolescent females aged between 14 and 18 years old.
Inadequate micronutrient intake is particularly worrying in adolescence, when needs are increased due to the growth and bodily changes inherent to puberty. Developing interventions to reduce these defi ciencies, as well as to diminish excessive consumption of food items associated with obesity and other chronic illnesses is a challenge for public policies promoting health in adolescence and, consequently, in adulthood.
1. American Dietetic Association. Practice paper of the American Dietetic Association: using the Dietary Reference Intakes. J Am Diet Assoc. 2011; 111(5):762-70. DOI:10.1016/j.jada.2011.03.022
2. Barbosa FS, Junger WL, Sichieri R, Assessing usual dietary intake in complex sample design surveys. Rev Saúde Pública –Rev Saude Publica. 2013;47(1 Supl): xxS-xxS
3. Davies KM, Heaney RP, Recker RR, Lappe JM, Barger-Lux MJ, Raffery K, et al. Calcium intake and body weight. J Clin Endocrinol Metab. 2000; 85(12): 4635-8. DOI:10.1210/jc.85.12.4635
4. Eisenstein E, Coelho KSC, Coelho SC, Coelho MASC. Nutrição na adolescência. J Pediatr (Rio J). 2000; 76 (Supl 3): S263-74.
5. Fay RE. Theory and application of replicate weighting for variance calculations. In: Proceedings of the Survey Research Methods Section of the American Statistical Association. Alexandria (VA); 1989. p. 212-7.
6. Fernandéz-Ortega M. Consumo de fuentes de calcio en adolescentes mujeres en Panamá. Arch Latinoam Nutr. 2008; 58(3): 286-91.
7. Freedman LS, Guenther PM, Dodd KW, Krebs-Smith SM, Midthune D. The population distribution of ratios of usual intakes of dietary components that are consumed every day can be estimated from repeated 24-hour recalls. J Nutr. 2010; 140(1): 111-6. DOI:10.3945/jn.109.110254
8. Garcia GCB, Gambardella AMD, Frutuoso MFP. Estado nutricional e consumo alimentar de adolescentes de um centro de juventude da cidade de São Paulo. Rev Nutr. 2003;16(1): 41-50. DOI:10.1590/S1415-52732003000100005
9. Hallal PC, Knuth AG, Cruz DKA, Mendes MI, Malta DC. Prática de atividade física em adolescentes brasileiros. Cienc Saude Coletiva. 2010;15 (Supl 2): 3035-42. DOI:10.1590/S1413-81232010000800008
10. Hoppu U, Lehtisalo J, Tapanainen H, Pietinen P. Dietary habits and nutrient intake of Finnish adolescents. Public Health Nutr. 2010; 13(6A): 965-72. DOI:10.1017/S1368980010001175
11. Institute of Medicine, Food and Nutrition Board. Dietary reference intakes for calcium, phosphorus, magnesium, vitamin D, and fl uoride. Washington (DC): National Academy Press; 1997.
12. Institute of Medicine, Food and Nutrition Board. Dietary reference intakes for thiamin, riboflavin, vitamin B6, folate, vitamin B12, pantothenic acid, biotin, and choline. Washington (DC): National Academy Press; 1998.
13. Institute of Medicine, Food and Nutrition Board. Dietary reference intakes for vitamin C, vitamin E, selenium, and carotenoids. Washington (DC): National Academy Press; 2000.
14. Institute of Medicine, Food and Nutrition Board. Dietary reference intakes for water, potassium, sodium, chloride, and sulfate. Washington (DC): National Academy Press; 2000.
15. Institute of Medicine, Food and Nutrition Board. Dietary reference intakes for vitamin A, vitamin K, arsenic, boron, chromium, copper, iodine, iron, manganese, molybdenum, nickel, silicon, vanadium, and zinc. Washington (DC): National Academy Press; 2001.
16. Institute of Medicine, Food and Nutrition Board. Dietary reference intakes for energy, carbohydrate, fi ber, fat, fatty acids, cholesterol, protein and amino acids. Washington (DC): National Academy Press; 2002.
17. Institute of Medicine, Food and Nutrition Board. Dietary reference intakes for calcium and vitamin D. Washington (DC): National Academy Press; 2011.
18. Institute of Medicine, Food and Nutrition Board. Standing Committee on the Scientifi c Evaluation of Dietary Reference Intakes. Dietary reference intakes: applications in dietary assessment. Washington, DC: National Academy Press, 2000. 287p. [citado 2011 jul]. Disponível em: http://books.nap.edu/openbook. php?record_od=9956
19. Instituto Brasileiro de Geografi a e Estatística.Pesquisa de Orçamentos Familiares, 2008-2009: tabela de medidas referidas para os alimentos consumidos no Brasil. Rio de Janeiro, 2011.
20. Leal GVS, Philippi ST, Matsudo SMM, Toassa EC. Food intake and meal patterns of adolescents, São Paulo, Brazil.Rev Bras Epidemiol. 2010;13(3): 457-67. DOI:10.1590/S1415-790X2010000300009
21. Levy-Costa RB, Sichieri R, Pontes NS, Monteiro CA. Disponibilidade domiciliar de alimentos no Brasil: distribuição e evolução (1974-2003). Rev Saude Publica. 2005; 39(4): 530-40. DOI:10.1590/S0034-89102005000400003
22. Malik VS, Schulze MB, Hu FB. Intake of sugar sweetened beverages and weight gain: a systematic review. Am J Clin Nutr. 2006; 84(2): 274-88.
23. Malik VS, Fung TT, Van Dam RM, Rimm EB, Rosner B, Hu FB. Dietary patterns during adolescence and risk of type 2 diabetes in middle-aged women. Diabetes Care. 2012; 35(1): 12-8. DOI:10.2337/dc11-0386
24. Mariath AB, Henn R, Matos CH, Lacerda LLV, Grillo LP. Prevalência de anemia e níveis séricos de hemoglobina em adolescentes segundo estágio de maturidade sexual. Rev Bras Epidemiol. 2006; 9:(4): 454-61. DOI:10.1590/S1415-790X2006000400006
25. Moshfegh A, Goldman J, Cleveland L What we eat in America, NHANES 2001-2002: usual nutrient intakes from food compared to dietary reference intakes. Washington (DC): USDA/ARS; 2005.
26. Prentice AM, Jebb SA. Fast foods, energy density and obesity: a possible mechanistic link. Obes Rev. 2003; 4(4): 187-94. DOI:10.1046/j.1467-789X.2003.00117.x
Inadequate micronutrient intake in adolescents Veiga GV et al
28. Sarno F, Claro RM, Levy RB, Bandoni DH, Ferreira SRG, Monteiro CA. Estimated sodium intake by the Brazilian population, 2002- 2003. Rev Saude Publica. 2009; 43(2): 219-5. DOI:10.1590/S0034-89102009005000002
29. Spear BA. Adolescent growth and development. J Am Diet Assoc. 2002; 102(3 Suppl): S23-9.
30. Tavares LF, Yokoo EM, Rosa MLG, Fonseca SC. Síndrome metabólica em crianças e adolescentes brasileiros: revisão sistemática. Cad Saude Coletiva. 2010; 18(4): 469-76.
31. Tooze JA, Midthune D, Dodd KW, Freedman LS, Krebs-Smith SM, Subar AF, et al. A new statistical method for estimating the usual intake of episodically
consumed foods with application to their distribution. J Am Diet Assoc. 2006; 106(10): 1575-87.
DOI:10.1016/j.jada.2006.07.003
32. Verly Junior E, Cesar CLG, Fisberg RM, Marchioni DML. Socio-economic variables influence the prevalence of inadequate nutrient intake in Brazilian adolescents: results from a population-based survey. Public Health Nutr: 2011; 14(9): 1533-8. DOI:10.1017/S1368980011000760
33. Yokoo EM, Pereira RA, Veiga GV, Nascimento S, Costa RS, Marins VMR, et al. Proposta
metodológica para o módulo de consumo alimentar pessoal na pesquisa brasileira de orçamentos familiares. Rev Nutr. 2008; 21(6): 767-76. DOI:10.1590/S1415-52732008000600015
This manuscript was submitted for publication and underwent a peer review process as any other manuscripts submitted to this publication, and anonymity was guaranteed for authors and reviewers. Editors and reviewers declare no confl icts of interest that may affect the peer-review process.