Acute extracellular fluid volume
changes increase ileocolonic resistance
to saline flow in anesthetized dogs
Departamento de Fisiologia e Farmacologia,
Universidade Federal do Ceará, 60430-270 Fortaleza, CE, Brasil A.T. Santiago Jr.,
F. de-A.A. Gondim, D.I.M. Cavalcante, J.R.V. da-Graça, G.R. de-Oliveira, A.A. dos-Santos and F.H. Rola
Abstract
We determined the effect of acute extracellular fluid volume changes on saline flow through 4 gut segments (ileocolonic, ileal, ileocolonic sphincter and proximal colon), perfused at constant pressure in anes-thetized dogs. Two different experimental protocols were used: hyper-volemia (iv saline infusion, 0.9% NaCl, 20 ml/min, volume up to 5% body weight) and controlled hemorrhage (up to a 50% drop in mean arterial pressure). Mean ileocolonic flow (N = 6) was gradually and significantly decreased during the expansion (17.1%, P<0.05) and expanded (44.9%, P<0.05) periods while mean ileal flow (N = 7) was significantly decreased only during the expanded period (38%, P<0.05). Mean colonic flow (N = 7) was decreased during expansion (12%, P<0.05) but returned to control levels during the expanded period. Mean ileocolonic sphincter flow (N = 6) was not significantly modi-fied. Mean ileocolonic flow (N = 10) was also decreased after hemor-rhage (retracted period) by 17% (P<0.05), but saline flow was not modified in the other separate circuits (N = 6, 5 and 4 for ileal, ileocolonic sphincter and colonic groups, respectively). The expan-sion effect was blocked by atropine (0.5 mg/kg, iv) both on the ileocolonic (N = 6) and ileal (N = 5) circuits. Acute extracellular fluid volume retraction and expansion increased the lower gastrointestinal resistances to saline flow. These effects, which could physiologically decrease the liquid volume being supplied to the colon, are possible mechanisms activated to acutely balance liquid volume deficit and excess.
Correspondence F.H. Rola
Departamento de Fisiologia e Farmacologia, UFC
Rua Coronel Nunes de Melo, 1127 Caixa Postal 3157
60430-270 Fortaleza, CE Brasil
Fax: 55 (085) 243-9333
Presented at the IX Annual Meeting of the Federação de Sociedades de Biologia Experimental, Caxambu, MG, Brasil, August 24-27, 1994.
This work is part of a Masters thesis presented by A.T. Santiago Jr. to the Departamento de Farmacologia, Universidade Federal do Ceará, Fortaleza, CE.
Research supported by CNPq, CAPES and UFC.
Received March 21, 1996 Accepted June 6, 1997
Key words
•Ileocolonic motility •Extracellular fluid volume •Expansion
•Hemorrhage •Atropine
Introduction
The luminal fluid in the gastrointestinal (GI) tract is in dynamic equilibrium with the extracellular fluid (ECF) volume (1). Acute ECF volume retraction by hemorrhage, de-hydration or reduction in salt intake increases intestinal salt and water absorption(2). In
contrast, acute ECF volume expansion re-duces or even abolishes intestinal absorption while increasing secretion (3).
expansion by intravenous infusion of saline also decreases both gastric and jejunal com-pliance while hemorrhage increases it (6,7). These observations suggest that the GI tract, at least in its upper portions, behaves like a regulatory liquid reservoir capable of adjust-ing its volumetric, absorptive and secretory capacities to cope with organic needs, i.e., accommodating and absorbing more liquid volume after hemorrhage and, contrarily, becoming less receptive to liquid volume distension and less absorptive after acute hypervolemia. This evidence is supported by the functional interaction between motor changes and absorption; increased tone re-duces absorption while decreased tone stimu-lates salt and water absorption (8).
However, despite the contributions of the ileal and large intestine to liquid volume regulation (9), the effect of ECF volume changes on the lower GI tract motor behav-ior has not been studied. Under basal condi-tions, i.e., when the large bowel absorbs about 20% of the total ingested fluids and gut secretion (10), patients with ileostomies are more susceptible to dehydration when placed on a low sodium diet or during an acute diarrheal illness(11). Therefore, we decided to study the effect of acute ECF volume expansion and retraction on the re-sistance to liquid flow offered by the ileoco-lonic segment as a whole, as well as by its segments in anesthetized dogs.
Material and Methods
Animals and surgical procedures
Mongrel dogs of either sex (12.7 ± 3.2 kg, N = 62) fasted for 16 h with free acess to water were utilized. The animals were anes-thetized with sodium pentobarbital (30 mg/ kg, iv) and the femoral vessels were cannu-lated. The right vein was used for anesthetic infusion when necessary or for isotonic sa-line (0.9% NaCl) infusion to expand the ECF volume. The right artery was utilized for
bleeding and to provide blood samples for arterial hematocrit determinations. The left artery was cannulated with a heparinized (35 IU/ml) glass cannula and connected to an Hg manometer. Mean arterial pressure (MAP) and breathing were recorded with a Palmer kymograph. Central venous pressure (CVP) in cmH2O was measured visually using a
catheter introduced via the external jugular vein, positioned in the right atrium and con-nected to an H2O manometer zeroed with the
normal ictus cordis.
Perfusion circuits
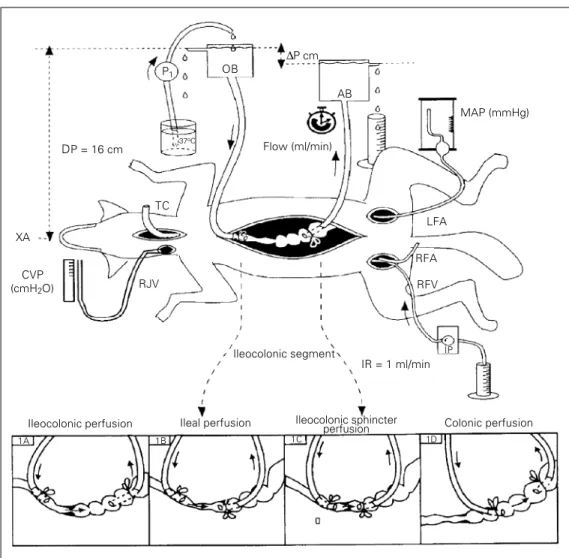
After laparotomy, one of the following 4 different types of perfusion circuits was cre-ated (Figure 1).
A - Ileocolonic segment perfusion. Figure 1A (N = 16, 13 ± 3 kg).
An oral probe (0.8 cm ID, 1.0 cm OD) introduced through an ileal fistula was posi-tioned and fixed with an obstructive ligature in the distal ileum. An aboral probe (1.0 cm ID, 1.3 cm OD) introduced through a colonic fistula was positioned and fixed with an-other obstructive ligature in the proximal colon. The tips of both cannulas were posi-tioned 4 cm from the ileocolonic sphincter. Care was taken to preserve regional circula-tion and innervacircula-tion in all perfusion groups.
B - Ileal perfusion. Figure 1B (N = 13, 13.4 ± 2.2 kg).
The oral probe (0.8 cm ID, 1.0 cm OD) was introduced through an ileal fistula (15 cm from the ileocolonic sphincter), and the tip was positioned approximately 10 cm from the ileocolonic sphincter. The aboral probe (1.0 cm ID, 1.3 cm OD) introduced through a colonic fistula (2 cm from the ileocolonic sphincter) was positioned in the terminal ileum, near the ileocolonic sphincter.
C - Ileocolonic sphincter perfusion. Figure 1C (N = 11, 12.8 ± 2.9 kg).
was positioned and fixed near the ileoco-lonic sphincter. The aboral probe (1.0 cm ID, 1.3 cm OD) introduced through a colonic fistula (5 cm from the ileocolonic sphincter) was positioned in the terminal ileum, near the ileocolonic sphincter.
D - Colonic perfusion. Figure 1D (N = 11, 14 ± 3.6 kg).
The oral probe (0.8 cm ID, 1.0 cm OD) was introduced through a colonic fistula near the ileocolonic sphincter and the tip was positioned and fixed 2 cm from the ileoco-lonic sphincter. The aboral probe (1.0 cm ID, 1.3 cm OD) introduced through a colonic fistula (10 cm from the ileocolonic sphinc-ter) was positioned in the proximal colon, 8 cm from the ileocolonic sphincter.
The free end of each probe (oral and
aboral) was connected to the barostat bottom which was then filled with isotonic saline solution (0.9% NaCl, w/v) and maintained at a constant liquid level throughout the experi-ment (Figure 1). The oral barostat liquid level, placed 16 cm above the xiphoid ap-pendix, was always kept above the aboral barostat in order to ensure an aboral ileoco-lonic flow due to the resulting pressure gradi-ent. The result was a communicating vessel system in which the perfused segment repre-sented the only resistance offered to the liquid flow which could vary. The liquid flowing out of the aboral barostat was manu-ally collected at 2-min intervals and meas-ured and the rate is reported as the ileolonic, ileal, ileocolonic sphincter and co-lonic flows in ml/min. To obtain an
ileoco-P1 OB
∆P cm
AB
MAP (mmHg)
LFA
RFA
RFV
IP
IR = 1 ml/min
Colonic perfusion Ileocolonic sphincter
perfusion Ileal perfusion
Ileocolonic segment TC
DP = 16 cm
RJV XA
37oC
1A 1B 1C 1D
Figure 1 - Schematic representa-tion of the barostat system uti-lized to perfuse the ileocolonic (1A), ileal (1B), ileocolonic sphincter (1C) and colonic (1D) portions of the gastrointestinal tract under constant pressure in anesthetized dogs. The oral barostat (OB) liquid level was positioned 16 cm (DP, distension pressure) above the xiphoid ap-pendix (XA). A pressure gradient (∆P) to promote an aboral saline flow was obtained by position-ing the aboral barostat (AB) be-low the OB. The volume of sa-line at 37oC flowing out of the
AB was manually collected at 2-min intervals and is reported as the mean flow value obtained during control and experimental protocols. P1 and IP, Peristaltic
pumps used to replenish OB liq-uid level and for saline infusion and blood reinfusion, respec-tively; RJV, right jugular vein for central venous pressure meas-urements (CVP, cmH2O); RFA,
right femoral artery for arterial pressure measurements (MAP, mmHg); LFA, left femoral artery for bleeding; RFV, right femoral vein for anesthetic or saline infu-sion; IR, infusion rate; TC, tra-cheal cannula.
CVP (cmH2O)
Ileocolonic perfusion
lonic flow of about 50 ml/min and 70 ml/min in the other separate segments (ileal, ileoco-lonic sphincter and coileoco-lonic segments) a varia-tion in the pressure gradient was performed: 4.7 ± 0.3, 3.4 ± 1.3, 2.5 ± 0.6 and 1.6 ± 0.5 cmH2O, respectively. The isotonic saline
uti-lized in the perfusing system was heated to 37oC before reaching the gut by circulating it
in a glass coil immersed in a water bath at 38oC.
Experimental design
After surgery, the animals were allowed to rest for a period of 20-30 min to stabilize hemodynamic and respiratory parameters. After this interval, the mean rate of saline flowing from the aboral barostat over a pe-riod of 20 min represented the normovole-mic control flow. The animals were submit-ted to acute ECF volume expansion by iv
isotonic saline infusion (0.9% NaCl solu-tion, 20 ml/min) up to a volume equivalent to 5% of the body weight or acute ECF volume retraction by controlled hemorrhage until a 50% drop in MAP levels, followed by reinfusion of the removed blood at a rate of 20 ml/min. The perfusion flow was meas-ured during saline infusion (expansion pe-riod), 30 min after it was completed (ex-panded period), during hemorrhage and 20 min thereafter (ECF volume retraction and retracted, respectively), as well as during blood volume reinfusion (ECF volume res-toration).
At the end of each experiment, the ani-mals were sacrificed under deep anesthesia by iv KCl injection.
Drugs
In another set of experiments, atropine sulfate (Sigma Chemical Co., St. Louis, MO) wasinjected iv (0.5 mg/kg) after normovole-mic control into ileal (N = 5) and ileocolonic (N = 6) perfusion circuits. Saline flow meas-urements were then recorded for 30 min
(drug control) and ECF volume expansion was performed according to the previous protocol.
Statistical analysis
The results are reported as mean ± SEM. One-way repeated measures ANOVA and Dunnett’s test were used to compare the differences in saline flow between each ex-perimental period and the Student t-test for paired means was used to compare percent differences in hematocrit. Statistical differ-ences were considered to be significant at P<0.05.
Results
Effect of acute ECF volume expansion on ileocolonic, ileal, colonic and ileocolonic sphincter segment perfusion flow, MAP, CVP and hematocrit
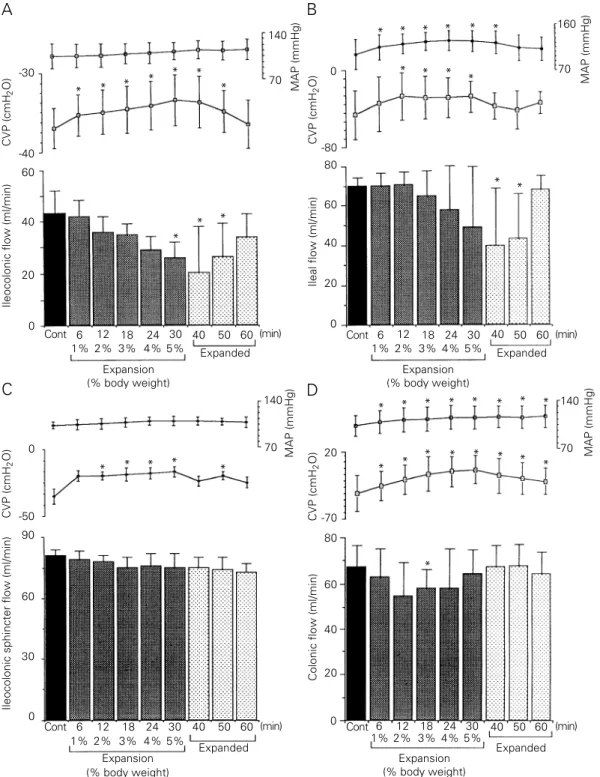
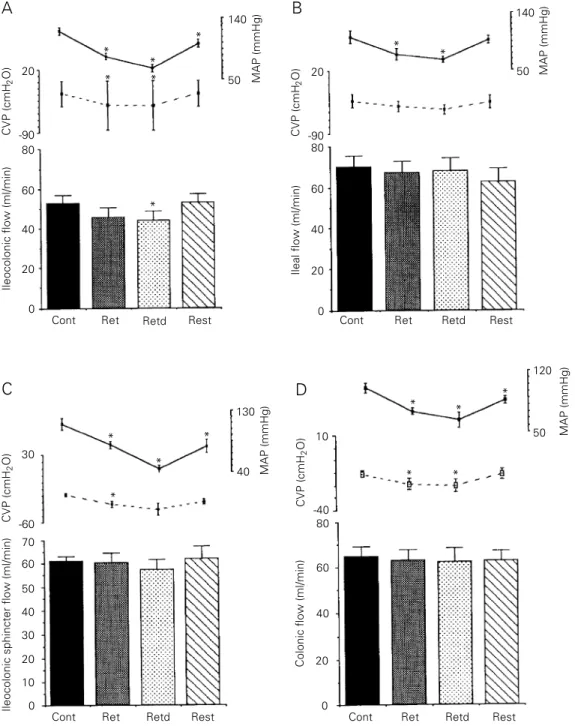
Figure 2 shows the effect of acute expan-sion on the ileocolonic (2A), ileal (2B), ileo-colonic sphincter (2C) and ileo-colonic (2D) seg-ment flow, MAP and CVP. As can be seen in Figure 2A, the mean ileocolonic flow (N = 6) was gradually decreased during the expan-sion period until the difference was statisti-cally significant when a volume up to 5% body weight was infused (P<0.05), persist-ing durpersist-ing the first 20 min of the expanded period (P<0.05). The mean percent flow re-ductions during the expansion and expanded periods were 23 and 45%, respectively (from 46.7 ± 2.8 to 38.7 ± 4.4 and 25.7 ± 6.3 ml/ min, respectively, P<0.05). MAP was not significantly modified while CVP levels in-creased at the beginning of expansion (1% body weight), remaining stable at least dur-ing the first 20 min of the expanded period (P<0.05).
Figure 2 - Effect of acute extracellular fluid (ECF) volume expansion on the ileocolonic (A), ileal (B), ileocolonic sphincter (C) and colonic (D) flows of saline (in ml/min), central venous pressure (CVP) and mean arterial pressure (MAP) of anesthetized dogs. After a normovolemic control period (20 min), the animals were expanded by iv isotonic saline infusion (20 ml/min) up to 5% body weight. The saline flow was monitored during expansion and 30 min thereafter. Bars represent the mean values of saline flow during each period. The expansion period was increased stepwise at 1% intervals from 1 to 5% body weight and is reported for each step. The expanded period was divided into three 10-min intervals. Cont, Normovolemic control period. Upper dots indicate MAP (mmHg) and lower dots CVP (cmH2O). Vertical
lines indicate standard error of the mean. *P<0.05 compared to control period (Dunnetts test). -30
CVP (cmH
2
O)
-40
140
MAP (mmHg)
70
160
MAP (mmHg)
70
* * * *
* *
*
60
Ileocolonic flow (ml/min)
40
20
0
0
CVP (cmH
2
O)
-50
90
Ileocolonic sphincter flow (ml/min)
60
30
0
-80 0
Ileal flow (ml/min)
80
60
20
80
60
Colonic flow (ml/min)
40
20 40
20
0
140
MAP (mmHg)
70
-70
CVP (cmH
2
O)
0
140
MAP (mmHg)
70
* * * * *
Cont 6 1%
12 2%
18 3%
24 4%
30 5%
40 50 60
Expansion (% body weight)
Expanded
Expansion (% body weight)
Expanded
Expansion (% body weight)
Expanded Expansion
(% body weight)
Expanded
Cont 6 1%
12 2%
18 3%
24 4%
30 5%
40 50 60
Cont 6 1%
12 2%
18 3%
24 4%
30 5%
40 50 60 Cont 6
1% 12 2%
18 3%
24 4%
30 5%
40 50 60
* * * * * *
* * *
*
* *
* * * * * * * *
* *
* * * * *
*
* (min)
(min) (min)
(min)
A B
D C
CVP (cmH
2
O)
*
period (P<0.05), and remaining stable for at least 20 min. The mean percent flow reduc-tions in the expansion and expanded periods were 19.3 and 38%, respectively (from 70 ± 4.4 to 56.5 ± 8.5 and 43.4 ± 11.7 ml/min, respectively, P<0.05). CVP levels increased significantly during expansion when a vol-ume up to 2% body weight was infused, remaining increased until the end of expan-sion (P<0.05). MAP levels increased signif-icantly throughout the expansion period and during the first 10 min of the expanded pe-riod (P<0.05).
The mean ileocolonic sphincter flow (N = 6) was not significantly modified either during the expansion or during the expanded period (from 81 ± 2.7 to 76.4 ± 6.4 and 73.8 ± 5.2 ml/min, Figure 2C). MAP was also not significantly modified. Even when we ana-lyzed the changes in flow separately on the basis of the percent body weight of volume infused (as in the ileocolonic and ileal flows), no significant flow reduction was observed. However, CVP levels were significantly in-creased throughout the expansion and ex-panded periods (P<0.05).
Figure 2D shows that the mean colonic flow (N = 7) decreased during the expansion and expanded periods, but attained statisti-cal significance only during expansion and not during the expanded period. The mean percent flow decrease during the expansion
period was 12% (from 67.7 ± 3.4 to 59.8 ± 3.5 and 66.3 ± 3.9 ml/min, P<0.05). MAP and CVP were significantly increased throughout the expansion and expanded pe-riods (P<0.05).
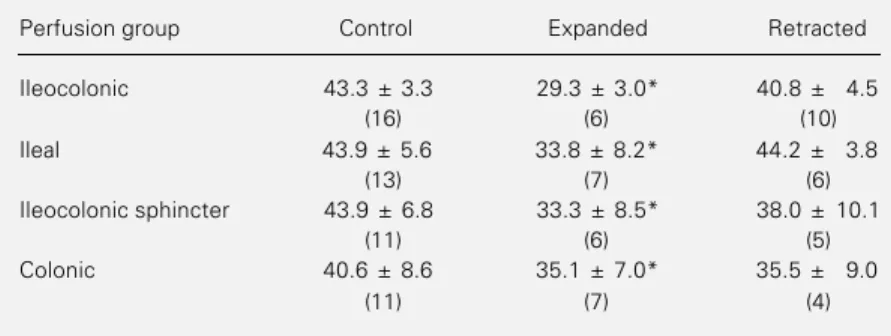
Table 1 shows that the arterial hematocrit values were significantly decreased during the expanded period when compared to con-trol values (P<0.001).
Effect of atropine infusion on acute ECF volume expansion, ileocolonic and ileal flows, MAP and CVP
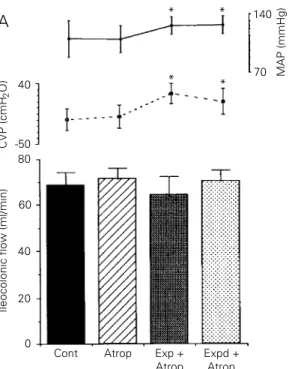
Figure 3 shows that atropine injection blocked the effect of ECF volume expansion on the ileocolonic (3A) and ileal saline flows (3B). Atropine per se did not modify saline flow during the atropine control period (from 68.9 ± 5.2 to 71.4 ± 4.9 and from 64.2 ± 3.3 to 64.6 ± 2.7 ml/min) and no additional saline flow decrease was observed during the expansion or expanded periods (to 64.6 ± 7.5 and 70.5 ± 4.8 ml/min and to 64.3 ± 3.2 and 61.8 ± 2.9 ml/min, for ileocolonic and ileal perfusions, respectively). MAP and CVP levels were significantly increased during the expansion and expanded periods (P<0.05) and MAP levels were also increased during the atropine control period in the ileal perfu-sion group (P<0.05).
After expansion, in the atropinized ani-mals, the arterial hematocrit decreased from 45.6 ± 6.0 and 35.7 ± 6.6 to 29.8 ± 3.6 and 25.5 ± 2.6% in the ileocolonic sphincter and ileal perfusion flows, respectively (P<0.001).
Effect of acute ECF volume retraction on ileocolonic, ileal, colonic and ileocolonic sphincter segment flows, MAP and CVP
Figure 4 shows the effect of acute ECF volume retraction on the ileocolonic (4A), ileal (4B), ileocolonic sphincter (4C) and colonic (4D) segment flow, MAP and CVP. Ileocolonic flow was significantly de-creased by 17% after ECF volume retraction
Table 1 - Effect of ECF volume expansion and retraction on arterial hematocrit.
Expansion was obtained by isotonic saline infusion of 1% to 5% stepwise at 20 ml/ min. Retraction was obtained by bleeding until there was a 50% reduction in arterial pressure. Data are reported as means ± SEM for 51 dogs. Number of animals in each group reported in parenthesis. *P<0.01 compared to control values (Student t-test).
Perfusion group Control Expanded Retracted
Ileocolonic 43.3 ± 3.3 29.3 ± 3.0* 40.8 ± 4.5
(16) (6) (10)
Ileal 43.9 ± 5.6 33.8 ± 8.2* 44.2 ± 3.8
(13) (7) (6)
Ileocolonic sphincter 43.9 ± 6.8 33.3 ± 8.5* 38.0 ± 10.1
(11) (6) (5)
Colonic 40.6 ± 8.6 35.1 ± 7.0* 35.5 ± 9.0
during the retracted period (from 52.8 ± 3.9 to 45.5 ± 5 ml/min, P<0.05), but returned to control levels during removed blood reinfu-sion (Figure 4A). Figure 4B, 4C and 4D show that saline flow was not modified dur-ing or after retraction (retracted period) or after blood volume reinfusion in the other perfusion groups. MAP levels decreased during and after retraction and during re-moved blood volume reinfusion (P<0.05) in the ileocolonic, ileocolonic sphincter and colonic perfusion groups. In ileal perfusion, however, MAP returned to control levels after reinfusion of removed blood. CVP lev-els were decreased during and after retrac-tion in the ileocolonic and colonic groups (P<0.05) and only during retraction in the ileocolonic sphincter group (P<0.05) but were not modified in the ileal group.
Table 1 shows that acute ECF volume retraction did not modify the arterial hemat-ocrit values.
Discussion
We have previously demonstrated that acute volume expansion increases
gas-troduodenal resistance to saline flow in rats and dogs, while hypovolemia due to hemor-rhage decreases it (4,5). Since ECF volume retraction increases intestinal salt and water absorption(2) while expansion reduces or even abolishes intestinal absorption and in-creases secretion (3), we proposed a role for ECF volume in the modulation of liquid flow through the upper GI tract, i.e., coupled modu-lation of the GI tract contractile activity, salt and water transport and ultimately luminal liquid transit to cope with organic needs.
The present study, using the same exper-imental protocol (ileocolonic segment and separate ileal, ileocolonic sphincter and co-lonic portions were perfused under constant pressure and changes in flow were assumed to represent modifications in motor activity, tone and/or motility), extends this idea to the lower gut, showing that acute volume imbal-ances also modify the motor behavior of ileocolonic segments. This approach has been frequently utilized to study resistances through discrete portions of the gut (4,5,12). In constrast to the opposite flow changes (reduction and increase) which we observed after opposite volume imbalances
40
CVP (cmH
2
O)
-50
140
MAP (mmHg)
70
80
Ileocolonic flow (ml/min)
60
40
0 Cont A
20
Atrop Exp + Atrop
Expd + Atrop
Cont Atrop Exp + Atrop
Expd + Atrop B
30
-60 80
Ileal flow (ml/min)
40
20
0 60
140
MAP (mmHg)
70
* *
* *
* * *
* *
Figure 3 - Effect of atropine on acute extracellular fluid (ECF) volume expansion, ileo-colonic (A) and ileal (B) saline flow (ml/min), central venous pressure (CVP) and mean ar-terial pressure (MAP) of anes-thetized dogs. After normo-volemic control period (Cont, 20 min), the animals received an iv injection of atropine (0.5 mg/kg). The perfusion saline flow was measured for 30 min (Atrop) after the animals were expanded by iv isotonic saline infusion (20 ml/min) up to 5% body weight. The per-fusion flow was monitored during expansion (Exp) and for 30 min thereafter (Expd). Bars represent the mean perfusion flow values. Continuous lines represent MAP (mmHg) and broken lines represent CVP (cmH2O). Vertical lines
indi-cate standard error of the mean. *P<0.05 compared to control period (Dunnetts test).
CVP (cmH
2
(expansion and retraction) in the gas-troduodenal segment (4), both acute ECF volume expansion and retraction were as-sociated with decreased ileocolonic saline flow.
Similar to the gastroduodenal segment, ECF volume expansion gradually and per-sistently decreased the saline flow through the ileocolonic segment during the
expan-sion and expanded periods. However, when searching for the main sites of resis-tance, we observed some peculiarities. In the separate ileal perfusion, we observed a late saline flow decrease, which was sig-nificant only during the expanded period. In contrast, saline flow in the separate ileo-colonic sphincter was quite stable both during the expansion and expanded
peri-20
CVP (cmH
2
O)
-90 80
Ileocolonic flow (ml/min)
60
40
0
30
CVP (cmH
2
O)
-60
70
Ileocolonic sphincter flow (ml/min)
60
20
0 A
C
140
MAP (mmHg)
50 140
MAP (mmHg)
50
120
MAP (mmHg)
50 20
50
40
30
10
130
MAP (mmHg)
40
20
CVP (cmH
2
O)
-90 80
Ileal flow (ml/min)
60
40
0
10
CVP (cmH
2
O)
-40 80
Colonic flow (ml/min)
60
20
0 D
20
40 B
Cont Ret Retd Rest Cont Ret Retd Rest
Cont Ret Retd Rest Cont Ret Retd Rest
* *
*
* *
*
*
* *
*
* *
* * *
* *
Figure 4 - Effect of acute extra-cellular fluid (ECF) volume retrac-tion on the ileocolonic (A), ileal (B), ileocolonic sphincter (C) and colonic (D) flows of saline, cen-tral venous pressure (CVP) and mean arterial pressure (MAP) of anesthetized dogs. After a nor-movolemic control period (20 min), the ECF volume was re-tracted by bleeding the animals up to a 50% drop in MAP. The animals were then brought back to the euvolemic condition by reinfusing the blood volume pre-viously removed at a rate of 20 ml/min. Besides the normovole-mic control period, ileocolonic, ileal, ileocolonic sphincter and colonic saline flows (ml/min) were measured during bleeding and for a 20-min period thereaf-ter (ECF volume retraction and retracted, respectively) as well as during autologous blood rein-fusion (restoration). Bars repre-sent average of flow values dur-ing the normovolemic control (Cont), retraction (Ret), ECF vol-ume retracted (Retd) and resto-ration (Rest) periods. Continuous and interrupted lines represent MAP (mmHg) and CVP (cmH2O),
ods, while colonic flow reduction was slight and more pronounced only during the expansion period. Thus, analyzing Fig-ure 2, the flow decrease observed in FigFig-ure 2A appears to be the final result of the sum contribution of Figure 2B and 2D. These findings point to the ileum as the major contributor to the marked flow reduction observed during the expanded period while colonic segment contribution appears to be especially important for the earlier flow decrease during the expansion period, ob-served throughout ileocolonic segment per-fusion.
In contrast to the increased gastroduo-denal flow after ECF retraction that we have previously observed (5), ECF volume retraction, like expansion, was followed by a smaller but still significant drop in ileo-colonic flow. However, when we at-tempted to identify the main sites of resis-tance we were unable to find them since no saline flow decrease either during or after ECF volume retraction was observed in the other separate perfusion circuits (ileal, ileocolonic sphincter and colonic circuits). These findings suggest that the integrated sum of the ileal, ileocolonic sphincter and colonic resistances appears to be necessary for the complete expression of the ECF volume retraction effect on the ileocolonic segment.
In addition to reducing saline flow, ECF volume expansion induced hemodilu-tion and increased CVP and MAP (except in ileocolonic perfusion). ECF volume re-traction was also followed by major circu-latory changes, with MAP and CVP being significantly reduced. Hematocrit values were decreased after ECF volume expan-sion but remained unchanged immediately after hemorrhage. These findings suggest that modifications in CVP levels are closely related to saline flow changes, but MAP was not modified in the ileocolonic perfusion group, where a significant saline flow reduction was observed. In addition,
an opposite effect was observed, i.e., ileo-colonic flow was reduced while CVP and MAP were increased simultaneously.
ECF volume expansion with isotonic, isotonic-isooncotic or isotonic-isooncotic-isohemic infusion produced similar reduc-tions in gastroduodenal flow (4). These results indicate that the effect of hypervo-lemia on gut motility does not appear to be related to factors other than acute volemic expansion.
The cholinergic role in the decrease in saline ileocolonic and ileal flows due to acute ECF volume expansion was further investigated. For this purpose, the effect of atropine (which is a competitive muscar-inic antagonist in smooth muscle) was studied. Atropine per se did not modify ileal or ileocolonic flows. In addition, no saline flow change was observed during or after ECF volume expansion in animals pretreated with atropine. Thus, the effect of acute ECF volume expansion was blocked by atropine. Since atropine de-creases intestinal contractile activity (13), the saline flow decrease due to acute ECF volume expansion in the lower GI tract may involve an intestinal contractile activ-ity increase by cholinergic activation, which was antagonized by atropine.
absorption/increased secretion during ex-pansion (3) and apparent large bowel inca-pacity to readily and efficiently modify those patterns under the same volemic con-ditions (14). Consequently, the persistence of basal ileocolonic transit could contri-bute to further aggravate liquid volume excess or deficit.
Acknowledgments
We are grateful to the Zoonoses Center of the City of Fortaleza for providing the experimental animals (street dogs) and to Dr. R.T. Fogaça for statistical advice.
References
1. Miller WL & Dale HE (1978). Restoration of haemorrhaged plasma volume by gas-trointestinal fluid in dogs. American Jour-nal of Physiology, 234: H80-H87. 2. Levens NR (1985). Control of intestinal
absorption by the renin-angiotensin sys-tem. American Journal of Physiology, 249: G3-G15.
3. Duffy PA, Granger DN & Taylor AE (1978). Intestinal secretion induced by volume expansion in dogs. Gastroenterology, 75: 413-418.
4. Xavier-Neto J, Dos Santos AA & Rola FH (1990). Acute hypervolemia increases the gastroduodenal resistance to the flow of saline in rats. Gut, 31: 1006-1010. 5. Santos AA, Xavier-Neto J, Santiago Jr AT,
Souza MAN, Martins AS, Alzamora F & Rola FH (1991). Acute volaemic changes modify the gastroduodenal resistance to the flow of saline in anaesthetized dogs.
Acta Physiologica Scandinavica, 143: 261-269.
6. Capelo LR, Cavalcante DM, Leitão IA, Cristino-Filho G & da Silva EAT (1983). Modifications of gastric compliance in dogs related to changes of extracellular fluid volume. Brazilian Journal of Medical and Biological Research, 16: 73-76. 7. Rola FH, Santos AA, Xavier-Neto J,
Cristino-Filho G, Rocha CI, Santiago Jr AT, Gondim FAA, Pereira JM & Capelo LR (1989). Effects of acute volemic changes on jejunal compliance in dogs. Brazilian Journal of Medical and Biological Re-search, 22: 523-531.
8. Lee JS (1983). Relationship between in-testinal motility, tone, water absorption and lymph flow in the rat. American Jour-nal of Physiology, 345: 489-499. 9. Clarke AM, Miller M & Shields R (1987).
Intestinal transport of sodium, potassium, and water in dogs during sodium deple-tion. Gastroenterology, 83: 846-858.
10. Binder HJ, Sandle GI & Rajendran VM (1991). Colonic fluid and electrolyte trans-port in health and disease. In: Phillips SF, Pemberton JH & Shorter RG (Editors), The Large Intestine. Chapter 7. Raven Press, New York, 141-168.
11. Wright WK, Cleveland JC & Tilson MD (1969). Morphology and absorptive capac-ity of the ileum after ileostomies in man.
American Journal of Surgery, 117: 242-245.
12. Jarret RJ & Gazet JC (1966). Studies in vivo of the ileocaecocolic sphincter in the cat and the dog. Gut, 7: 217-225. 13. Jahnberg T, Abrahamsson H, Haglund M,
Jansson G & Martisson J (1976). Va-gotomy and gastric reservoir function. Eu-ropean Surgical Research, 2 (Suppl): 69-70.
14. Higgins Jr JT & Blair NP (1971). Intestinal transport of water and electrolytes during extracellular volume expansion in dogs.