ABSTRACT: Meat has played a crucial role in human evolution and is an important component of a healthy and well-balanced diet on account of its nutritional properties, its high biological value as a source of protein, and the vitamins and minerals it supplies. We studied the effects of animal fat reduction and substitution by hydrogenated vegetal fat, sodium alginate and guar gum. Fatty acid composition, lipid oxidation, color and instrumental texture as well as the sensorial differ-ence between low, substituted-fat and the traditional formulations for mortadella-type products were analyzed. Both substitution and reduction of animal fat decreased the saturated fatty acids percentage from 40% down to 31%. A texture profile analysis showed differences between the formulations. Furthermore, lipid oxidation values were not significant for treatments as regards the type and quantity of fat used while the use of sodium alginate and guar gum reduced the amounts of liquid released after cooking. Animal fat substitution does cause, however, a differ-ence in overall sensorial perception compared with non-substituted products. The results confirm the viability of substituting vegetal fat for animal fat.
Keywords: lipid profile, lipid oxidation, fat-replacers, fat vegetal, texture
Escrich et al., 2007). However, the incorporation of these vegetal fats may be associated with a reduction in qual-ity due mainly to a significant oxidative instabilqual-ity. The oxidation of unsaturated lipid fractions along with oxy-gen presence during meat grinding and the adding salt in processing could have a negative impact on the quality of these products (Álvarez et al., 2011).
Hydrocolloids influence many of the functional properties of processed meat products (Chattong et al., 2007). They are commonly used in comminuted prod-ucts as emulsifiers and “texture modifiers” (Fonkwe et al., 2003). The addition of hydrocolloid materials may structurally interfere with the cross-linking required for protein gel network formation (Pérez-Mateos et al., 2001).
In this context, this study aimed to study the influence of animal fat substitution by vegetal fat on mortadella-type products formulated with alginate, guar gum in terms of fatty acid composition, sensory characteristics and oxidative stability of lipids. The effectiveness of the quantification of thiobarbituric acid-reactive substances (TBA-RS) using conventional (spectrophotometric) and HPLC methods was also evaluated.
Materials and Methods
Materials
The commercial vegetal fat, alginate, guar gum, condiments and other additives were donated by lo-cal companies (São Paulo, Brazil). The beef meat was acquired from a local slaughterhouse (São Paulo, Bra-zil) and the animal fat (pork back fat, pork fat trim) and pork meat were donated by a local slaughterhouse
1University of São Paulo/ESALQ – Dept. of Agro-industry,
Food and Nutrition, C.P. 09 13418-900 – Piracicaba, SP – Brazil.
2Institute of Food Technology, Av. Brasil, 2880 – 13070-178
– Campinas, SP – Brazil.
*Corresponding author <ccastill@usp.br>
Edited by: Luís Guilherme de Lima Ferreira Guido
Influence of animal fat substitution by vegetal fat on
Mortadella-
type products
Erick Saldaña1, Ana Lúcia da Silva Corrêa Lemos2, Miriam Mabel Selani1, Fernanda Papa Spada1, Marcio Aurélio de Almeida1,
Carmen Josefina Contreras-Castillo1*
Received November 21, 2014 Accepted May 19, 2015
formulated with different hydrocolloids
Introduction
Meat plays a crucial role in human evolution and is an important component of a healthy and well-bal-anced diet on account of its nutritional properties, its high biological value as a source of protein, and the vitamins and minerals it supplies (Santos et al., 2013). However, recent studies have established a direct rela-tionship between the consumption of meat products and the increase in risk of serious health disorders, such as colorectal cancer and coronary-heart diseases (Ferguson, 2010; Rodríguez-Carpena et al., 2012).
In Brazil, mortadella-type products number amongst the most widely produced meat products, and their consumption has become popular due mainly to their low cost, pleasant flavor, and the assortment of products available, which can be produced using a va-riety of fat types, since Brazilian legislation allows for broad classification (Guerra et al., 2011). Nowadays, consumers demand natural and healthy food products, including meat products, with better nutritional proper-ties (Doménech-Asensi et al., 2013). Thus, the develop-ment of meat products with reduced fat levels, which are similar to traditional products with good consumer acceptability, is essential to the improvement of human health.
(Minas Gerais, Brazil). The expandable cellulose casings were donated by a local company (São Paulo, Brazil). For reasons of confidentiality, no further detail concerning brands of materials used can be provided.
Description and preparation of mortadella-type products
Six types of mortadella-type products were pre-pared with a reduction in and replacement of animal fat (50 % of pork back fat and 50 % of pork fat trim) by hydrogenated vegetal fat (sunflower, cotton and palm oils), with low levels of trans fatty acids (2g 100 g−1).
The fatty acid composition (g 100 g−1) of the vegetal
fat was as follows: 0.03 of C12:0, 0.3 of C14:0, 0.03 of C14:1, 0.03 of C15:0, 12.3 of C16:0, 0.12 of C16:1, 13.6 of C18:0, 60.8 of C18:1 (cis and trans), 11.4 of C18:2, 0.26 of C18:3, 0.6 of C22:0, 27 of SFA, 60 of monoun-saturated fatty acid (MUFA) and 12 of polyunmonoun-saturated fatty acids (PUFA).
The formulations of mortadella-type products are reported in Table 1, and the manufacturing process of the product was carried out as follows: first, beef and pork meat and animal fat were stored at 4 °C and ground with a 20-mm disc. Subsequently, the meats were placed into the cutter. The following were added: salt, curing salt, phosphates, spices, garlic paste, malto-dextrin and 50 % of the total ice required to reduce the mixture temperature to 0 °C and prevent protein denaturation. Afterwards, animal or vegetal fat, milk whey and hydrocolloids were added according to the different formulations. The remaining 50 % of the ice was then added and finally the antioxidants. The final temperature of the mixture obtained was 13 ± 0.8 °C.
The dough was stuffed into expandable casings of cel-lulose with a 72-mm radius. In the formulations, fat was reduced by 62.5 % and up to 100 % of the animal fat was replaced.
The thermal treatment consisted of two steps. In the first step, the oven temperature was maintained at 50 °C for one hour with indirect steam and the chim-ney left open. In the second step, the temperature was kept at 60 °C for another hour using indirect steam and a closed chimney and was halted when the geometric center of the product reached 73 ºC. After the cooking process, the products were cooled using water spray for 30 min before weighing and vacuum packing.
Analytical methods
Proximate composition – Moisture, fat content (Soxhlet) and total protein content (Kjeldahl) were deter-mined following official methods (AOAC, 2005). All the analyses were carried out in triplicate.
Fatty acid profile – The fat was extracted following the method of Folch et al. (1957). Fatty acid methyl es-ters (FAMEs) were prepared from 50 mg of fat using the method described by Hartman and Lago (1973) with slight modifications. FAMEs were analyzed by gas chro-matography equipped with a fused silica capillary col-umn (30 m × 0.53 mm x 1.0 µm) and a flame ionization detector. A heating ramp was used in accordance with the following temperature program: 1) 180 °C for 3 min; 2) an increase to 220 °C at 5 ºC min−1; and 3) a final hold
at 220 °C for 20 min. The injector and detector tempera-tures were 180 °C and 250 °C, respectively. Nitrogen was used as the carrier gas at a rate of 4 mL min−1 in
a split injection mode in a ratio of 1:10. Samples (1 µL) were injected by an automatic injector. Individual FA-MEs peaks were identified by comparing their retention times with those of the standards Mix C8-C22 (FAME Mix C8-C22, Supelco, USA). The results were expressed in grams per 100 g of FAMEs detected. All the analyses were carried out in triplicate.
Determination of TBA-RS numbers – TBA-RS were determined in triplicate using the method described by Vyncke (1970); Vyncke (1975) and Sørensen and Jør-gensen (1996) with some modifications. For extraction, 5 g of the sample was homogenized in an Ultra Turrax at 10, 000 rpm for 30 s with 15 mL of a solution of 7.5 % of trichloroacetic acid (TCA), 0.1 % of propylgallate (PG) and 0.1 % of ethylene diamine tetraacetic acid (EDTA). After filtration with qualitative filter paper (12.5 mm), 5 mL of the filtrate was mixed with 5 mL of an aqueous solution (0.02 M of thiobarbituric acid (TBA)) in capped test tubes. The samples were incubated in a water bath at 100 °C for 40 min and then cooled in cold water. Absorbance was measured at 532 nm and 600 nm by a spectrophotometer against a blank containing 5 mL of the same TCA, PG and EDTA solution and 5 mL of
Table 1 − Formulations (%) of Mortadella-type products with substitution of vegetal fat and reduction of animal fat.
Component AC VC RAF RVF RAFH RVFH
Beef Forequarter 36 36 36 36 36 36
Pork Shoulder 30 30 30 30 30 30
Animal fat 16 0 8 0 8 0
Vegetable Fat 0 12 0 6 0 6
Water/Ice 13 15.2 19.5 20.5 19.5 20.5
Milk Whey 0 1.8 1.5 2.5 1.2 2.2
Sodium Alginate (Ibrac®) 0 0 0 0 0.25 0.25
Guar Gum (5000/Ibrac®) 0 0 0 0 0.05 0.05
Salt 0.8 0.8 0.8 0.8 0.8 0.8
Seasonings 1 1 1 1 1 1
Curing salt* 0.35 0.35 0.35 0.35 0.35 0.35 tripolyphosphate (Ibrac®) 0.35 0.35 0.35 0.35 0.35 0.35
TBA solution. The difference (A 532 nm - A 600 nm) was used as absorbance values corrected for turbidity. The results were calculated from the standard curve of tetraethoxypropane (TEP) and expressed in terms of mg of malonaldehyde (MDA) per kg of sample. The R2 of the
calibration curve was 0.983.
Determination of malonaldehyde using HPLC – The method used for the extraction of malonaldehyde was the same as was used to determine TBA-RS. Once the malonaldehyde extracts were obtained, they were fil-tered through a 0.45 µm polytetrafluoroethylene (PTFE) membrane into autosampler vials and injected (20 µL) into an HPLC equipped with a fluorescence detector. The MDA-TBA complex was analyzed using a Zorbax plus column (C18, 4.6 mm × 250 mm, 5 µm). The elu-tion process was isocratic using 85 % of sodium phos-phate buffer (pH 7.0, 5 mM) and 15 % of acetonitrile at a rate of 1 mL min−1. The detector wavelengths were set
at 515 nm (excitation) and 543 nm (emission). The oven temperature was set to 40 C. A standard curve was made from TEP and the results expressed in terms of mg of malonaldehyde (MDA) per kg of sample. The R2 of the
calibration curve was 0.989.
Texture measurements – The texture profile analysis (TPA) was carried out at room temperature with a Tex-ture Analyser as described by Bourne (2002). Six cylin-ders (2-cm diameter and 2-cm high) were taken from the samples and subjected to a two-cycle compression test. The samples were compressed to 30 % of their original height with a P-35 probe (long shaft, regular base) at a speed of 2 mm s−1.
The following parameters were determined: hard-ness, maximum force during the first cycle of compres-sion; springiness, the height at which the food recovers during the time that elapses between the end of the first cycle and the beginning of the second cycle; cohesive-ness, extent to which the sample could be deformed prior to rupture (A2/A1, where A1 is the total energy required for the first compression, and A2 the total en-ergy required for the second compression) and chewi-ness – i.e. the work required to masticate the sample for swallowing (Horita et al., 2011).
Color measurements – Instrumental color was deter-mined by a Minolta colorimeter using the following pa-rameters: L* (lightness), a* (redness) and b* (yellowness) (CIELAB). The parameters were calibrated in a standard white porcelain where Y = 93.7, x = 0.3160 and y = 0.3323 and with a measurement area of 8 mm in diam-eter, an observation angle of 10° and an illuminant D65. Three 2-cm thick slices from the middle region of each formulation were analyzed in triplicate.
pH – The pH was measured in triplicate using a pH-meter with a puncture electrode inserted into the final product at a temperature of 25 °C.
Cooking loss and emulsion stability – Product cook-ing loss was determined in triplicate and calculated as follows: Cooking loss = [(Wb–Wa)/Wb] ⋅ 100, where Wb and Wa are the weights of the sample before and after cooking, respectively. The emulsion stability test was performed as described by Lin and Mei (2000) with some modifications. An aliquot of 50 g of emulsion mass was weighed in nylon/polyethylene bags resistant to high temperatures, vacuum sealed and placed in a wa-ter bath at 70 °C for one hour. Then the samples were cooled to 4 °C. The total amount of fluid released was expressed as a percentage of the sample weight. The test was performed five times for each formulation and was called "Total Fluid Release" in Table 3.
Sensory evaluation – For the sensory analysis, a Differ-ence-from-Control test, was used as described by Meil-gaard et al. (2006). The samples VC, RAF, RVF, RAFH and RVFH were evaluated in comparison with the AC sample, in duplicate, by a team of 20 panelists (55 % female and 45 % male). The panelists were recruited and selected from Campinas, SP, (Brazil), based on their con-sumption of the focal products and their sensory acuity. They assessed the six samples in a single session; 50 g of each sample were put in small plastic dishes identi-fied with a random three-digit code and served following a balanced complete block experimental design (Meil-gaard et al., 2006; Wakeling and MacFie, 1995). Panelists gave informed consent and were compensated for their participation.
A 7-point scale (1 = no difference to 7 = very large difference) was used to measure overall difference, seasoning difference, saltiness difference and firmness difference. The AC was the blind control (Lawless and Heymann, 2010). The evaluations were conducted in in-dividual booths equipped with lighting supplied by fluo-rescent lamps and the Compusense® software, version 5.4 (Addinsoft, New York, USA).
Statistical analysis – The repeated measures test was used for statistical comparisons between samples. The data were evaluated through analyses of variance (ANOVA) and the averages were compared by Tukey's test using XLSTAT (Addinsoft, New York, EEUU). Dif-ferences were considered significant at a confidence level of 95 % (p < 0.05). For the sensory evaluation,
differences were considered significant at a confidence level of 95 % (p < 0.05) using Dunnett's test. The
rela-tionships between sensory parameters were calculated using Pearson's correlation coefficients. Principal Com-ponent Analysis (PCA) was also carried out.
Results and Discussion
Proximate composition
Proximate analysis revealed a number of differ-ences (p < 0.05) between the six formulations (Table
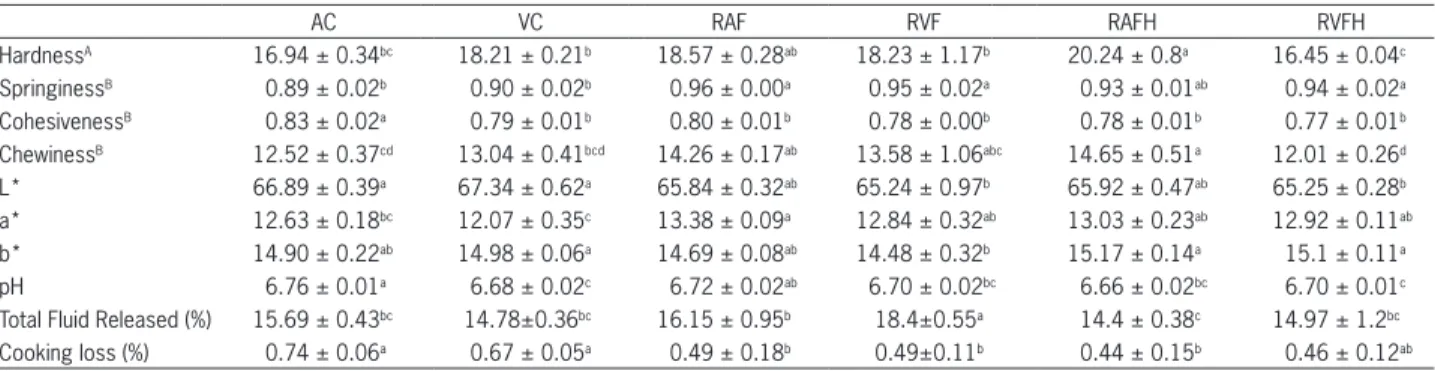
ex-sion stability, color, pH and the textural properties of the product. According to Table 3, the fat reduction without the addition of hydrocolloids caused an increase in fluid release when the product was subjected to thermal treat-ment. This behavior usually occurs when fat is replaced by water. In such a case, since protein levels are constant, a decrease in protein concentration involved in the emul-sion formation may have occurred, thereby reducing the binding properties of water and fat in products with a lower fat content. However, when sodium alginate and guar gum were added to the formulations, the fluid re-lease was reduced, and this behavior is in agreement with other studies (Flores et al., 2007). The cooking loss showed differences (p < 0.05) between formulations. This
result is certainly related to fat reduction and the pres-ence of hydrocolloids in the product, once hydrocolloids became capable of holding water and fat, thereby reduc-ing fluid release and consequently the cookreduc-ing loss.
The TPA of the six formulations (Table 3) revealed differences (p < 0.05) for hardness, springiness,
cohesive-ness and chewicohesive-ness. The RVFH formulation with 0.25 % of sodium alginate and 0.05 % of guar gum in its formu-lation had 16.45 N of hardness, a lower value compared with the VC and RVF formulations, but similar to the AC formulation. Similar behavior is reported by Marchetti et al., (2013) and is attributed to the increase in water hold-ing capacity caused by the addition of sodium alginate and guar gum. Water provides less resistance to com-pression, leading to softer products (Youssef and Barbut, 2011). Thus, the presence of fiber could have caused a dis-ruption in the protein-water and protein-protein network, leading to a decrease in the gel strength of the product (Lin et al., 1998). Different results were found by Men-doza et al. (2001), who reported that the addition of fiber (inulin) did not affect the hardness of sausages and by the study of Fernández-Ginés et al. (2003), who indicated that sausages with citrus fiber showed higher hardness values compared with the control. Both hardening and softening have been observed when fiber is added to various meat products, which can be due to the amount and type of fiber used (Fernández-Ginés et al., 2003).
istence of three groups. The first group consisted of AC and VC with 100 % of animal and vegetal fat in their formulations, respectively, containing around 61 % of moisture whereas the second group consisted of RAF and RAFH with 50 % of animal fat in their formulations, containing around 65 % of moisture. The third group consisted of RVF and RVFH with 37 % of vegetal fat in their formulations, which contained more than 67 % of moisture. Total lipid content varied between 10 % and 17 % showing differences (p < 0.05) between
formu-lations. Although there was a difference (p < 0.05) in
protein content of the formulations, though the variation between the values was only 1 % (ranging from 16 % to 17 %). These similar values occurred mainly because the six treatments were formulated with the same meat content. The ash content showed differences (p < 0.05)
between formulations. The results of the present study are within the usual scope for this type of meat product (Horita et al., 2011).
pH, emulsion stability, instrumental color and texture With the reduction and replacement of animal fat by vegetal fat in the formulations, the binding proper-ties of water and fat were modified, changing the
emul-Table 2 − Proximate composition of the formulations.
Moisture Lipid Protein Ash
--- g 100 g−1
---AC 61.03 ± 0.44c 15.61 ± 0.15b 17.22 ± 0.22ab 3.24 ± 0.12b
VC 61.12 ± 0.16c 16.54 ± 0.14a 16.55 ± 0.31bc 3.29 ± 0.12ab
RAF 65.20 ± 0.17b 10.39 ± 0.22c 17.47 ± 0.14a 3.30 ± 0.14ab
RVF 67.98 ± 0.11a 9.90 ± 0.04c 17.02 ± 0.16abc 3.19 ± 0.08b
RAFH 65.41 ± 0.09b 9.97 ± 0.10c 16.40 ± 0.19c 3.59 ± 0.08a
RVFH 67.37 ± 0.95a 10.06 ± 0.33c 16.86 ± 0.39abc 3.34 ± 0.10ab
Results are expressed as averages ± standard deviation. Averages followed by the same letter in the same column are not different (p < 0.05). AC= Animal Control: 100 % Animal Fat; VC= Vegetable Control: 100 % Vegetable fat; RAF= Reduced Animal Fat: 50 % Animal Fat; RVF= Reduced Vegetable Fat: 50 % Vegetable Fat; RAFH= Reduced Animal Fat with Hydrocolloids; RVFH= Reduced Vegetable Fat with Hydrocolloids. Hydrocolloids= alginate (0.25 %) and guar gum (0.05 %).
Table 3 − pH, emulsion stability, instrumental color and texture of products manufactured using vegetal fat as replacers of animal fat.
AC VC RAF RVF RAFH RVFH
HardnessA 16.94 ± 0.34bc 18.21 ± 0.21b 18.57 ± 0.28ab 18.23 ± 1.17b 20.24 ± 0.8a 16.45 ± 0.04c
SpringinessB 0.89 ± 0.02b 0.90 ± 0.02b 0.96 ± 0.00a 0.95 ± 0.02a 0.93 ± 0.01ab 0.94 ± 0.02a
CohesivenessB 0.83 ± 0.02a 0.79 ± 0.01b 0.80 ± 0.01b 0.78 ± 0.00b 0.78 ± 0.01b 0.77 ± 0.01b
ChewinessB 12.52 ± 0.37cd 13.04 ± 0.41bcd 14.26 ± 0.17ab 13.58 ± 1.06abc 14.65 ± 0.51a 12.01 ± 0.26d
L* 66.89 ± 0.39a 67.34 ± 0.62a 65.84 ± 0.32ab 65.24 ± 0.97b 65.92 ± 0.47ab 65.25 ± 0.28b
a* 12.63 ± 0.18bc 12.07 ± 0.35c 13.38 ± 0.09a 12.84 ± 0.32ab 13.03 ± 0.23ab 12.92 ± 0.11ab
b* 14.90 ± 0.22ab 14.98 ± 0.06a 14.69 ± 0.08ab 14.48 ± 0.32b 15.17 ± 0.14a 15.1 ± 0.11a
pH 6.76 ± 0.01a 6.68 ± 0.02c 6.72 ± 0.02ab 6.70 ± 0.02bc 6.66 ± 0.02bc 6.70 ± 0.01c
Total Fluid Released (%) 15.69 ± 0.43bc 14.78±0.36bc 16.15 ± 0.95b 18.4±0.55a 14.4 ± 0.38c 14.97 ± 1.2bc
Cooking loss (%) 0.74 ± 0.06a 0.67 ± 0.05a 0.49 ± 0.18b 0.49±0.11b 0.44 ± 0.15b 0.46 ± 0.12ab
Results are expressed as averages ± standard deviation. Values with a different letter (a–d) within a row are different (p < 0.05); A(N); B(Dimensionless). AC= Animal
fat changed (p < 0.05) the objective color measurements
(Table 3). In reduced fat treatments, with or without hy-drocolloids, a slight decrease in luminosity (L*) and a slight increase in redness (a*) compared to the controls (AC and VC) were observed. The yellowness (b*) in-creased in products with guar gum and sodium alginate. Color variation between formulations may be the result of the amount of animal fat (light color) and oil distri-bution in the actomyosin matrix during processing (cut-tering and mixing) which increased the surface of the fat particles and altered the color after cooking (Álvarez et al., 2011). For the pH, formulations with vegetal fat addition had values close to 6.70 while the treatments with animal fat had values from 6.66 and 6.76. Although pH values presented significant effects of the treatments, variations of 0.1 can be considered marginal and not sig-nificant on a practical level.
Fatty acids profile
Ninety percent of all fatty acids are represented by palmitic acid, stearic acid, oleic acid and linoleic acid (Table 4). As expected, the reformulation caused impor-tant changes in the fatty acids profile. The incorporation of vegetal fat significantly decreased total SFA content (Table 4). In the treatments with vegetal fat (VC, RVF and RVF), palmitic acid (C16:0) decreased 9 perceptual points (PP) and stearic acid (C18:0) increased 1 PP com-pared with animal fat formulations. Clearly, the addition of vegetal fat affected SFA (p < 0.05), reflecting its
par-ticular composition. Consequently, the reduction in SFA Springiness varied from 0.89 to 0.96 and the
re-sults showed high values for the RAF, RVF, RAFH and RVFH formulations, while formulations with 100 % of fat (AC and VC) had low values, meaning that samples with high fat content have a low capacity for recovering their initial dimensions after the first deformation (Hor-ita et al., 2011). The higher springiness values of treat-ments with hydrocolloids may be due to the fact that they may have altered the gel structure and increased binding within the product. Furthermore, according to Pietrasik and Duda (2000), fat reduction in meat prod-ucts may result in prodprod-ucts with higher springiness.
Cohesiveness indicates the degree of difficulty to break the internal structure of the product (Horita et al., 2011). In the experiment, cohesiveness varied from 0.77 to 0.83, and the AC formulation had the highest value among the treatments. Similar results were reported by Fernández-Ginéz et al. (2003), who verified lower val-ues of cohesiveness in formulations with fiber addition and by Berasategi et al. (2014), who indicated that cohe-siveness values decreased significantly when fat content decreased and water increased. Chewiness showed dif-ferences (p < 0.05) between treatments, ranging from
12.01 to 14.65. The RVFH formulation had the lowest value, which may be attributed to the addition of sodium alginate and guar gum that increased the water retention capacity of the treatments, decreased hardness and, con-sequently, led to a lower value for chewiness.
The preparation of mortadella-type products with the reduction and substitution of vegetal fat for animal
Table 4 − Fatty acid profile (g 100 g−1) of products manufactured using vegetal fat as replacers of animal fat.
AC VC RAF RVF RAFH RVFH
C10:0 0.06 ± 0.001b 0.02 ± 0.001e 0.06 ± 0.001b 0.04 ± 0.010c 0.06 ± 0.002a 0.03 ± 0.001d
C12:0 0.06 ± 001bc 0.04 ± 0.001d 0.06 ± 001b 0.06 ± 0.001bc 0.07 ± 0.001a 0.06 ± 0.001c
C14:0 1.25 ± 0.003b 0.59 ± 0.007e 1.25 ± 0.001b 0.82 ± 0.010c 1.41 ± 0.021a 0.78 ± 0.015d
C14:1 0.04 ± 0.001bc 0.03 ± 0.001c 0.04 ± 0.001bc 0.07 ± 0.003a 0.08 ± 0.013a 0.06 ± 0.011b
C15:0 0.10 ± 0.001ab 0.08 ± 0.002b 0.10 ± 0.001ab 0.12 ± 0.002a 0.14 ± 0.002a 0.10 ± 0.000a
C16:0 24.71 ± 0.013a 15.56 ± 0.017d 24.71 ± 0.005a 17.10 ± 0.074b 24.60 ± 0.046a 16.70 ± 0.042c
C16:1 (n-7) 2.30 ± 0.004b 0.75 ± 0.010e 2.30 ± 0.002b 1.12 ± 0.013c 2.46 ± 0.007a 1.06 ± 0.018d
C17:0 0.46 ± 0.005b 0.21 ± 0.002e 0.46 ± 0.001b 0.30 ± 0.004c 0.50 ± 0.001a 0.27 ± 0.001d
C18:0 12.58 ± 0.001b 13.81 ± 0.007a 12.59 ± 0.013b 13.8 2± 0.013a 12.52 ± 0.029b 13.66 ± 0.062a
C18:1 (n-9) 47.49 ± 0.011d 57.85 ± 0.179a 47.49 ± 0.013d 55.92 ± 0.068c 47.48 ± 0.005d 56.68 ± 0.051b
C18:2 (n-6) 9.18 ± 0.005c 10.37 ± 0.056a 9.18 ± 0.005c 9.65 ± 0.032b 8.67 ± 0.008d 9.78 ± 0.017b
C18:3 (n-3) 0.32 ± 0.003a 0.19 ± 0.012c 0.31 ± 0.004a 0.22 ± 0.004b 0.30 ± 0.008a 0.22 ± 0.003b
C22:0 0.67 ± 0.005a 0.24 ± 0.015e 0.66 ± 0.008ab 0.29 ± 0.006c 0.64 ± 0.001b 0.27 ± 0.019d
SFA 39.89 ± 0.028a 30.56 ± 0.051d 39.89 ± 0.024a 32.55 ± 0.110b 39.94 ± 0.102a 31.87 ± 0.141c
MUFA 49.84 ± 0.016d 58.64 ± 0.190a 49.83 ± 0.015d 57.12 ± 0.084c 50.03 ± 0.025d 57.79 ± 0.081b
PUFA 9.50 ± 0.009c 10.56 ± 0.068a 9.49 ± 0.010c 9.88 ± 0.036b 8.98 ± 0.015d 10.00 ± 0.021b
n-3 0.32 ± 0.003a 0.19 ±0.012c 0.31 ± 0.004a 0.22 ± 0.004b 0.30 ± 0.008a 0.22 ± 0.003d
n-6 9.18 ± 0.005c 10.37 ± 0.056a 9.18 ± 0.005c 9.65 ± 0.032b 8.67 ± 0.008d 9.78 ± 0.017b
n6/n3 29.02 ± 0.296c 53.53 ±3 .075ª 29.33 ± 0.425c 43.45 ± 0.729b 28.42 ± 0.748c 43.59 ± 0.588b
PUFA/SFA 0.238 ± 0.000d 0.346 ± 0.002a 0.238 ± 0.000d 0.303 ± 0.002c 0.225 ± 0.000e 0.311 ± 0.004b
in products with vegetal fat increased the percentage of MUFA and PUFA in 10 and 1 PP, respectively. For MU-FAs, oleic acid increased 10 PP while for PUMU-FAs, linoleic acid increased 1 PP compared to the treatments with animal fat. The fatty acid profile is very important from the nutritional viewpoint, since it allows for quantifying the SFA, MUFA and PUFA. The SFA increases the low density lipoproteins (LDL), and according to Rodríguez-Carpena et al. (2012), the intake of SFA could lead to an increase in cholesterol levels in the blood. The unsatu-rated fatty acids are composed of MUFA and PUFA, and according to Mattson and Grundy (1985), MUFAs show better effects than PUFAs in terms of LDL reduction.
The nutritional quality of the lipid fraction of food can be evaluated through the PUFA/SFA ratio. Increases in this ratio could lead to a reduction in total cholesterol in the blood plasma (McAfee et al., 2010). The products formulated with vegetal fat had increases (p < 0.05) in
the PUFA/SFA ratio compared to products prepared with animal fat; none of the formulations reached the level of 0.4 (minimum recommended value) (Wood et al., 2004). This behavior may be attributed to the characteristically low PUFA/SFA ratio in meat (0.1) (Webb and O’Neill, 2008), which implied an imbalance. Furthermore, hy-drogenated vegetal fat does not have a high content of PUFAs. Thus, if the objective is to reduce and replace the animal fat with vegetal fat, it is necessary to not only reduce the SFA, but also to increase the PUFA, especially the n-3 type (Ospina-E. et al., 2011).
PUFAs are very important in meat products be-cause n-6 and n-3 fatty acids cannot be synthesized by humans; n-6 fatty acid can be elongated to araquidonic acid (C20:4, n-6) which acts as a precursor of eicosanoids (Webb and O’Neill, 2008). N-3 fatty acids play a key role in diet in terms of inflammatory reduction, HDL increase and LDL reduction (Johnston, 2009). Another
index based on the PUFA amount which evaluates the quality of the lipid fraction in food is the n-6/n-3 ratio (Rodríguez-Carpena et al., 2012) which may cause car-diovascular diseases at high levels (Simopoulos, 2002). In this research, the relationship n-6/n-3 significantly increased with the addition of vegetal fat to the formu-lation. Therefore, it is not an adequate replacement of animal fat not only because of the PUFA/SFA ratio, but also because of the n-6/n-3 ratio.
Oxidative stabilization and malonaldehyde mea-surement
The measurement of TBA-RS was taken and all formulations showed oxidation values below 0.5 mg malonaldehyde per kg of sample (Figure 1), which is the maximum level allowed for processed meat products be-cause it produces a rancid odor and taste that can be de-tected by the consumer (Rodríguez-Carpena et al., 2012).
Both the reduction and replacement of animal fat by hydrogenated vegetal fat had no effect on TBA-RS (p
> 0.05), thus lipid oxidation was not influenced. This behavior may be explained by the composition of vegetal fat which has a predominance of MUFAs, and low quan-tities of PUFAs, that are more sensitive to lipid oxidation. However, the AC formulation presenting more fat than RAF, RVF, RAFH and RVFH, did not show higher TBA-RS values (p > 0.05), since animal fat presents SFA as
major fatty acids.
In this study, the quantification of MDA was deter-mined in two ways: the spectrophotometric and HPLC methods. The spectrophotometric method is the more commonly used in quantifying MDA, but it is not spe-cific for this compound. Thus, to obtain a spespe-cific quanti-fication of MDA, this investigation evaluated the content of malonaldehyde using HPLC.
Although no difference (p > 0.05) between
meth-ods was observed (Figure 1), the content of malonalde-hyde spectrophotometrically determined was slightly higher and presented a higher standard deviation than the results obtained by HPLC. These results are in agree-ment with those reported by Papastergiadis et al. (2012). The overlapping of the chromatograms from the MDA-TBA products of the six formulations is presented in the Figure 2, where the retention time for the forma-tion of the maximum peak was about 6.5 min at a flow rate of 1 mL min−1.
Sensory evaluation
A difference (p < 0.05) between the AC and VC
was found for the overall difference attribute, while for the other attributes there was no difference (p > 0.05)
between formulations (Table 5). This result shows that the six formulations evaluated were very similar and that, in general, the reduction of fat and addition of hydrocolloids did not affect the sensory characteristics studied here. The PCA was carried out using a correlation matrix on sensory attribute data to explain which attribute within the four evaluated had a closer relationship with the
all difference, and to explain why AC and VC differ (p <
0.05). The two first principal components explain 72 % and 22 % of the variation of the experimental data.
The first principal component (Factor 1) (Figure 3A) was positively correlated with the attributes’ differ-ences in seasoning flavor, saltiness and firmness, while it was negatively correlated with the attributes’ overall dif-ference. Furthermore, the principal component 2 (Factor 2) was positively correlated with the attributes’ overall difference, difference in saltiness and firmness. The cor-relation matrix of all the attributes evaluated had a mod-ule close to the unit, suggesting an acceptable explana-tion of the experimental variaexplana-tion of all the attributes in the two principal components considered.
The AC, RAF and RAFH samples were located on the right side of principal component 1 (Figure 3B), indicating a higher intensity in the attributes positively correlated with this principal component (differences in seasoning flavor, saltiness and firmness) and negatively correlated with the overall difference. As regards princi-pal component 2, the RVF, RAF, AC and VC samples, lo-cated in the upper side of principal component 2, had a
Figure 2 − HPLC chromatograms of MDA-TBA-RS complex (retention time 6.545 min) of the six products. AC= Animal Control: 100 % Animal Fat; VC= Vegetable Control: 100 % Vegetable fat; RAF= Reduced Animal Fat: 50 % Animal Fat; RVF= Reduced Vegetable Fat: 50 % Vegetable Fat; RAFH= Reduced Animal Fat with Hydrocolloids; RVFH= Reduced Vegetal Fat with Hydrocolloids. Hydrocolloids= alginate (0.25 %) and guar gum (0.05 %).
Table 5 −Mean values of the sensory evaluation of Mortadella-type products.
Overall difference Seasoning flavor Saltiness Firmness VC 3.0 ± 1.2b 3.4 ± 1.0a 3.5 ± 1.1a 3.9 ± 0.8a
RAF 2.1 ± 0.9a 4.1 ± 1.0a 4.0 ± 0.8a 4.1 ± 0.8a
RVF 2.2 ± 1.1a 3.8 ± 0.8a 3.9 ± 0.6a 3.9 ± 0.8a
RAFH 2.2 ± 1.0a 4.0 ± 1.0a 3.9 ± 0.8a 4.0 ± 0.7a
RVFH 2.3 ± 1.1a 4.1 ± 1.0a 3.7 ± 0.7a 3.7 ± 0.7a
LSD (5 %) 0.71 0.64 0.54 0.5
Results are expressed as averages ± standard deviation. Values with a different letter (a–b) were different (p < 0.05) by Dunnett's test. LSD = Least Significant Difference. AC= Animal Control: 100 % Animal Fat; VC= Vegetable Control: 100 % Vegetable fat; RAF= Reduced Animal Fat: 50 % Animal Fat; RVF= Reduced Vegetable Fat: 50 % Vegetable Fat; RAFH= Reduced Animal Fat with Hydrocolloids; RVFH= Reduced Vegetable Fat with Hydrocolloids. Hydrocolloids= alginate (0.25 %) and guar gum (0.05 %).
Bourne, M. 2002. Food texture and Viscosity: Concept and Measurement: Academic Press, San Diego, CA, USA.
Chattong, U.; Apichartsrangkoon, A.; Bell, A.E. 2007. Effects of hydrocolloid addition and high pressure processing on the rheological properties and microstructure of a commercial ostrich meat product “Yor” (Thai sausage). Meat Science 76: 548-554.
Doménech-Asensi, G.; García-Alonso, F.J.; Martínez, E.; Santaella, M.; Martín-Pozuelo, G.; Bravo, S.; Periago, M.J. 2013. Effect of the addition of tomato paste on the nutritional and sensory properties of mortadella. Meat Science 93: 213-219.
Escrich, E.; Moral, R.; Grau, L.; Costa, I.; Solanas, M. 2007. Molecular mechanisms of the effects of olive oil and other dietary lipids on cancer. Molecular Nutrition & Food Research 51: 1279-1292.
Ferguson, L.R. 2010. Meat and cancer. Meat Science 84: 308-313. Fernandez-Gines, J.M.; Fernandez-Lopez, J.; Sayas-Barbera,
E.; Sendra, E.; Perez-Alvarez, J.A. 2003. Effect of storage conditions on quality characteristics of bologna sausages made with citrus fiber. Journal of Food Science68: 710–715. Flores, M.; Giner, E.; Fiszman, S.M.; Salvador, A.; Flores, J.
2007. Effect of a new emulsifier containing sodium stearoyl-2-lactylate and carrageenan on the functionality of meat emulsion systems. Meat Science 76: 9-18.
Folch, J.; Lees, M.; Sloane-Stanley, G. 1957. A simple method for the isolation and purification of total lipids from animal tissues. The Journal of Biological Chemistry226: 497-509.
Fonkwe, L.G.; Narsimhan, G.; Cha, A.S. 2003. Characterization of gelation time and texture of gelatin and gelatin–polysaccharide mixed gels. Food Hydrocolloids 17: 871-883.
Guerra, I.C.D.; Félex, S.S.S.; Meireles, B.R.L.M.; Dalmás, P.S.; Moreira, R.T.; Honório, V.G.; Milani, R.F.; Benevides, S.D.; Queiroga, R.C.R.E.; Madruga, M.S. 2011. Evaluation of goat mortadella prepared with different levels of fat and goat meat from discarded animals. Small Ruminant Research 98: 59-63.
Hartman, L.; Lago, R.C. 1973. Rapid preparation of fatty acid methyl esters from lipids. Laboratory Practice 22: 475-476. Horita, C.N.; Morgano, M.A.; Celeghini, R.M.S.; Pollonio, M.A.R.
2011. Physico-chemical and sensory properties of reduced-fat mortadella prepared with blends of calcium, magnesium and potassium chloride as partial substitutes for sodium chloride. Meat Science 89: 426-433.
Johnston, C. 2009. Functional foods as modifiers of cardiovascular disease. American Journal of Lifestyle Medicine3: 39-43. Lawless, H.T.; Heymann, H. 2010. Sensory Evaluation of Food:
Principles and Practices. Springer, New York, NY, USA. Lin, K.C.; Keeton, J.T.; Gilchrist, C.L.; Cross, H.R. 1988.
Comparisons of carboxymethyl cellulose with differing molecular features in low fat frankfurters. Journal of Food Science 53: 1592-1595.
Lin, K.W.; Mei, M.Y. 2000. Influences of gums, soy protein isolate, and heating temperatures on reduced-fat meat batters in a model system. Journal of Food Science 65: 48-52.
Marchetti, L.; Andrés, S.C.; Califano, A.N. 2013. Textural and thermal properties of low-lipid meat emulsions formulated with fish oil and different binders. LWT - Food Science and Technology 51: 514-523.
high intensity with the attributes’ overall difference, and differences in saltiness and firmness while RVFH and RAFH samples were negatively correlated with princi-pal component 2, showing low intensity for these attri-butes. The difference (p < 0.05) between VC compared
to the control formulation (AC) is due to the fact that these treatments are at the opposite ends of principal component 1 (Figure 3).
The results of this research highlight the impor-tance of the reformulation of meat products using un-saturated vegetal fats and hydrocolloids. The evaluation of the functional effect of the reformulated products and the development of further studies on the sensory char-acteristics and consumer studies to verify the scope of the reformulation is recommended.
Conclusions
The development of mortadella-type products with reduction and replacement of animal fat by veg-etal fat, sodium alginate and guar gum resulted in meat products with improved nutritional properties as a con-sequence of an increase in monounsaturated fatty ac-ids. Changes in the composition had no effect on lipid oxidation, which is extremely interesting. The physico-chemical properties were altered, thereby affecting the instrumental texture, but the use of hydrocolloids helped to reduce this effect. Animal fat substitution causes dif-ference in overall sensorial perception compared with non-substituted products.
Acknowledgements
Erick Saldaña thanks the “Ministerio de Edu-cación del Perú” for the scholarship granted by the pro-gram “Propro-grama Nacional de Becas y Crédito Educativo” (PRONABEC). The authors are grateful to the São Paulo Research Foundation (FAPESP) for funding project n° 2013/05359-7. Helpful comments from two anonymous reviewers of the first version of the manuscript are also gratefully acknowledged.
References
Álvarez, D.; Delles, R M.; Xiong, Y.L.; Castillo, M., Payne, F.A.; Laencina, J. 2011. Influence of canola-olive oils, rice bran and walnut on functionality and emulsion stability of frankfurters. LWT - Food Science and Technology44: 1435-1442.
Association of Official Analytical Chemists - International [AOAC]. 2005. Official Methods of Analysis. 18ed. AOAC, Gaithersburg, MD, USA.
Beiloune, F.; Bolumar, T.; Toepfl, S.; Heinz, V. 2014. Fat reduction and replacement by olive oil in bologna type cooked sausage: quality and nutritional aspects. Food and Nutrition Sciences 5: 645-657. Berasategi, I.; García-Íñiguez de Ciriano,M.; Navarro-Blasco, I.; Calvo,
Mattson, F.H.; Grundy, S.M. 1985. Comparison of effects of dietary saturated, monounsaturated, and polyunsaturated fatty acids on plasma lipids and lipoproteins in man. Journal of Lipid Research 26: 194-202.
McAfee, A.J.; McSorley, E.M.; Cuskelly, G.J.; Moss, B.W.; Wallace, J.M.W.; Bonham, M.P.; Fearon, A.M. 2010. Red meat consumption: an overview of the risks and benefits. Meat Science 84: 1-13.
Meilgaard, M.C.; Carr, B.T.; Civille, G.V. 2006. Sensory Evaluation Techniques. CRC Press, Boca Raton, FL, USA.
Mendoza, E.; García, M.L.; Casas, C.; Selgas, M.D. 2001. Inulin as fat substitute in low fat, dry fermented sausages. Meat Science 57: 387-393.
Ospina-E., J.C.; Sierra-C, A.; Ochoa, O.; Pérez-Álvarez, J.A.; Fernández-López, J. 2011. Substitution of saturated fat in processed meat products: a review. Critical Reviews in Food Science and Nutrition 52: 113-122.
Papastergiadis, A.; Mubiru, E.; Langenhove, H. van; De Meulenaer, B. 2012. malondialdehyde measurement in oxidized foods: evaluation of the spectrophotometric Thiobarbituric Acid Reactive Substances (TBARS) test in various foods. Journal of Agricultural and Food Chemistry 60: 9589-9594.
Pérez-Mateos, M.; Hurtado, J.L.; Montero, P.; Fernández-Martín, F. 2001. Interactions of κ-carrageenan plus other hydrocolloids in fish myosystem gels. Journal of Food Science 66: 838-843. Pietrasik, Z.; Duda, Z. 2000. Effect of fat content and soy protein/
carrageenan mix on the quality characteristics of comminuted, scalded sausages. Meat Science 56: 161-188.
Rodríguez-Carpena, J.G.; Morcuende, D.; Estévez, M. 2012. Avocado, sunflower and olive oils as replacers of pork back-fat in burger patties: effect on lipid composition, oxidative stability and quality traits. Meat Science 90: 106-115.
Santos, B.A.; Pollonio, M.A.R.; Cruz, A.G.; Messias, V.C.; Monteiro, R.A.; Oliveira, T. L.C.; Faria, J.A.F.; Freitas, M.Q.; Bolini, H.M.A. 2013. Ultra-flash profile and projective mapping for describing sensory attributes of prebiotic mortadellas. Food Research International 54: 1705-1711.
Simopoulos, A.P. 2002. The importance of the ratio of omega-6/ omega-3 essential fatty acids. Biomedicine & Pharmacotherapy 56: 365-379.
Sørensen, G.; Jørgensen, S. 1996. A critical examination of some experimental variables in the 2-thiobarbituric acid (TBA) test for lipid oxidation in meat products. Zeitschrift für Lebensmittel-Untersuchung und Forschung 202: 205-210.
Vyncke, W. 1970. Direct determination of the thiobarbituric acid value in trichloracetic acid extracts of fish as a measure of oxidative rancidity. Fette, Seifen, Anstrichmittel 72: 1084-1087. Vyncke, W. 1975. Evaluation of the direct thiobarbituric acid
extraction method for determining oxidative rancidity in mackerel (Scomber scombrus L.). Fette, Seifen, Anstrichmittel 77: 239-240.
Wakeling, I.N.; MacFie, H.J.H. 1995. Designing consumer trials balanced for first and higher orders of carry-over effect when only a subset of k samples from t may be tested. Food Quality and Preference 6: 299-308.
Webb, E.C.; O’Neill, H.A. 2008. The animal fat paradox and meat quality. Meat Science 80: 28-36.
Wood, J. D.; Richardson, R.I.; Nute, G.R.; Fisher, A.V.; Campo, M.M.; Kasapidou, E.; Sheard, P.R.; Enser, M. 2004. Effects of fatty acids on meat quality: a review. Meat Science 66: 21-32. Youssef, M.K.; Barbut, S. 2011. Fat reduction in comminuted