The Meaning of Trust for Brazilians with Higher
Education
Jakson Alves de Aquino1
Accepted: 9 November 2015
Springer Science+Business Media Dordrecht 2015
Abstract The validity of the World Values Survey (WVS) question used to measure trust is disputed over and this article is intended to present the results of an online survey, conducted in Brazil, which tested the meaning of the term trust in the WVS question. The surveyed population is entirely Brazilian and the majority has received some form of higher education. The results of the survey partially corroborate the validity of the WVS and partially deny it. Within the results of this survey there are predominantly two dom-inant perspectives represented within the surveyed population including: respondents who think in friends and relatives as part of most people have a higher probability of also saying to trust most people which means that different people may be answering slightly different questions. However, respondents who say that trust most people have higher levels of trust in people in general than in family if compared with respondents who say to not trust most people which is in accordance with the expectation that the question adequately measures generalized interpersonal trust.
Keywords TrustQuestion validityWorld Values Survey
1 Introduction
Many researchers have operationalized the concept of social capital as interpersonal trust and comparative investigations have often used as indicator of trust respondents’ answers to one of the items of the scale of faith in people in a survey conducted by Rosenberg
(1956, p. 690). The question wording in the World Values Survey (WVS) is:
& Jakson Alves de Aquino [email protected]
1
Federal University of Ceara´, Av. da Universidade, 2995 – Benfica, Fortaleza, CE CEP 60020-181, Brazil
Generally speaking, would you say that most people can be trusted or that you need to be very careful in dealing with people?
1 Most people can be trusted. 2 Need to be very careful.
This question is used to compare the average confidence levels of individuals within a certain country and to compare the confidence levels of different countries. For instance,
Inglehart and Welzel (2005) used Freedom House scores as indicator of democracy and the
same scores multiplied by the World Bank control of corruption scores as indicator of effective democracy and found that interpersonal trust is strongly and positively correlated with the two forms of democracy.
Single items are cheap and can more easily be included in different researches, thereby
helping to find relationships among different social constructs (Leung and Xu2013, p. 8).
However the advantages of using a single item are more widely accepted when the concept whose measure is being operationalized is a ‘‘concrete singular object or concrete
attri-bute’’ (Leung and Xu2013, p. 2). This may not be the case of interpersonal trust.
The analysis of WVS data shows Brazilians as the champions in lacking trust in other
people (Reis2003, p. 46). In surveying the Brazilian Metropolitan Region of Belo
Hori-zonte, only 8.6 % of the interviewees said to trust most people (Ina´cio and Arau´jo
2007, p. 234). In the Brazilian Social Survey, 86 % of respondents said that they do not
trust or have a low trust in most people (Almeida et al.2002) and although Brazil is one of
the countries with the highest social inequality in the world, it sounds strange that one of the most developed countries of Latin America has such a low level social capital.
Torpe and Lolle (2011) used WSV data from 2006 to 2008 wave to compare
respon-dents’ answers to two questions on trust: the above mentioned question on trust in most people and another which asked about trust in people met for the first time. They found that for respondents from Western countries the two questions are equivalent, but for people living in other regions the correlation between the answers of the two questions was much lower. In other words, the validity of the question on trust as an adequate measure of generalized interpersonal trust is disputed.
According to Borsboom et al. (2004), for a measurement being valid, the changes in the
measured values must be caused by the thing corresponding to the concept that one is trying to operationalize. That is, the answers of respondents to the World Values Survey question on trust should depend on the level of the respondents’ trust in people in general, and not in anything else. In this paper, I present the results of an online survey with Brazilian respondents on the meaning of the WVS question on trust. My goal is to investigate social and cognitive processes leading to the answer of the question on trust to discover what is really causing respondents to say that either ‘‘most people can be trusted’’ or they ‘‘need to be very careful’’. In this research, respondents filled a questionnaire with questions on how they have understood the key terms in the question on trust, and, thus, this is a research on the face validity of the question. But the questionnaire has many questions about other opinions and attitudes of respondents that help us to interpret what was going on in their minds when they were answering the question on trust. Hence, this is also an investigation on the construct validity of the question (Borsboom et al.
2004, p. 1063).
Investigating the meaning of trust in only one country is not enough to definitely check the validity of the WVS question, but our results already show that respondents who think
in friends and relatives as part ofmost peoplehave a higher probability of also saying to
questions. However, respondents who say that trust most people have higher levels of trust in people in general than in family if compared with respondents who say to not trust most people which is in accordance with the expectation that the question adequately measures generalized interpersonal trust.
The next section discuss the meaning of trust. Then I present the data and the results of the investigation and, finally, the conclusions.
2 The Meaning of Trust
Inglehart argues that the mere assertion by the majority of citizens to ‘‘support democracy’’ is not a satisfactory indicator of the stability of a democratic political regime. Democracy is more stable when the nation’s citizens are politically participatory, when they trust in each other, are tolerant of others with ethnic and cultural differences, and embrace
post-mate-rialist values (2003, p. 51). For contemporary representative democracy, what matters is
trust in people in general rather than trust in friends and relatives.
The generalized trust that citizens obey the law is important, among other things, to create the expectation that the political group controlling the government will leave power peacefully if it loses the election, according to democratic rules. Depending on the per-sonality of citizens, trust may be unnecessary, sufficient or insufficient to lead individuals to contribute to the production of public goods. If citizens were altruistic then the unconditional cooperation for the production of public goods would occur regardless of whether they believed that others would also participate. If citizens were selfish, trust would not make them cooperate; each selfish citizen would try to freely ride on others contributions. In this case, only a society hierarchically organized—with a central power distributing selective incentives—could force the cooperation of citizens. Trust is neces-sary if citizens have an egalitarian character and are willing to cooperate if others also
collaborate.1Considering the empirical evidence that people have the propensity to punish
non cooperators (Gintis et al.2003), I suppose that egalitarians predominate in real
soci-eties, but this does not mean that altruistic attitudes always predominate. As Coleman
(1990) and Putnam (2000) argued, individuals can enter either a virtuous circle of trust and
cooperation or a vicious circle of distrust and non-cooperation.
Hence, generalized trust in the good behavior of fellow citizens is a necessary attitude for democracy. In many situations in which people rely on voluntary cooperation to achieve mutual goals, distrust can lead to the abandonment of any attempt to cooperate and therefore carries the risk of making people to lose fruitful partnerships (Lunda˚sen
2002, p. 307). Thus, depending on the estimate that one makes of the other’s
trustwor-thiness and of the benefits that will follow from the cooperative behavior, it may be rational to trust the other.
The need for trust occurs when one is not sure that the person one is dealing with will act fairly. In other words, we can say that an individual A trusts individual B when the available information on B is not enough to ensure that it would be rational for B to act in a way that A considers fair. According to Uslaner, the psychological foundations of trust are a belief that people are good, an optimism about the future in the long term and a sense of
control over the own destiny (2008, p. 733).
When one has enough information about the motivations for action and the context in which a person acts to make sure that the person will act as expected, then the better word
to apply to the situation is security rather than trust. When the uncertainty about the actions of a person is very large then the belief that the person will act fairly could more properly
be considered bet (or gullibility) than trust (Lunda˚sen 2002:306; Bulloch 2013:1292).
What can be considered trust are the intermediate cases when there is no certainty that the other will act justly and to believe that this will occur cannot be considered a highly risky bet. Emotions certainly play an important role in fair behavior. Feelings of altruism, solidarity and belonging can stimulate cooperation, fair behavior, and confidence; feelings
of guilt and fear can contribute to inhibit unjust behavior (Lunda˚sen2002).
People have a tendency to be more sympathetic to other people who they identify as belonging to their own group and thus economic equality also facilitates interpersonal trust
as it gives to people the feeling of sharing a common destiny (Uslaner 2008, p. 291). In
addition, people who trust others perhaps are partly relying on their own ability to detect
cheaters (Lunda˚sen2002, p. 311).
Confidence might be a reflection of personal experiences in which the individual makes an evaluation or judgment, even if not aware of it, of the various cases of both just behavior and breach of trust, which results in an attitude predominantly of either trust or distrust toward people in general. However, the trust may also have been learned as a moral value in the early years of life, and in this case it would be highly resistant to personal
expe-riences (Uslaner2007, p. 290).
Uslaner (2008) used data from the General Social Survey, conducted annually in the
United States, to check the impact of cultural heritage and the context on the level of confidence of individuals. On the one hand, descendants of immigrants from countries with high levels of trust would present high levels of trust if there was a cultural transmission of trust in people in general. On the other hand, people living in communities where trust is widespread would also show higher levels of confidence. The hierarchical regression model developed by Uslaner confirmed the two hypotheses: both the cultural heritage and the social context have significant impact on the confidence level of individuals.
According to Seligson and Renno´ (2000), it would be possible to distinguish at least
three dimensions of interpersonal trust. One dimension would be personalized trust in which the interviewee tells how much trust he or she has on specific persons or categories of people. Other two dimensions would be different types of generalized trust: evaluating if people are worthy of trust and self-judgment of how the interviewee trust other people. They found empirical evidence of the validity of this distinction through factor analysis of the responses to several questions about trust in a survey conducted in El Salvador in 1999
(Seligson and Renno´2000).
People may have a behavior that corresponds to the trust placed in them for fear of suffering punishment if acting differently. In this case, the societies in which political institutions—particularly the judiciary and police—work well would show higher levels of trust. In societies with well-functioning institutions, citizens and individuals notice con-sistent punishment of lawbreakers. Respondents in surveys would say that they trust most people because they would believe that these people would fear being punished if breaching the trust placed in them. The trust would not be deposited in persons, but in the institutions responsible for ensuring compliance with the law and in the positions occupied
by people (Feres Ju´nior and Eisenberg2006, p. 472). The trust is positively correlated with
income and education, which according to Feres Ju´nior and Eisenberg occurs because people with higher income and education would be the ‘‘winners in society’’ (Feres Ju´nior
and Eisenberg2006, p. 472).
According to Beugelsdijk (2006), the WVS question on trust measures trust in institutions rather than interpersonal trust. A principal components analysis with the average value of trust as measured by the WVS and various measures of performance of institutions reveals that all variables belong to the same dimension. Societies with high levels of trust have developed strong legal systems that have earned the trust of their citizens (Beugelsdijk
2006, p. 383).
To Uslaner, however, generalized trust cannot be confused with trust in institutions: generalized trust represents ‘‘a belief that other people, especially people unlike yourself, are part of your moral community’’ while trust in government is a more transient attitude that ‘‘reflects beliefs about government performance and the popularity of specific leaders’’
(Uslaner2007, pp. 290–291).
Uslaner (2007) criticizes the empirical analysis done by Beugelsdijk (2006), who would
have used too many variables for too few cases and included and excluded variables and cases without valid theoretical justification. For Uslaner, the people from a society with a high degree of confidence is more cooperative and its government less corrupt and more responsive, but, for him, this is still not the same as having better institutions
(2007, p. 294). Inglehart and Welzel also perceive a clear distinction between
interper-sonal trust and trust in institutions. They argue that trust in institutions is the confidence on hierarchical structures, ‘‘through which authorities exert power over the public’’
(2005, p. 260). The interpersonal trust would have a horizontal character because those
who trust and those whom are trusted have approximately equal power (Inglehart and
Welzel2005, p. 261).
Moise´s and Carneiro remember that modern democracy was ‘‘born from liberal dis-trust’’ in rulers; ‘‘[...] democracy implies supervision and monitoring of the exercise of
power by citizens’’ (2008, p. 14). Although democratic political institutions, with their
checks and balances, are, in a sense, the institutionalization of mistrust, they need the
confidence of citizens to work (Moise´s and Carneiro2008, p. 15). Using Latinobarometer
data from 1997, 2000 and 2001 surveys, Moise´s and Carneiro (2008, p. 26) found a
statistically significant correlation between interpersonal trust (measured by a question identical to the WVS’s one) and confidence in the institutions for Latin America as a whole.
Among the sociodemographic characteristics that have proven to be important for the confidence level of individuals are ‘‘age, sex, social class, educational level, health and
marital status’’ (Sturgis and Smith 2010, p. 85). Some studies suggest that belonging to
minority groups reduces the level of generalized trust (Lunda˚sen2002, p. 313).
Religion also has an impact on the level of trust, with more hierarchical religions (Catholicism and Islam) presenting a negative effect on generalized trust (Inglehart and
Welzel 2005, p. 71; Lunda˚sen 2002, p. 314). In most countries, Catholics have a strong
identification with people of their own group, which may reduce trust in strangers (Uslaner
2008, p. 726). The centralized hierarchy would be responsible for establishing vertical
links, undermining confidence in people in general in the same hierarchical level of the individual.
Some authors have disputed the logical consistency of the question, arguing that the response options presented are not opposed. Psychological research shows that caution and confidence belong to the same conceptual dimension to people. Also, when replying that ‘‘need to be very careful in dealing with people,’’ the respondent could be considering that most people are trustworthy but care must be taken with most or even all people because, in the case of unknown persons, one do not know beforehand who are and who are not
that respondents choose betweeen moralistic trust and strategic trust (Bulloch
2013, p. 1295).
Renno´ (2011), using data from the Americas Barometer, notes that the traditional
measure of confidence remains stable over time. The various countries covered by the survey present little change in the proportion of those who report trust on most people. The measure, therefore, could be considered reliable. Renno´, however, questions the validity of the measure. It would be better to have more than two items to compose a measure of confidence rather than relying on a single question, unable to capture the various meanings of a multidimensional concept.
According to Sturgis and Smith (2010), the question on trust can be interpreted by
respondents in two different ways: (1) as trust in people in general, without the interviewee thinking in any particular group of people, or (2) as trust in people known by the respondents. To test this hypothesis, they analyzed the answers of respondents in a British survey conducted between November 2007 and February 2008. In the survey, after a few questions about trust, among them the question used in the WVS, the respondents were asked, ‘‘who came to mind when formulating their response?’’ The result was that respondents who reported thinking about known people responded more often to trust most people. About a quarter of respondents thought on personal experiences to answer the question and they were four times more likely to say that they trust most people (Sturgis
and Smith2010, p. 89). And some differences between groups regarding the generalized
trust disappeared when controlled by questions that asked respondents to say who had they
thought of (Sturgis and Smith2010, p. 90).
Finally, we must note that, being a worldwide survey, the questionnaire has to be translated into dozens of languages, but studies show that, even in the same language, minor changes in wording of the question on trust lead to wide variation in the responses
(Lunda˚sen2002, p. 316). According to Feres Ju´nior and Eisenberg, the question on
gen-eralized trust may have a serious problem when translated from English into Neo-Latin
languages because the English wordtrustis more related with interpersonal trust while the
Latin word fides and their neo-Latin derivatives (confianc¸a in Portuguese,confianza in
Spanish, etc.) are more related with business and formal contracts (Feres Ju´nior and
Eisenberg2006, pp. 467–468).
3 Data and Results
The questionnaire used to collect the data analyzed here was available on the Internet and was filled by volunteers invited by different means: (a) contact with strangers on the streets of Fortaleza and some small neighboring cities; (b) e-mails to two types of institutions: social science departments of many Brazilian universities and secretary of education of the 184 municipalities of Ceara (a Brazilian State); (c) e-mails and Facebook messages to friends from many Brazilian states requesting them to forward the messages to their friends. From all strangers contacted in the streets, only 9 filled the questionary, and their answers will not be included in the data analysis. Also, 366 volunteers filled the first page of the questionnaire, but 30 did not answer the question on trust in most people and their lines were deleted from the dataset, resulting in an effective sample size of 327 respondents
(see Table1). Some respondents did not go beyond the first page and only 203 listed the
Because our goal was to understand what people have in mind when they answer the
question on trust in the WVS, the questionnaire replicate many questions of that survey.2
We have not included questions on trust in institutions and, thus, we cannot use the data to test the hypothesis that the interpersonal trust really is a manifestation of trust in
institutions (Feres Ju´nior and Eisenberg2006; Beugelsdijk2006). These questions were not
added to avoid increasing the size of the questionnaire and also because they are already present in the WVS whose data can be used to test the hypothesis.
Because it was a self-administered questionnaire, it would not make sense to include ‘‘Not mentioned’’ as an option of answer to multiple-choice questions. To speed up the completion of the questionnaire, we did not require respondents to click on ‘‘Yes’’ or ‘‘No’’ in these questions. Hence, all answers came from a pool of multiple choice questions which defaulted answers to a ‘‘No’’ when the answer was not selected. The meaning of ‘‘No’’ in these variables might be ‘‘Not selected’’ or ‘‘Not answered’’. The missing values were registered in these questions only when the respondent did not send the data of the last pages of the questionnaire.
In the next subsections, I will explore the relationships between trust in most people and each of the many aspects of the cognitive process of answering the question on trust that
were explored in the questionnaire. Finally, on Sect.3.10, I will add all variables that were
significant in the previous sections to logistic regression models to check what of variables, when controlled by each other, remain statistically significant for explaining respondent answers on trust.
3.1 Trust in Most People
Perhaps due to the sampling method and perhaps due to be a self administered question-naire, the proportion of respondents who stated that most people can be trusted was much higher than in previous researches using the same question. While 224 have said that they ‘‘Need to be very careful’’ in dealing with people, 103 have said that ‘‘Most people can be trusted’’. The respondents are very different from the Brazilian population in general: 28.5 % are atheists and 95.2 % have higher education while most Brazilians are religious persons and have only primary or secondary education. Hence, the results presented here focus on relations between variables that represent attitudes and opinions and not on socio-demographic explanations of these variables. As I will later argue, although we cannot generalize the results of this research for the Brazilian population as a whole, the higher education of our respondents has its own advantages.
Trust in most people was also measured by a slightly less abstract version of the WVS
question:How many people out of 10 would take advantage of you?The two variables are
highly correlated, as Fig.1shows.3
Table 1 Number of respondents
according to mode of contact Mode of contact N
E-mails to institutions 117
Facebook and e-mails to friends 210
2
The questionnaire and the collected data can be found athttp://www.lepem.ufc.br/dados/conf2013/. The questionnaire is available in two formats: HTML without the question numbers, as the respondents have seen it, and PDF, with the question numbers.
3.2 How the Question on Trust is Understood?
Respondents were asked what they had in mind when thinking aboutmost peoplewhile
answering the question about trust. It was a multiple choice question and the set of options was: people being seen for the first time, relatives, friends, colleagues, neighbors and/or known people with whom there is no friendship, and did not think in anybody. The last option was intended to avoid the respondents feeling forced to choose one of the categories of people and its results are not included in the analysis. As expected by authors who use the question as indicator of generalized trust, overall, the most remembered categories of people were known people with whom there is no friendship, people being seen for the first
time, and colleagues. However, as Fig.2shows, there is an important difference between
those who have said thatmost people can be trustand those who have said thatneed to be
very careful: friends and relatives were much more frequently in the minds of those who
answered to trust most people than in the minds of those who do not trust.
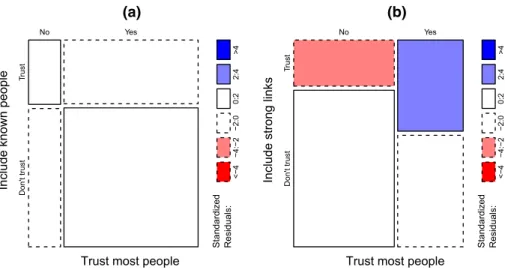
Contrary to results found by Renno´ (2011) and by Sturgis and Smith (2010), not all
people that can be considered from the respondent’s community (relatives, friends, col-leagues, neighbors and known people), when remembered as part of most people, increase
the chances of answering to trust most people. Figure3 shows that only those who
included strong links (relatives and friends) amongmost peoplehave a higher chance of
reporting to trust most people. In this mosaic plot, as in the others presented in this paper, the areas of rectangles are proportional to the number of respondents in the corresponding intersection of categories, the borders of rectangles, broken or solid, indicate, respectively, negative and positive associations, and the presence of colors indicates that the associations are statistically significant.
Figure4shows the graphical representation of a correspondence analysis. The points
representing different categories of different questions are plotted close to each other if they are usually chosen by the same respondents. The visualization of the distribution of
answers will be useful for deciding the next steps in the analysis. As we can see in Fig.4,
the answers to the question on who is most people cluster in three blocks of ‘‘Yes’’ and ‘‘No’’: (1) friends and relatives, (2) colleagues and neighbors, and (3) know people with no friendship and people seen for the first time.
We will use only the extreme blocks to build a typology of how the questionWho is the
most peopleis understood, as Fig.5shows. While building the typology, the respondents
were classified according to their inclusion of friends and relatives (close people) and/or people seen for the first time and known people with whom there is no friendship (distant
people) as part ofmost people.
Figure6confirms that the proportion of respondents who trust most people depends on
the understanding of the expressionmost people. Trust in most people is more common
among respondents who have a personal understanding of the expression than among those who have an impersonal understanding. This means that some respondents say that they trust most people not because they trust unkown people, but because they understood the expression ‘‘most people’’ as including friends and relatives.
The expressionmost peopleare not the only one understood in different ways. Table2
shows the mean value of trust according to the understading of ‘‘trust’’. Since trustis a
binary variable (Don’t trust¼0 and Trust¼1), its mean value is the proportion of those
who trust in most people. The respondents were divided by their opinion on the meaning of
trust, and this supports Renno´’s argument that data on trust have validity problems. The
expression trust. However, the association between the two variables is not statistically
significant (v2¼11,pvalue=0.093).
The proportion of respondents who trust most people also vary according to the
situ-ation imagined when answering the question on trust (Table3). Respondents who
imag-ined a stranger really helping another person were the ones who most frequently said to trust most people, but the association between the two variables is not statistically
sig-nificant (v2¼8:9,pvalue=0.18).
The questions on the meaning of trust and on situations imagined when answering the question on trust were not of multiple-choice options. Thus, I could not use techniques of factor analysis to test whether the different answers are distinct aspects of the same dimension. If the sample were larger and if it were representative of the population, we could investigate what socioeconomic profile was more associated with the different
understandings of the expressionsmost peopleandtrust.
2468
1
0
Don't trust Trust
Ho
w man
y
w
ould tak
e
adv
antage?
Fig. 1 How many would take advantage according to trust in most people
people relatives friends colleagues neighbors known Don't trust
%
02
0
4
0
6
0
people relatives friends colleagues neighbors known Trust
%
01
0
3
0
5
0
Standardiz
ed
Residuals:
<−4
−4:−2
−2:0
0:2
2:4
>4
Trust most people
Include known people
No Yes
Tr
u
s
t
Don't tr
ust
(a)
Standardiz
ed
Residuals:
<−4
−4:−2
−2:0
0:2
2:4
>4
Trust most people
Include strong links
No Yes
Tr
u
s
t
Don't tr
ust
(b)
Fig. 3 Who have you thought of when you have heard the expressionmost people?
−3 −2 −1 0 1 2 3
−0.5
0
.5
1.0
1
.5
Dim 1 (36.60%)
Dim 2 (33.16%)
rel_No rel_Yes
fri_No fri_Yes
col_No
col_Yes
nei_No
nei_Yes
per_No
per_Yes kno_No
kno_Yes
Fig. 4 Correspondence analysis: Who is most people?
Yes No Close
Distant
No Yes
Personal Comprehensive Restricted Impersonal
3.3 Frequency of Interactions
I expected that people who interact more with other people would trust more in most people. To test if this association exists, the questionnaire included questions about the
Standardiz
e
d
Residuals:
<−4
−4:−2
−2:0
0:2
2:4
>4
Trust most people
Understanding of "most people"
Restricted Impersonal Personal Compreh.
Don't tr
ust
Tr
u
s
t
Fig. 6 Trust in most people according to understanding of the expressionmost people
Table 2 Proportion of respon-dents who trust most people according to understanding of
trust
Mean N SD
To assign responsibilities 0.12 8 0.35
To share 0.46 28 0.51
To know 0.42 24 0.50
Fidelity 0.22 91 0.42
To preview 0.39 54 0.49
To feel safe 0.29 99 0.46
To have a link 0.32 19 0.48
Total 0.31 323 0.46
Table 3 Proportion of respon-dents who trust most people according to situations imagined when answering the question on
trust
Mean N SD
Friend to keep secret 0.16 31 0.37
Partner don’t betray 0.22 18 0.43
To keep promise 0.32 111 0.47
To loan things 0.00 5 0.00
Stranger really to help 0.39 90 0.49
To get you alone 0.35 31 0.49
Person to be together 0.33 40 0.47
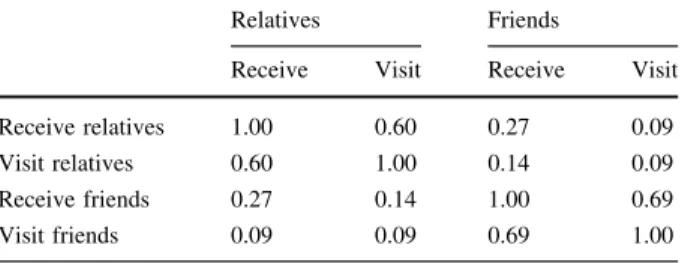
frequency of visits received and paid by the respondents. The four variables that measure the level of interaction with relatives and friends through the frequency of visits are positively correlated, but the higher correlations are between those who visit and receive
visits of relatives, and between those who visit and receive visits from friends (Table4).
Regarding the visits, the respondents might be classified according to two criteria:
absolute frequency of visits and relative frequency of visits (relativesversusfriends). The
relevancy of these dimensions are clear in the Fig.7, where the visits were recoded in three
categories: low (never and rarely), average (monthly and fortnightly), and high (weekly
and daily). The prefixes in the figure mean:RR, receive visits from relatives;RF, receive
visits from friends; VR, visit relatives, and;VF, visit friends. As we can see, in the first
dimension, the frequencies are distributed as expected, with Average between Low and High. But the second dimension reveals in one extreme respondents who have either low or high levels of interaction and in the other extreme respondents with average levels of interaction.
Interestingly, the association between visits and trust is not linear. The proportion of respondents who trust in most people is lower among those with both low and high frequency of visits. The highest proportion of respondents who trust in most people is
found among those with intermediate values for the frequency of visits (Fig.8).
In order to reduce the complexity of the data analyzed in this section, I created two indexes: index of median interaction with relatives and index of median interaction with friends. Both indexes were created by summing the occurrences of monthly and fortnightly as answers to the questions on the frequency of visits. That is, the values of the two indexes are lower for respondents who pay visits to and do not have visits from relatives and friends either very frequently or very infrequently. Both indexes are clearly correlated with
trust in most people (Tables5,6): neither misanthropes nor highly sociable people trust in
most people; people with median levels sociability do. Thepvalues of the t tests of mean
comparisons between respondents who trust and who do not trust for the two new variables were, respectively, 0.000 and 0.004.
3.4 Auto Evaluation of Cognitive Ability
Few respondents considered that their opinion about whether most people are trustworthy is a transmitted value and not the result of experience. Trust in most people is less common
among those who considered that trust (or mistrust) is something learned (v2¼4,
pvalue=0.045, Fig.9a), what might be a consequence of the recommendation frequently
made by Brazilian parents to their children to not trust strangers. However, this is only a speculation because we did not ask respondents what was taught to them.
Table 4 Spearman correlation
matrix of visit frequencies Relatives Friends
Receive Visit Receive Visit
Receive relatives 1.00 0.60 0.27 0.09
Visit relatives 0.60 1.00 0.14 0.09
Receive friends 0.27 0.14 1.00 0.69
In our sample, 24.2 % of respondents have said that they can always or almost always know when a stranger is malicious. According to the results found by Yamagishi et al. and
mentioned by Lunda˚sen (2002, p. 311), these respondents should be more prone to say that
they trust most people. However, although not statistically significant (v2¼3,
−2 −1 0 1 2 3
−0.5
0.0
0
.5
1.0
Dim 1 (24.61%)
Dim 2 (19.72%)
RR_Low
RR_Average
RR_High
VR_Low
VR_Average
VR_High
RF_Low
RF_Average
RF_High
VF_Low VF_Average
VF_High
Fig. 7 Multiple correspondence analysis of frequency of visits
Receive relatives Visit relatives
Receive friends
Nev Rar Mon For Wee Day Nev Rar Mon For Wee Day
Nev Rar Mon For Wee Day Nev Rar Mon For Wee Day Visit friends
0.0
0
.2
0.4
0
.6
0.0
0
.2
0.4
0
.6
0.0
0
.2
0.4
0
.6
0.0
0
.2
0.4
0
.6
Fig. 8 Proportion who trust most people according to frequency of visits
Table 5 Mean values of index of median interaction with relatives according to trust in most people
Mean N SD
Don’t trust 0.50 212 0.69
Trust 0.87 95 0.80
pvalue=0.4), our results are in the opposite direction (Fig.9b). Moreover, we must note that we have not objectively measured the ability of respondents to not be cheated. We have measured the respondents’ self-evaluation regarding this ability.
Table 6 Mean value of index of median interaction with friends according to trust in most people
Mean N SD
Don’t trust 0.61 220 0.79
Trust 0.91 100 0.88
Total 0.70 320 0.83
Standardiz ed Residuals: <−4 −4:−2 −2:0 0:2 2:4 > 4
Trust most people
Reason of answer
Own experience I was taught
Don't tr ust Tr u s t (a) Standardiz ed Residuals: <−4 −4:−2 −2:0 0:2 2:4 > 4
Trust most people
Recognize cheaters
Never Sometimes Alm. a.Always
Don't tr ust Tr u s t (b)
Fig. 9 Cross tabulation of trust in most people and auto evaluation of ability to recognize cheaters
Standardiz ed Residuals: <−4 −4:−2 −2:0 0:2 2:4 > 4
Trust most people
Coherence of speech
No Yes T rust Don't tr ust (a) Standardiz ed Residuals: <−4 −4:−2 −2:0 0:2 2:4 > 4
Trust most people
Form of speech
No Yes T rust Don't tr ust (b)
Almost all respondents denied that either age or dressing style influences their judgment of other people’s trustworthiness (respectively, 99.0 and 97.0 %). However, there was more variance in the answers about the ability to recognize cheaters by the consistency of what they say and by the way they talk. Respondents that think that are able to recognize
cheaters by these cues have less trust in most people (Fig.10) and the association between
trust and the self reported ability to recognize cheaters by the way they talk is only
marginally significant (v2¼3:6,pvalue=0.059).
3.5 Honesty and Trust in Honesty
In four questions, V198–V201, respondents were asked whether some situations are jus-tifiable: ‘‘claiming government benefits to which you are not entitled’’, ‘‘avoiding a fare on public transport’’, ‘‘cheating on taxes if you have a chance’’, and ‘‘someone accepting a bribe in the course of their duties’’. The respondents had to choose a value between 1 and 10 to the degree of justifiability of each situation. On average, respondents who trust most
people considered the situations less justifiable than those who do not trust (Table7).
A principal components analysis confirmed that all four variables are part of the same
dimension (Table8). No respondent has given a score of 10 for all four question, and the
highest sum of scores was 32. Taking this into account, to conduct a more parsimonious
analysis, I have built anindex of honesty,H, according to the following expression:
H¼32 V198 V199 V200 V201 ð1Þ
Questions A198–A201 asked how many people out of 10 would act as described in the same four situations. Again, respondents who do not trust most people have given higher
values as their answers (Table9) and a principal component analysis confirms that the four
evaluations made by respondents are aspects of the same dimension (Table10).
The highest sum of these four variables was 40. Following procedure similar to the
previous one, I created anindex of trust in people’s honesty,T, according to the following
expression:
T¼40 A198 A199 A200 A201 ð2Þ
The impact of the index of honesty on trust was not statistically significant (t test
pvalue=0.159), but theindex of trust in people’s honestywas (pvalue=0.000).
3.6 Perceived Reasons to be Honest
Respondents believe that people are honest for different reasons. They were asked the
following question:In general, for each 10 persons that are honest and do not try to take
Table 7 Mean and SD of the value assigned to different situations according to trust in most people
Benefit Fare Tax Suborn
Mean SD Mean SD Mean SD Mean SD
Don’t trust 2.35 2.10 3.97 2.82 3.31 2.68 1.37 1.10
advantage of others, how many do you think that act in this way because: (a) are good people; (b) would feel guilt if were unfair; (c) are worried with what other people think
about them; (d) are afraid of being punished. The first two motivations can be labeled
internal, moral or altruistic because people would be honest even if they were sure that nobody was observing them. The other two may be called external, opportunistic or selfish because people with these motivations would be honest only when under the risk of being
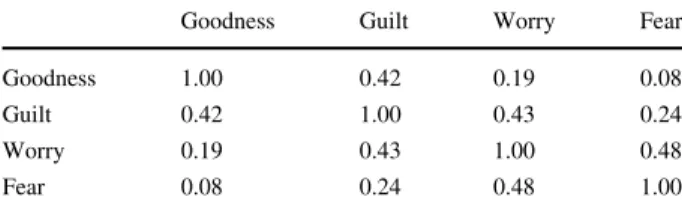
observed by other people. Table11shows that the correlation between the two motivations
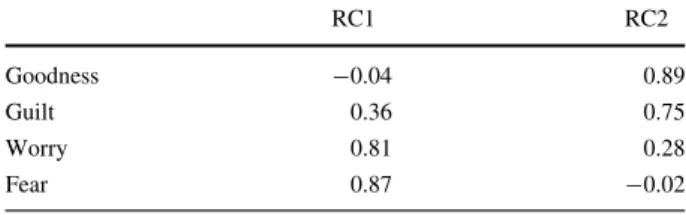
that can be considered internal ones (goodness and feeling of guilt) and the two that can be considered external ones (worrying about reputation and fear of punishment) are both high. There is also a relatively high correlation between guilty and reputation, but a principal component analysis confirms that the perception of internal and external motivations
constitute different dimensions (Table12).
Table 8 Principal components analysis of situations related to honesty
Cronbach’sa¼0:55
PC1
V198 0.62
V199 0.69
V200 0.75
V201 0.58
Table 9 Mean and SD of number of people who would involve themselves in diverse situations according to trust in most people
Benefit Fare Tax Suborn
Mean SD Mean SD Mean SD Mean SD
Don’t trust 6.07 2.37 5.82 2.72 7.31 2.43 5.62 2.31
Trust 4.90 2.55 4.63 2.62 6.31 2.49 4.73 2.49
Table 10 Principal components analysis of the perceived propensity to honesty
Cronbach’sa¼0:82
PC1
A198 0.85
A199 0.82
A200 0.80
A201 0.76
Table 11 Spearman correlation
matrix of reasons to be just Goodness Guilt Worry Fear
Goodness 1.00 0.42 0.19 0.08
Guilt 0.42 1.00 0.43 0.24
Worry 0.19 0.43 1.00 0.48
However, although the correlations between different opinions about the motivations to fair action are interesting, there is no clear correlation between these opinions and trust in
most people: the highest correlation, between fear and trust, haspvalue=0.106.
3.7 Types of Trusters
The purpose of this section is to analyze the answers to the question on trust on different types of people (people in general, relatives, neighbors, people seen for the first time, from other religions and from other countries) to build a typology of people who trust others. I
recoded the variables, classifying the categoriesdon’t trust at allanddon’t trust very much
asDon’t trust and the categoriesTrust somewhatandTrust completelyasTrust. A high
proportion of respondents have said to trust completely their relatives. Hence, for this
variable the categoryTrust somewhatwas also included in theDon’t trustcategory.
As shown by Fig.11, in the dimension with higher explanatory power, respondents are
split in two types: those who trust and those who do not trust. In the second dimension, it is possible to note an opposition between those who trust relatives and neighbors and those who trust people from other religions, strangers and people from other countries. People in general and known people are in intermediate positions. A question on friends is missing in this WVS battery of questions.
Guided by the information present in Fig.11, I used only two variables to build a
typology of trust: trust in relatives and trust in people in general, according to Fig.12.
The results are that familist respondents reach almost as low levels of trust in most people as pessimist ones and civic respondents have almost as high levels of trust as
optimistic ones (Table13), which corroborate the hypothesis that the WVS question on
trust indeed measure generalized interpersonal trust.
Figure13shows the relation between the type of truster and trust in most people and
confirms the existence of a statistically significant association between the two variables.
3.8 Expectation of Help from Family, Friends and People in General
In three multiple choice questions, respondents were asked who among their relatives, friends and known people would help in time and money in case of health problem and would lend money in case of financial problem. Each question has 19 possible choices. To summarize the information, I created four variables that sum the occurrences of ‘‘Yes’’ in these questions. The new variables were the sums of ‘‘Yes’’ to: close relatives, distant relatives, friends and people in general. I considered mother, father, siblings, children, spouse, grandparents, and grandchildren as close relatives; the other types of relatives were considered distant ones; only friends were considered friends; the variables counted as people in general were colleagues, known people, persons seen for the first time and
neighbors. Table14 shows a summary of the results. Interestingly, more respondents
Table 12 Principal component
analysis of reasons to be just RC1 RC2
Goodness -0.04 0.89
Guilt 0.36 0.75
Worry 0.81 0.28
answered that would receive help from friends than from all categories of people that I classified as close relatives as a whole. The explanation for this result is that most respondents did not choose options that did not apply to them. For example, from 250
−1.0 −0.5 0.0 0.5 1.0 1.5
−1.0
−0.5
0.0
0
.5
1.0
Dim 1 (40.63%)
Dim 2 (15.62%)
Ppl_Don't trust Ppl_Trust
Rlt_Don't trust Rlt_Trust
Nb_Don't trust Nb_Trust
Knw_Don't trust
Knw_Trust
Unkn_Don't trust
Unkn_Trust
Rlg_Don't trust
Rlg_Trust
Cntr_Don't trust
Cntr_Trust
Fig. 11 Correspondence analysis: trust in different kinds of people
Yes No
Relatives
People in general
No Yes
Familist Optimistic Pessimist Civic
Fig. 12 Typology of trust according to the combination of trust in relatives and trust in people in general
Table 13 Proportion of respon-dents who trust most people by type of truster
Mean N SD
Pessimist 0.07 86 0.26
Familist 0.14 51 0.35
Civic 0.43 77 0.50
Optimistic 0.51 103 0.50
Standardiz
ed
Residuals:
<−4
−4:−2
−2:0
0:2
2:4
>4
Trust most people
T
ype of tr
uster
Pessimist Familist Civic Optimistic
Don't tr
ust
Tr
u
s
t
Fig. 13 Trust in most people according to type of truster
Table 14 Proportion of ‘‘Yes’’
according to category of people Category Proportion
People in general 0.04
Friends 0.60
Distant relatives 0.13
Close relatives 0.42
01234567
Pessimist Familist Civic Optimistic Yes to people in general
0.0
1
.0
2.0
3
.0
Pessimist Familist Civic Optimistic Yes to friends
05
1
0
1
5
Pessimist Familist Civic Optimistic Yes to distant relatives
0
5
10
15
20
Pessimist Familist Civic Optimistic Yes to close relatives
respondents who answered the question on the number of children, 61 have children and 189 have not. Among those who have children, the proportion of ‘‘Yes’’ for children was 0.66 while among those who do not have children the proportion was 0.11.
Figure14shows the distributions of sums of ‘‘Yes’’ grouped by types of trust created in
the previous section and Fig.15 shows the same distributions grouped by trust in most
people.
The most significant result is the relatively high proportion of civics that believe that they would receive help from people in general.
In general, the respondents who answered ‘‘yes’’ to more options trust most people more
than those who answered ‘‘no’’ more frequently. Looking at Fig.15we can see that there
are slightly more people answering ‘‘yes’’ among those who also have said to trust most people. Mean comparisons of the sums of ‘‘yes’’ between those who trust and those who do
not trust most people are statistically significant for the four variables. Thepvalue ofttests
are 0.031 for close relatives, 0.019 for distant relatives, 0.001 for friends, and 0.011 for people in general.
3.9 Personal Social Networks
In Sect.3.3, we have evaluated the frequency of interactions of respondents with other
people. The goal was to achieve a better understanding of the social context that makes people to trust others. Social network metrics are alternative measures of the nature of interactions which involve the respondent and may also be helpful to explain the
mani-festation of trust. Table15 shows the result of a logistic regression with trust in most
people as the dependent variable and some metrics of respondents’ personal social
01234567
Don't trust Trust Yes to people in general
0.0
1
.0
2.0
3
.0
Don't trust Trust Yes to friends
05
1
0
1
5
Don't trust Trust Yes to distant relatives
0
5
10
15
20
Don't trust Trust Yes to close relatives
networks as independent variables. The impact of the cluster coefficient on trust was the most dependent on the network size and it was added to the model in interaction with the number of people in the social network.
Only the number of people and the cluster coefficient were statistically significant: the bigger the number of people in the social network and the more these people are inter-connected, not forming distinct groups in the network, the higher is the respondent’s trust
in most people (pvalue\0.05).
3.10 Summary of Results
Table16presents models of logistic regression with trust in most people as the dependent
variable. Model 1 includes only the variables explored in the previous sections that have had significant association with trust, except for network metrics due to high number of missing values. Due to the small sample size, more than prudent, it is obligatory to build parsimonious models. Thus, Model 2 keeps only the variables that were more statistically significant in Models 1. Finally, Model 3 includes the social network variables that were statistically significant in the previous section.
The most consistently significant variables were the type of truster (civics and optimists trust more), and this result corroborates the hypothesis that the question WVS on trust measures generalized trust. Trusting people’s honesty increase the trust in most people, and the reason for cynicism is also significant (respondents who admit that they do not trust most people because were taught to do so have lower levels of trust in most people). The indexes of median level of interaction with and the belief that specific categories of people
would help in financial and health problems (sums of ‘‘Yes’’), and the meaning of most
peoplewere not significant when controlled by the other variables. From the social network
variables, the number of people in the personal network in interaction with the number of cluster was significant.
4 Discussion of Results
The sample was not representative of Brazilian population: the respondents are from only a few cities, almost none of them have low level of education, many of them are from the social science and the sample was small. Hence, the results cannot be used to describe the Table 15 Summary of logistic regression: trust in most people as dependent variable
Estimate SE z value Pr([|z|)
(Intercept) -0.62 1.02 -0.61 0.54
Number of people 0.16 0.07 2.38 0.02
Proportion of relatives -0.35 0.79 -0.45 0.66
Density 1.18 1.15 1.03 0.30
Transitivity -1.33 0.81 -1.65 0.10
Reciprocity -0.44 0.95 -0.46 0.64
Cluster coefficient: N. people -0.05 0.02 -2.46 0.01
Brazilian population. The investigation must be seen as exploratory and the data can be used only to investigate the correlations between variables in the sample.
The fact that the sample is constituted mainly of people with higher education have the advantage of assuring a more consistent understanding of the questions, and this is Table 16 Logistic regression analysis with trust in most people as dependent variable
Model 1 Model 2 Model 3
(Intercept) -5.35***
(1.00)
-3.79***
(0.65)
-3.54***
(0.79) Type of truster (familist) 1.46
(0.84)
1.12 (0.72)
0.48 (0.89)
Type of truster (civic) 2.92***
(0.69)
2.76*** (0.58)
2.35*** (0.64) Type of truster (optimistic) 2.95***
(0.67)
2.82*** (0.57)
2.20*** (0.62) Index of trust in people’s honesty 0.06**
(0.02)
0.06** (0.02)
0.06** (0.03) Reason for not trusting (I was taught) -1.33*
(0.58)
-1.41**
(0.53)
-1.24*
(0.62) Index of median interaction with friends 0.41
(0.21) Index of median interaction with relatives 0.22
(0.23) Meaning of most people (impersonal) -0.67
(0.51) Meaning of most people (personal) 0.98
(0.57) Meaning of most people (comprehensive) 0.35
(0.54) Sum of ‘‘Yes’’ to people in general 0.17
(0.19) Sum of ‘‘Yes’’ to friends 0.21
(0.18) Sum of ‘‘Yes’’ to close relatives 0.04
(0.05) Sum of ‘‘Yes’’ to distant relatives -0.01
(0.07)
Number of people in social network 0.11
(0.06)
Number of people: cluster coefficient -0.05*
(0.02) AIC 241.58 294.81 273.64 295.35 176.59 201.39 BIC
Log Likelihood -105.79 -130.82 -80.30
Deviance 211.58 261.64 160.59
Num. obs. 257 275 164
particularly important in this investigation on the meaning of a question. I have noted that Brazilians of low education level have difficult to deal with closed options and to adapt to a situation that has one person asking all questions and the other only answering them. Only people with many schooling years are well trained in this type of ‘‘conversation’’.
The results support the arguments that the WVS question on generalized trust has validity problems. Respondents who have friends and relatives in mind when thinking about most people have higher probability of saying that most people can be trusted. The expression trust was also understood with diverse meanings. These two factors mean that there is a considerable risk that the WVS is collecting different information from different people. The questions used to measure the intensity of respondents’ social interactions— the frequency of visits to and from friends and relatives—revealed an interesting feature: respondents with median levels of interaction have higher levels of trust in most people than respondents with either low or high levels of interaction. According to Coleman’s theory of social capital, people with low social interaction have less opportunity to develop relations of trust and this might be the explanation for the low level of trust of people who
both visit and is visited infrequently (Coleman 1990). A complimentary hypothesis, not
tested here, is that people with high frequency of interactions with friends and relative are more dependent on these strong links and, consequently, are more cynical about unknown people.
There was no significant correlation between trust and the opinion on how justifiable are some non civic situations (claiming undeserved government benefits, avoiding a fare in public transport, cheating on taxes, and accepting bribes). However, there is a negative and significant correlation between trust and the estimation of how many people would act dishonestly. These results are consistent with the interpretation of the question on trust as an adequate measure of trust that most people will act in civic ways. That is, in this case, the data indicate that the WVS measure of trust is valid. The fact that civic respondents tend to trust most people also corroborates the hypothesis that the question is adequate to measure generalized interpersonal trust.
In this investigation, respondents who believe that can recognize cheaters have a lower propensity to trust most people than respondents that do not believe to have this ability. Our data do not allow knowing whether the respondents that see themselves as astute really are perspicacious or are just naive enough about their own ability to interpret what is in the mind of other people.
The WVS question on trust is a single binary item. While this has the advantages of being easier to be answered by people with very low education, and also of forcing respondents to make a choice, a Likert scale would allow a more nuanced comparison of
respondents. Leung (2011) shows that 11-item Likert scales are easy enough to understand
and may produce results close to a normal distribution.
5 Conclusion
In this investigation, we have found correlations between trust in most people and other
variables that are useful to clarify the meaning of bothtrustandmost peoplefor
evidence of this research indicates that the question on trust, although problematic, mea-sures generalized more than personalistic trust: the highest correlation of trust in the regression models were with the Civic and Optimist types of truster.
It is possible to think in improvements in the questionnaire. For example, on the one hand, the question on who the respondent had in mind when thinking on most people, instead of being of multiple choice, could have forced the respondent to choose only one category of people. On the other hand, both the question about the meaning of trust and the question asking the respondent to choose the concrete situation that was closer to what he or she have thought when answering the question on trust, could have allowed multiple choices to make it easier to find latent variables that would reveal how the many answers could be grouped in few dimensions. With a sample large enough, we could create two versions of the questionnaire to try both approaches in the same survey.
The literature on trust warns us that one person trust another in relation to something. It is difficult to imagine practical situations involving trust that are present in the life of most respondents and, then, develop a battery of questions that give opportunity to all respon-dents to see themselves in some of the situations. Our goal with the questions about help in cases of health and financial problems do not seem to have been well succeeded in this task, for their correlations with the question on trust were not statistically significant in the regression models. It would be necessary to develop other questions to either complement or replace our questions to successfully capture variation in trust in concrete situations.
It is also important to ask a question about what was taught regarding trust, and the questions on this issue should be reorganized. One possibility to be tested is:
• Have your parents or other adult that have raised you taught you something about trust?
What did they teach you?
( ) We have to give to people the opportunity of proving that they deserve to be trusted. ( ) We should never trust unknown people.
( ) They did not teach me anything about trusting strangers.
• You have answered that [most people can be trusted / we cannot be too careful]. The
main reason for your answer was: ( ) My own personal experience.
( ) Because that was what my parents taught to me.
If be taught to not trust is specific to some cultures, like the Brazilian one, and if this variable is negatively correlated with interpersonal trust in other countries that have low levels of generalized trust, the WVS question might be measuring an opinion that is less representative of practical cynical actions than it was supposed to be.
Differences in understanding of the question certainly happen all around the World and, thus, the results of this investigation, although not conclusive, are of interest to all researchers who use M. Rosenberg’s question to investigate interpersonal trust. However, only conducting investigations similar to this one in different linguistic and cultural contexts would it be possible to know whether the variation in understanding of the question that we have found in this research is specific to respondents who speak Brazilian Portuguese (or other Neo-Latin languages) or is independent of the respondent’s language.
References
Almeida, A. C., Schroeder, A., & Cheibub, Z. (2002). PESB: Pesquisa Social Brasileira. InConsrcio de Informaes Sociais. Rio de Janeiro: Universidade Federal Fluminense. [Dataset].
Beugelsdijk, S. (2006). A note on the theory and measurement of trust in explaining differences in economic growth.Cambridge Journal of Economics,30, 371–387.
Borsboom, D., Mellenbergh, G. J., & van Heerden, J. (2004). The concept of validity.Psychological Review,
111(4), 1061–1071.
Bulloch, S. (2013). Seeking construct validity in interpersonal trust research: A proposal on linking theory and survey measures.Social Indicators Research,113(3), 1289–1310.
Coleman, J. S. (1990).Foundations of social theory. Cambridge: Harvard University Press. Elster, J. (1994).Peas e engrenagens das ciłncias sociais. Rio de Janeiro: Relume-Dumar. [1989]. Feres Ju´nior, J., & Eisenberg, J. (2006). Dormindo com o inimigo: Uma crtica ao conceito de confiana.
Dados—Revista de Ciłncias Sociais,49(3), 457–481.
Gintis, H., Bowles, S., Boyd, R., & Fehr, E. (2003). Explaining altruistic behavior in humans.Evolution and Human Behavior,24, 153–172.
Ina´cio, M., & Arau´jo, P. M. (2007). Engajamento cvico, confiana e background social. In N. Aguiar (Ed.),
Desigualdades sociais, redes de sociabilidade e participao poltica(pp. 229–240). Belo Horizonte: Editora UFMG.
Inglehart, R. (2003). How solid is mass support for democracy—And how can we measure it?Political Science and Politics,36, 51–57.
Inglehart, R., & Welzel, C. (2005).Modernization, cultural change, and democracy: The human develop-ment sequence. New York: Cambridge University Press.
Leung, S. O. (2011). A comparison of psychometric properties and normality in 4-, 5-, 6-, and 11-point likert scales.Journal of Social Service Research,37(4), 412–421.
Leung, S. O., & Xu, M. L. (2013). Single-item measures for subjective academic performance, self-esteem, and socioeconomic status.Journal of Social Service Research,39(4), 1–10.
Lunda˚sen, S. (2002). Podemos confiar nas medidas de confiana?Opinio Pblica,8(2), 304–327.
Moise´s, J. A., & Carneiro, G. P. (2008). Democracia, desconfiana poltica e insatisfao com o regime: O caso do Brasil.Opinio Pblica,14(1), 1–42.
Putnam, R. D. (2000).Comunidade e democracia: A experiłncia da Itlia moderna(2nd ed.). Rio de Janeiro: Editora FGV. [1993].
Reis, B. P. W. (2003). Capital social e confiana: questes de teoria e mtodo.Revista de Sociologia e Poltica,
11(21), 35–49.http://www.scielo.br/scielo.php?script=sci_issues&pid=0104-4478&lng=en&nrm=iso Renno´, L. (2011). Validade e confiabilidade das medidas de confiana interpessoal: O Barmetro das Amricas.
Dados—Revista de Ciłncias Sociais,54(3), 391–428.
Rosenberg, M. (1956). Misanthropy and political ideology.American Sociological Review,21(6), 690–695. Seligson, M. A., & Renno´, L. R. (2000). Mensurando confiana interpessoal: Notas acerca de um conceito
multidimensional.Dados—Revista de Ciłncias Sociais,43(4), 783–803.
Sturgis, P., & Smith, P. (2010). Assessing the validity of generalized trust questions: What kind of trust are we measuring?International Journal of Public Opinion Research,22(1), 74–92.
Torpe, L., & Lolle, H. (2011). Identifying social trust in cross-country analysis: Do we really measure the same?Social Indicators Research,103(3), 481–500.
Uslaner, E. M. (2007). The foundations of trust: Macro and micro.Cambridge Journal of Economics,32(2), 289–294.