www.atmos-chem-phys.net/10/9295/2010/ doi:10.5194/acp-10-9295-2010
© Author(s) 2010. CC Attribution 3.0 License.
Chemistry
and Physics
On the impacts of phytoplankton-derived organic matter on the
properties of the primary marine aerosol – Part 1: Source fluxes
E. Fuentes1, H. Coe1, D. Green2, G. de Leeuw3,4,5, and G. McFiggans1
1Centre for Atmospheric Sciences, School of Earth, Atmospheric and Environmental Sciences, Manchester M13 9PL, UK 2Scottish Association for Marine Science, Oban, UK
3Finnish Meteorological Institute, Climate Change Unit, Helsinki, Finland 4University of Helsinki, Department of Physics, Helsinki, Finland 5TNO, Environment, Health and Safety, Utrecht, The Netherlands
Received: 15 March 2010 – Published in Atmos. Chem. Phys. Discuss.: 8 June 2010 Revised: 24 September 2010 – Accepted: 29 September 2010 – Published: 1 October 2010
Abstract. The effect of biogenic dissolved and colloidal
or-ganic matter on the production of submicron primary sea-spray aerosol was investigated via the simulation of bubble bursting in seawater enriched with phytoplankton-released organics.
Seawater samples collected along a transect off the West African coast during the RHaMBLe cruise (RRS Discovery cruise D319), conducted as part of the SOLAS UK program, were analysed in order to identify the dominant oceanic al-gal species in a region of high biological activity. Cultures of microalgal strains representative of the species found in the collected seawater were grown in order to produce nat-ural bioexudate. Colloidal plus dissolved organic fraction in this material remaining after<0.2 µm filtration was em-ployed to prepare organic-enriched seawater proxies for the laboratory production of marine aerosol using a plunging-waterjet system as an aerosol generator. Submicron size dis-tributions of aerosols generated from different organic mono-layers and seawater proxies enriched with biogenic exudate were measured and compared with blanks performed with artificial seawater devoid of marine organics. A shift of the aerosol submicron size distribution toward smaller sizes and an increase in the production of particles with dry diame-ter (Dp0)<100 nm was repeatedly observed with increasing amounts of diatomaceous bioexudate in the seawater prox-ies used for aerosol generation. The effect was found to be sensitive to the organic carbon concentration in
seawa-Correspondence to:G. McFiggans
ter and the algal exudate type. Diatomaceous exudate with organic carbon concentration (OC<0.2µm)>175 µM was re-quired to observe a significant impact on the size distribu-tion, which implies that effects are expected to be substantial only in high biological activity areas abundant with diatom algal populations. The laboratory findings were in agreement with analogous bubble-bursting experiments conducted with unfiltered oceanic seawater collected during the RHaMBLe cruise, which revealed a higher production of particles with
Dp0<100 nm at regions with high biological activity. These findings suggest that the increase in the atmospheric aerosol modal sizes from winter to summer, reported by long-term observations in North Atlantic waters, is not directly due to an impact of the higher primary organic matter production occurring during warm periods.
1 Introduction
The marine aerosol constitutes an important fraction of the global natural aerosol flux. As a consequence, it signif-icantly contributes to the Earth’s radiative budget, atmo-spheric albedo and biogeochemical processes (O’Dowd et al., 2004; O’Dowd and de Leeuw, 2007). Marine aerosols can affect the atmospheric radiative balance both directly by scattering and absorbing solar radiation and indirectly by modifying the microphysics, radiative properties, and life-time of clouds (Murphy et al., 1998). It has been postulated that the sea-spray production would be involved in a cloud-climate feedback process if the increment of wind speed as a result of global warming on oceanic regions would lead to an increase in the sea-spray particle production (Latham and Smith, 1990).
Sea spray primary particles are produced as a result of breaking wave processes occurring on oceans surfaces. Wind generated waves breaking at wind speeds higher than 4 ms−1 produce sea-spray droplets with sizes from ≤0.01 µm to ≥25 µm (Clarke et al., 2006; Lewis and Schwartz, 2004). Breaking waves dissipate up to 40% of their energy and up to 50% of the energy loss is expended in entraining air in the water bulk and creating a dense plume of bubbles (Rapp and Melville, 1990). The bubbles formed rise and burst upon reaching the surface, thereby producing the so-called film and jet drops. The sea spray total number concentration is normally dominated by particles in the submicron size range from 5 to 300 nm, with a decline in the particle number with increasing size (Fitzgerald, 1991).
Atmospheric marine aerosols consist of primary aerosol, which comprises organic material and sea-salt and is pro-duced on the ocean surface by bubble-bursting and tearing from breaking waves (Anguelova and Webster, 1999), and secondary aerosol, formed by non sea-salt sulphate and or-ganic species originated via gas-to-particle conversion pro-cesses such as homogeneous nucleation and condensation onto pre-existing particles (O’Dowd et al., 1997). Chemi-cal analysis of atmospheric sea-spray particles collected in field experiments has provided evidence for the presence of significant concentrations of organic matter in the submicron size range (Hoffman and Duce, 1977; Novakov et al., 1997; Middlebrook et al., 1998; Putaud et al., 2000; Cavalli et al., 2004). The contribution of the organic fraction in the ma-rine aerosol has been found to be seasonal, accounting for up to 63% of the submicrometre aerosol dry mass, with an in-creasing enrichment with dein-creasing particle size (O’Dowd et al., 2004; Yoon et al., 2007). Studies on North East At-lantic marine aerosol conducted over long periods (O’Dowd et al., 2004; Yoon et al., 2007) have shown that the shape of the submicron sea spray distribution presents a seasonal pat-tern, characterized by an increase of the accumulation and Aitken modes modal sizes from winter to summer. Although this finding has been attributed to an effect produced by
pri-mary organic matter released by marine biota (O’Dowd et al., 2004) little is known on the influence of these organics on the production and the behaviour of the marine aerosol.
Bubble bursting experiments with seawater have shown high organic mass fractions in the primary aerosol submicron size region (Keene et al., 2007; Facchini et al., 2008). The submicron organic matter was found to be almost entirely water insoluble and consisted of colloids and aggregates ex-uded by phytoplankton (Facchini et al., 2008). The distribu-tion of the insoluble organic matter and sea-salt content in the submicron size range observed in bubble bursting exper-iments was similar to that measured in atmospheric marine aerosol samples collected during periods of high biological activity (O’Dowd et al., 2004; Facchini et al., 2008).
Under breaking wave conditions, the primary mechanism of transport of biological surfactants to the ocean surface is by bubble scavenging. When the bubbles reach the water sur-face, the organics absorbed on their surface are ejected into the atmosphere along with dissolved inorganic constituents of seawater. Thereby, the seawater composition, bubble spec-trum, bubble hydrodynamics and the formation and chemical composition of the aerosol are closely interrelated and inter-dependent (Duce and Hoffman, 1976; Tseng et al., 1992).
of primary marine organic matter would be more appropriate for these type of studies.
Another important aspect for laboratory studies on sea-spray aerosol is the reproduction of the real process through which marine particles are generated (Fuentes et al., 2010). It is a common practice to use atomizers for the generation of laboratory marine aerosol proxies from seawater samples (McNeill et al., 2006; Abo Riziq et al., 2007; Saul et al., 2006; Svenningsson et al., 2006; Braban et al., 2007; Nie-dermeier et al., 2007; Taketani et al., 2009), while only in a few studies has the aerosol been produced by bubble burst-ing via aeration through glass frits or diffusers (Cloke et al., 1991; M˚artensson et al., 2003; Keene et al., 2007; Tyree et al., 2007; Wise et al., 2009) or using water jets (Cipriano and Blanchard, 1981; Sellegri et al., 2006; Facchini et al., 2008; Hultin et al., 2009). Comparative analysis on the per-formance of different aerosol generators has shown that the mechanism of particle production can affect the particle size distribution and the behaviour of the laboratory-generated marine aerosol (Fuentes et al., 2010). The spectrum of bub-bles generated by water impingement with plunging water jet generators has been shown to resemble the oceanic bub-ble spectrum shape (Sellegri et al., 2006; Hultin et al., 2009; Fuentes et al., 2010). It is expected that this type of system, which simulate the physics of bubble formation by water im-pingement, is able to produce particles more representative of the primary marine aerosol than other available generation systems (Fuentes et al., 2010).
Estimates of sea-spray source fluxes have frequently used the function derived by Monahan et al. (1986), which al-though derived and defined for the 0.8–10 µm dry diame-ter range, is usually also applied to the submicron size re-gion. In an attempt to provide more reliable source functions in the submicron range, size-resolved parameterisations de-rived from field and laboratory measurements have recently been proposed (M˚artensson et al., 2003; Clarke et al., 2006; Tyree et al., 2007). Formulations of net and source fluxes as a function of the wind speed in the submicron range have been derived from eddy covariance aerosol flux measure-ments by Nilsson et al. (2001) and Geever et al. (2005) in Artic and North Atlantic waters, respectively. Due to the lack of understanding on the effect of organics of biogenic origin on the production of sea-spray, this factor has not generally been included in the definition of marine aerosol fluxes. To address this gap, recently, O’Dowd et al. (2008) developed an inorganic-organic submicron sea-spray source function based on the parameterisation of the particles organic frac-tion as a funcfrac-tion of the seawater chlorophyll-a concentra-tion obtained from satellite images. In their approach, the de-rived fractional composition as a function of the
chlorophyll-afield was integrated into a power-law number flux function derived from data of Geever et al. (2005), while the sea-spray diameter seasonal variation was determined from Yoon et al. (2007). In addition to this approach, Ceburnis et al. (2008) presented net seaspray flux data as a function of the wind
speed, including organic compounds in their analysis. Photographic observation of bursting bubbles has shown that the bubble-bursting process can be significantly altered by the addition of surfactants, which particularly affects the height and width of the bursting jet formed and the number and size of drops released (Boulton-Stone, 1995; Dey et al., 1997). Considering these effects, it is reasonable to assume that the presence of surface-active matter released by biota in seawater might have an effect on the primary aerosol pro-duction through the impact of these natural surfactants on the bubble-bursting process.
This study aims to elucidate the extent to which the or-ganics produced by marine phytoplankton can affect the par-ticle size distribution and the production of primary marine aerosol. Seawater samples were collected along a transect off the West African coast during the UK SOLAS funded Reactive Halogens in the Marine Boundary Layer (RHaM-BLe) cruise in order to identify the main algal species in a region of high biological activity. Cultures of microalgal strains representative of species found in the collected sea-water were grown in order to produce natural bioexudate. This material was used to prepare organic-enriched seawater proxies for the laboratory production of marine aerosol using a plunging-waterjet system as the aerosol generator. Mea-surements of the size distribution of the aerosols generated from seawater proxies enriched with algal exudate were con-ducted and compared with blanks performed with artificial seawater devoid of marine surfactants. A novel size-resolved source flux function including a term to account for the sea-water organic concentration was derived from the size distri-bution measurements by applying the whitecap method. The total source flux inferred from the presented parameterisation was compared to recent definitions of sea-spray source fluxes based on laboratory and field observations in the literature.
2 Algal species in high biological activity regions:
RHaMBLe cruise
Seawater samples were collected along a transect off the West African coast on board the British research vessel RRS Discovery (D319, RHaMBLe cruise), conducted as part of the SOLAS UK program (Lee et al., 2010), in order to iden-tify the dominant oceanic algal species in the high biological activity region located at the vicinity of Cape Verde islands. The cruise mobilised from Lisbon (Portugal) on 19 May and docked in Falmouth (UK) on 11 June 2007.
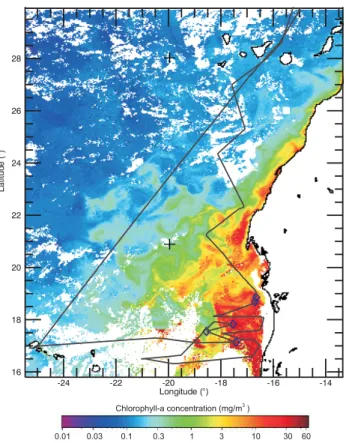
Fig. 1.RHaMBLe cruise track off the West coast of Africa overlaid on satellite chlorophyll image (SeaWiffs Ocean Color data) aver-aged over the cruise period on May–June 2007. Blue marks indi-cate the points at which seawater samples were collected for algal species identification.
system, which provided seawater to the on-board collection points.
2.1 Methods
2.1.1 Seawater collection and pre-treatment
The collected samples were analysed for chlorophyll-a, or-ganic carbon content and taxonomic identification of the main algal species. For chlorophyll-a analysis, seawater samples of 600-3000 mL were filtered through a 25 mm di-ameter glass fiber filter (GF/F Whatman), which was im-mediately stored at a temperature below−20◦C. For algal identification seawater samples were split into two 500 mL brown polypropylene bottles. In order to preserve the al-gal specimens the samples were fixed with Lugol’s iodine (for diatom and dinoflagellates preservation) and Glutaralde-hyde solution (for cyanobacteria, bacteria and nanoplankton preservation) to final concentrations of 1%, and stored at 4– 8◦C in the dark.
2.1.2 Seawater analysis methods
For analysis of the organic carbon content, the cell biomass was removed by filtration through pre-combusted (450◦C for 8 h) glass fiber filters (GF/F; Whatman) and subsequently through deionised-water rinsed and sterile polycarbonate fil-ters (0.2 µm; Millipore). The seawater samples were aspi-rated from the filtrate using acid-washed glass pipettes to pre-combusted glass ampules or autosampler bottles and acidi-fied with orthophosphoric acid and stored in the dark at 4◦C until analysis. Organic carbon analyses were conducted as per standard procedures on a Shimadzu TOC-V CPH/CPN instrument (Alvarez-Salgado and Miller, 1998).
Chlorophyll-a was extracted using 90% acetone and the concentration determined by fluorometry using a Turner De-signs Trilogy fluorometer, as per standard procedures (Par-sons et al., 1984). A calibration curve was run alongside of these measurements and the fluorescence from the unknown samples was extrapolated from the standard curve. The raw chlorophyll-aconcentrations were corrected for the volume of sample filtered.
Bacteria, cyanobacteria, heterotrophic- and photosynthetic-nanoflagellates were enumerated and classified into broad groups by filtering between 5–15 mL of the glutaraldehyde fixed sample. The filters were stained as appropriate, and up to 50 fields of view were counted by epifluorescence microscopy. Counts were back calculated to give the abundance of each cell type per litre. Diatom and dinoflagellates species fixed in Lugol’s iodine were enumerated by settling 50 mL of the sample and counting a range of fields of view (dependent on cell density). Counts were back-calibrated based on the number of fields of view and the volume filtered to give an abundance of each cell type per litre.
2.2 Results of RHaMBLe seawater samples analysis
Figures 2–5 show a summary of the results from the chlorophyll-aand algal identification analysis conducted on the seawater collected during the RHaMBLe cruise. Results in Fig. 2 and Table 1 indicate that the phytoplankton popula-tion in the region was very high, with nanoflagellates (HNAN and PNAN) as the dominant group, followed by diatoms and dinoflagellates, respectively. The high biological activity in the area is also indicated by the chlorophyll-aconcentration in seawater. Table 1 presents a summary of the properties of the seawater samples collected during the cruise. Fig-ure 2 (right) indicates that the chlorophyll-a concentration correlates with increased numbers of PNAN, diatoms and di-noflagellates cells, while the cyanobacteria and HNAN pop-ulations decrease with increasing chlorophyll-a.
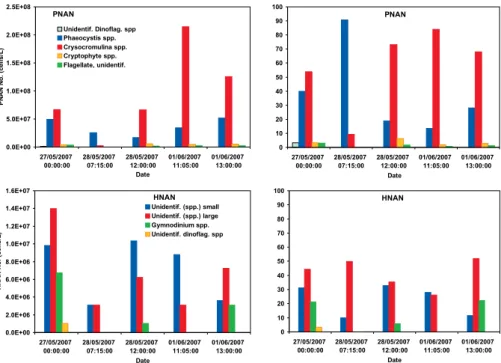
The abundant nanoflagellate group (Fig. 3) is domi-nated by photosynthetic nanoplankton (PNAN), in which
Chrysochromulina spp. and Phaeocystis spp. are the
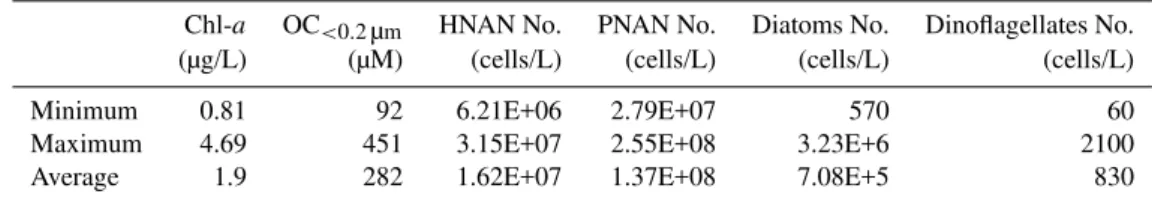
Table 1.Summary of chlorophyll-a, OC<0.2µmconcentration and cell count analysis of oceanic seawater collected during the RHaMBLe cruise in the high biological activity region near Cape Verde Islands (May–June 2007).
Chl-a OC<0.2µm HNAN No. PNAN No. Diatoms No. Dinoflagellates No. (µg/L) (µM) (cells/L) (cells/L) (cells/L) (cells/L)
Minimum 0.81 92 6.21E+06 2.79E+07 570 60
Maximum 4.69 451 3.15E+07 2.55E+08 3.23E+6 2100
Average 1.9 282 1.62E+07 1.37E+08 7.08E+5 830
dinoflagellate taxa (19 species and 16 species, respectively) were identified in the collected waters (Figs. 4 and 5). Nor-malization of the total cell counts (Fig. 4, right) indicates that the dominant strain in the diatom population is the
Tha-lassiosiraspecies in the first two samples while after 28 May
12:00 the most abundant algal specie found wasPs. nitzschia
cf. delicatissima, which accounted for 48 to 96% of the
to-tal cell concentration. The variability between different days indicates that the distribution of algal species in the seawater was dependent on the spatial and time coordinates. Like-wise, the analysis on dinoflagellates (Fig. 5) shows spatial and time variations, characterised by a distribution of 8 taxa accounting for 5–20% of the total cell count in the 27 May and 28 May 12:00 samples, while populations dominated by
Prorocentrumspecies are found in the 28 May 07:15 and 1
June samples. It is also noticeable that theProrocentrum
tri-estinumspecies were present in all the samples, comprising
∼18–78% of the total dinoflagellate counts.
3 Laboratory aerosol experiments
3.1 Sample preparation
Artificial seawater was prepared from analytical grade salts and deionised water following the method described by Kester (1967), so that the ionic mass ratios of Na+, Cl−, Mg2+, HCO−3 and SO24− were comparable to those in sea-water. Seawater samples of 35‰ salinity were prepared by adjusting the solution density at the given temperature using a hydrometer.
Natural seawater samples collected from North Atlantic waters were enriched with biogenically-synthesized organic matter by culturing algal cells in the laboratory, after re-moval of natural organic material. Cultures of diatoms and nanoplankton, which were the most abundant algal groups identified in the RHaMBLe cruise seawater samples, were grown to produce bioexudate. The seawater used for growing the algal cultures was collected near the Scotland coast (UK) (Tiree passage, 56◦37.7′N, 6◦23.8′W) by pumping surface water from ∼5 m depth into 20 L carbouys. After collec-tion, the seawater was aged prior to use. The aged natural seawater was filtered (GF/F; Whatman) to remove algal and
bacterial biomass. The sample was subsequently amended with a f/2 nutrients solution and either selenite or silicate (Guillard, 1975), and sterilised by autoclaving (121◦C for 15 min) in order to prepare the medium for the algal cul-ture. The algal cultures were grown in glass Erlenmeyer flasks fitted with gas permeable stoppers or 20 L polycarbon-ate carbouys (Nalgene) at 15◦C with a photon flux density of ca. 70 µmol PAR m−2s−1supplied by cool-white fluores-cent lighting (Phillips, Netherlands) with a photoperiod of 12:12 h (light:dark). A Turner Trilogy fluorometer (Turner, USA) was used to monitor in vivo chlorophyll-a fluores-cence. The algal cultures were harvested when the culture reached peak in vivo fluorescence. Following algal growth in Erlenmeyer flasks, the cell biomass was removed by filtra-tion through pre-combusted (450◦C for 8 h) glass fiber fil-ters (GF/F; Whatman) and subsequently through deionised-water rinsed and sterile polycarbonate filters (0.2 µm; Milli-pore). Large volume algal cultures (10–20 L) were subjected to cross-flow filtration (0.2 µm; Schleicher and Schuell) to remove algal and bacterial biomass. The seawater enriched with algal organic material was then stored frozen at−20◦C until use.
Table 2.Algal species employed for the production of exudate and OC<0.2µmof seawater proxies prepared with a single algal exudate.
Algal specie Algal group OC<0.2µm(µM)
Thalassiosira rotulaCCAP 1085/13 Diatom 175 300 512
Chaetoceros sp.CCAP 1010/12 Diatom 175 300 512
Emiliania huxleyiAC475 PNAN, Coccolithophore 175 512 2171
Phaeocystis cf. globosaLY1 PNAN, Prymnesiophyte 175 512 910
Table 3.Contribution of single algal exudates to the total organic carbon content of seawater proxies enriched with exudates mixtures (total
OC<0.2µm=512 µM).
OC<0.2µm(µM)
Mixture sample T. rotula Chaetoceros E. huxleyi Phaeocystis
TRotulamix 256 (50%) 85.33 (16.67%) 85.33 (16.67%) 85.33 (16.67%) Chaetmix 85.33 (16.67%) 256 (50%) 85.33( 16.67%) 85.33(16.67%) EHuxmix 85.33 (16.67%) 85.33 (16.67%) 256 (50%) 85.33 (16.67%) Phaeomix 85.33 (16.67%) 85.33 (16.67%) 85.33 (16.67%) 256 (50%)
Table 4. Summary of experimental conditions in the multiple
plunging water jet system employed in this study. Qw=total
wa-ter flow,v1=mean jet velocity at the water surface,d0=nozzle di-ameter, h=vertical distance from the nozzle to the water surface, z=penetration depth.
Number of water jets 8
Qw(lpm) 4
v1(m/s) 1.11
d0(cm) 0.4
h(cm) 4
z(cm) 7
sweep air flow (lpm) 3–3.5
composition (Facchini et al., 2008). It should be noted that although the term DOC (dissolved organic carbon) is gen-erally applied to organic carbon with size<0.5–0.7 µm ob-tained after filtration, this term is defined as a function of size, not solubility, and thus, it is inappropriate for defining the organic carbon pool in this size range (Verdugo et al., 2004).
Two different methods were applied to prepare seawater proxies using the produced phytoplankton exudate. In the
bulk mixing method, seawater solutions containing a single
algal exudate type were prepared at organic carbon concen-trations of the order of that in the seawater collected dur-ing the RHaMBLe cruise, in order to simulate the condi-tions expected near regions with high biological activity. To do this, artificial seawater devoid of exudate and aliquots of the stock solution of natural seawater enriched with organics
were mixed to obtain the selected OC<0.2µmconcentration. Table 2 lists the algal exudates and the concentration of the seawater proxies prepared with each exudate type.
Additionally, seawater proxies containing a mixture of different exudates were prepared applying the bulk mixing method. Seawater samples at 512 µM OC<0.2µm concentra-tion were made with one of the algal exudates comprising 50% of the total organic concentration, while the rest of the organic content was equally divided between the other three algal exudates on study (i.e. 16.67% of total OC<0.2µm for each algal exudate). Table 3 summarises the distribution of the organic content with respect to the different algal exu-dates used for the preparation of each seawater proxy class.
With themonolayer method, the effect of organic micro-layers on the particle production was investigated. Solid phase extraction (C-18 Sep-Pak SPE cartridges) was applied to extract the hydrophobic matter contained in 2 ml of the aqueous exudates, by using 10 mL of a 2:1 volumetric mix-ture of chloroform and ethanol as extraction solvent. The solvent extracted samples were dried out and redissolved in chloroform and spread dropwise on the surface of artificial seawater contained into the bubble tank.
3.2 Aerosol generation
Fig. 2. Cells counts, chlorophyll-aand phaeophytin analysis of samples collected during the RHaMBLe cruise (left) and relation-ship between phytoplankton and cyanobacteria cell counts with chlorophyll-aconcentration (right). The phytoplankton population was dominated by the nanoplankton group (HNAN: 10%, PNAN, 89%), followed by diatoms (0.5%) and dinoflagellates (0.0005%).
experiments, the water flow was divided in eight water jets by using a flow distributor. A chemically resistant PTFE composite tube (Masterflex I/P 70) was employed for wa-ter recirculation in order to avoid contamination of the wawa-ter samples and adhesion of surfactants on the tubing wall. The experimental conditions for the conducted measurements are summarised in Table 4.
For the aerosol experiments the PTFE tank was filled with 6 L of the prepared seawater proxy (Tables 2–3), sealed and swept with a continuous air flow of 3–3.5 lpm. The humid-ity of the sample flow directed from the tank to the aerosol characterization instruments was reduced to 32–42% RH by mixing the sample with a 5% volumetric dry air flow, mon-itored by a mass flow controller, and by using a Nafion gas dryer. The relative humidity of the sample was monitored with a Rotronics HygroClip SC05 sensor positioned down-stream of the gas dryer.
Thorough cleaning procedures were applied in order to minimize the presence of contaminants in the system. To do this, an isopropanol and deionised water solution was re-circulated in the PTFE tank for an hour, followed by two se-quential tank washes with 5 litres of deionised water. Next the tank walls were cleaned with chloroform, rinsed and washed with deionised water. In order to rinse the pump tu-bing, deionised water was recirculated through the tank tub-ing. Finally, the tank was washed twice with 5 L of deionised water.
Reduced inertial forces occurring in small-scale plunging water jet systems, as the one used in the present study, lead to the formation of shallow bubble plumes and, in consequence, to bubble paths and lifetimes shorter than those expected in real conditions (Fuentes et al., 2010). Theoretical analysis of surfactant adsorption by rising bubbles in a solution of marine algal exudate indicates that equilibrium adsorption is reached on a timescale considerably shorter than the bub-ble residence time in scaled system such as the present one (Fuentes et al., 2010). Instantaneous adsorption of surfac-tants on rising bubbles has also been found in theoretical and experimental studies with cationic surfactants (Morgan et al., 1992). As the steady state for surfactant adsorption is reached rapidly, bubble enrichment is not transport limited, thus, it will be assumed that the bubbles, and hence, the parti-cle organic enrichment produced in the bulk mixing method experiments does not require scaling to the real time-scale conditions. In the experiments with organic monolayers the lifetime of the bubbles on the water surface might be too re-duced to allow adsorption equilibration. However, if organics are in the form of microlayers on the ocean surface, a similar level of disequilibrium may pertain in oceanic conditions.
3.3 Aerosol characterisation
Fig. 3.Total and normalized cell counts for photosynthetic nanoplankton (PNAN) and heterotrophic nanoplankton (HNAN) populations in the oceanic seawater samples collected during the RHaMBLe cruise.CrysocromulinaandPhaeocystiswere identified as dominant species in the nanoplankton group.
Fig. 4. Total and normalized cell counts for the diatom population in the oceanic seawater samples collected during the RHaMBLe cruise
(color legend is in the same order as plot bars). The analysis identifiedPs.nitzschia delicatissimaandThalassiosiraas the dominant diatom species in the seawater samples.
Fig. 5. Total and normalized cell counts for the dinoflagellate population in the oceanic seawater samples collected during the RHaMBLe
Fig. 6. Schematic of experimental set-up for the measurement of the size distribution of primary sea spray generated by water im-pingement.
counter. The DMAs were operated in parallel and utilised a custom built sealed, recirculating sheath air system, which was humidity controlled and filtered. Particle size distribu-tions in the dry diameter size range from 3 nm to 450 nm were obtained as the average of 6 scans during a 60 minute measurement period. All the laboratory measurements were conducted at∼20◦C. Due to the limited amount of organic-enriched seawater available, the sample was not replaced dur-ing the duration of the aerosol experiments. Time series of particle size distribution measurements did not indicate any significant changes during the duration of the experiments.
Seawater samples were collected along the RHaMBLe cruise track for the on-board production of primary aerosol by using the plunging-waterjet aerosol generator, operated with two water jets. Two to three seawater samples were col-lected daily with time intervals of 3–4 h in the period from 30 May to 5 June. The experiments were conducted within an hour after collection. The size distribution of the produced particles was characterized by means of a Scanning Mobil-ity Particle Sizer (SMPS) (TSI Inc Model 3936NL25), which consists of a Model 3080 classifier and a 3025A-S conden-sation particle counter. Measurements in the size range from 7.4 nm to 289 nm (Dp0) were obtained as the average of 12 scans during a 60 min measurement period. The on-board measurements were conducted at∼23◦C.
Blank tests were performed prior to the experiments by measuring the particle counts in the sample air flow from the tank head space in the absence of bubbles. Bubbling experi-ments were initiated when the particle counts detected in the blank air were zero. The measurements were corrected for particle losses by considering the calculated transmission ef-ficiency from the tank to the instruments as a function of the particle size. Most particle losses (up to 75% loss) occurred in the size range below 20 nm, as a result of diffusion.
3.3.1 Particles morphology considerations
For cubic particles, such as NaCl, a standard shape factor of
χ=1.08 is generally applied in order to reconcile the mobility and volume equivalent diameters. This correction is neces-sary to estimate the particles hygroscopic growth and the vol-ume equivalent diameter, usually employed as input param-eter for calculations based on the K¨ohler theory. NaCl is an important component in both the artificial and natural seawa-ter samples used in this study; however, transmission Elec-tron Microscope images of particles generated from artificial and natural seawater by bubble bursting have shown that in the presence of organics and other inorganic salts the mor-phology of these particles may differ from the well-known cubic shape of NaCl particles (Wise et al., 2009).
Because of the high hygroscopicity of sea spray particles, some water is probably absorbed on the particles at the rel-ative humidity for size selection in the DMA (32–42% RH); however, it is not clear to what extent the water absorbed by the particles at this humidity can induce a change to spheri-cal shape. Although the onset of particle morphology change for sea spray particles has been observed to occur at 45% RH, particle rounding does not take place until 65% RH is reached (Wise et al., 2009). In this study a shape factor of
χ=1.04 is applied, the mean value in the range from spheri-cal (χ=1) to cubic shape (χ=1.08), implying an uncertainty of 4% in the determination of the selected particle size.
4 Results of aerosol experiments
4.1 Bubble spectrum
The study of the number and size of sea salt drops ejected by individual bubbles have demonstrated that the relative contri-bution of jet and film drops to the aerosol production depends critically on the characteristics of the parent bubble size dis-tribution (Spiel, 1997; Wu, 2002). Laboratory reproduction of the oceanic bubble spectrum would therefore be relevant for the generation of a representative marine aerosol.
10-8 10-7 10-6 10-5 10-4 10-3 10-2 10-1 100
Normalized bubble number
φ
=(dN/dD
b
)/N
b
101 102 103 104 105
Bubble diameter Db (µm) water jet, AS (Fuentes et al., 2010) : φ ∼Db-1.49±0.22 water jet, NS (Hultin et al., 2009): φ ∼Db-1.85 weir, AS (Sellegri et al., 2006): φ ∼Db-1.46 water jet, aquarium seawater (Bowyer., 1992): φ ∼Db-1.9 whitecap tank, SNS (Asher et al., 1997): φ ∼Db-3.5
whitecap tank, SNS with added surfactants (Asher et al., 1997): φ ∼Db-3.5
Fig. 7. Comparison of normalized bubble populations generated
by seawater impingement in different laboratory studies. The wa-ter impingement-generated bubble distributions present a common dominant mode in the 40 µm to 110 µm bubble size region fol-lowed by a decrease in the bubble number with power-law expo-nents between 1.46–3.5 (AS=artificial seawater, NS=natural seawa-ter, SNS=sterilised natural seawater).
at similar locations with respect to the impingement zone. Notwithstanding the difficulty of comparing between the dif-ferent cases, because of the dependency of the measurements on the relative position of the measuring system with respect to the impingement area, it is observed that all the distribu-tions exhibit a dominant peak in the 40 µm to 110 µm region, followed by a decrease in the bubble number with increas-ing size. The power-law exponent of the different curves varies between 1.46 and 3.5, which is within the range of val-ues found for oceanic bubble spectra (Lewis and Schwartz, 2004). The similarities between the bubble spectra produced in water impingement simulation experiments and oceanic bubble spectra profiles is discussed in Fuentes et al. (2010). In the study of Asher et al. (1997) the addition of surfac-tants to sterilised natural seawater did not produce significant changes in the bubble spectra generated by water impinge-ment (Fig. 7). Although both surfactants and electrolytes are known to affect the bubble size distribution formed in fresh-water solutions (Xu et al., 2009), the experiments of Asher et al. (1997) indicate that the effect of surfactants on the bub-ble spectrum is negligibub-ble in the presence of electrolytes at concentrations occurring in seawater.
The multiple water jet system employed in the present study was hydrodynamically scaled with respect to the single water jet system used to measure the bubble spectrum shown in Fig. 7 (see Fuentes et al. (2010) for a detailed description). This scaling procedure ensures equivalence between the void
fraction and the normalized bubble spectra of the single and the multiple water jet systems. In order to derive the bubble spectrum generated by the multiple jet system, scaling of the bubble spectrum produced by the single water jet generator to the multi-jet configuration should be applied. To do this, the air entrainment associated with the individual jets in the multijet system and the number of water jets has to be con-sidered. This calculation is applied to derive the surface area covered by bubbles as described in Sect. 5.
4.2 Aerosol size distribution measurements
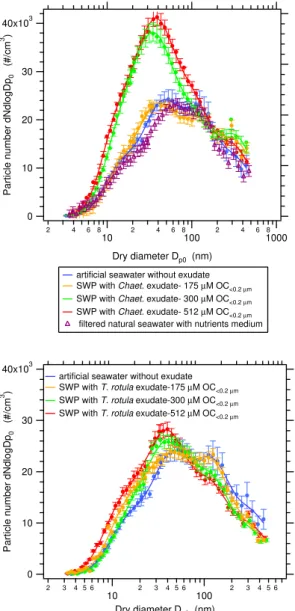
Size distributions of the aerosol generated from seawater proxies enriched withT. rotula andChaetoceros exudates, prepared using the bulk mixing method, are shown in Fig. 8. For comparison, these curves have been represented together with the measurements for artificial seawater devoid of ex-udate and natural seawater plus the nutrients medium used for growing the algal culture. Although the majority of the added nutrients are supposed to be consumed by the algae during the growth period, the seawater+algal medium mea-surement has been included in order to compare with the measurements conducted with the samples resulting after al-gal growth.
For a detailed analysis of these measurements each size distribution was decomposed into lognormal modes by ap-plying least square fitting to the experimental data. In all cases the size distributions were found to be well-represented by four lognormal modes, with modal sizes of ∼15 nm, ∼45 nm, ∼125 nm and ∼340 nm, respectively (see supple-mentary material, Figs. S1 and S2). The definition of the size distribution as a function of lognormal modes is used here as a convenient mathematical construct to represent and inter-pret the physical distribution, without attributing any physi-cal significance to these lognormal modes.
40x103
30
20
10
0
Particle number dNdlogDp
0
(#/cm
3 )
2 3 4 5 6
10 2 3 4 5 6 100 2 3 4 5 6 Dry diameter Dp0 (nm)
artificial seawater without exudate SWP with T. rotula exudate-175 µM OC<0.2 µm
SWP with T. rotula exudate-300 µM OC<0.2 µm
SWP with T. rotula exudate-512 µM OC<0.2 µm 40x103
30
20
10
0
Particle number dNdlogDp
0
(#/cm
3 )
2 4 6 8
10 2 4 6 8100 2 4 6 81000
Dry diameter Dp0 (nm)
artificial seawater without exudate SWP with Chaet. exudate- 175 µM OC<0.2 µm
SWP with Chaet. exudate- 300 µM OC<0.2 µm
SWP with Chaet. exudate- 512 µM OC<0.2 µm
filtered natural seawater with nutrients medium
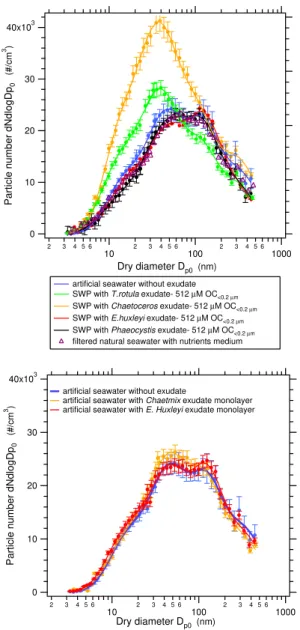
Fig. 8. Particle size distributions obtained for artificial seawater
without exudate and seawater proxies (SWP) enriched withT.
ro-tulaandChaetocerosexudates at different OC<0.2µm
concentra-tions. Error bars indicate the variability of the measurements ob-tained from 6 scans during 1 h period as±1σ standard deviation.
mode, centered at∼125 nm was observed to decrease, which also contributes to the shift of the size distribution to smaller sizes. It should be noted that the change in the lognormal pa-rameters is a manifestation of the effect of the organic matter on the particle production, which can be used as a way to rep-resent the phenomenon, but that does not provide any insight into the physical process that modifies the size distribution properties.
In order to compare the effect of the algal exudate type on the particle size distribution, Fig. 10 (top) shows the exper-iments conducted with seawater at 512 µM OC<0.2µm
con-103 2 4 6 104 2 4 6 105 Nt (cm -3) 500 400 300 200 100 0
OC<0.2 µm (µM)
Chaetoceros exudate
T.rotula exudate
fit mode 2 mode 1 3 4 5 6 7 8 104 2 Nt (cm -3) 500 400 300 200 100 0
OC<0.2 µm (µM)
mode 3 103 2 4 6 104 2 4 6 105 Nt (cm -3) 500 400 300 200 100 0
OC<0.2 µm (µM)
mode 4 450 400 350 300 250 200 Dp0g (nm) 500 400 300 200 100 0
OC<0.2 µm (µM)
mode 4 200 180 160 140 120 100 80 Dp0g (nm) 500 400 300 200 100 0
OC<0.2 µm (µM)
mode 3 70 60 50 40 30 Dp0g (nm) 500 400 300 200 100 0
OC<0.2 µm (µM) mode 2 20 18 16 14 12 10 Dp0g (nm) 500 400 300 200 100 0
OC<0.2 µm (µM)
mode 1 (a) (b) (c) (e) (g) (c) (f) (d)
Fig. 9.Effect of organic exudate concentration on the total particle
numberNt(a, b, c)and geometric meanDp0g(d, e, f, g)of the four
lognormal modes comprising the particle size distributions gener-ated from seawater enriched withChaetoceros andT. rotula exu-dates (lognormal modal sizes (Dp0): mode 1,∼12–15 nm; mode 2,
∼37–46 nm; mode 3,∼115-127 nm; mode 4,∼315–328 nm).
centration for all the algal exudates on study. Whereas the di-atomaceous exudate (T. rotulaandChaet.) size distributions are affected by the presence of organic matter with respect to the case without marine organics, no significant effects were observed for the experiments with nanoplankton exudates (E.
huxleyiandPhaeocystis) in the range of concentrations
40x103
30
20
10
0
Particle number dNdlogDp
0
(#/cm
3)
2 3 4 5 6
10 2 3 4 5 6 100 2 3 4 5 6 1000 Dry diameter Dp0 (nm)
artificial seawater without exudate SWP with T.rotula exudate- 512 µM OC<0.2 µm
SWP with Chaetoceros exudate- 512 µM OC<0.2 µm
SWP with E.huxleyi exudate- 512 µM OC<0.2 µm
SWP with Phaeocystis exudate- 512 µM OC<0.2 µm filtered natural seawater with nutrients medium
40x103
30
20
10
0
Particle number dNdlogDp
0
(#/cm
3)
2 3 4 5 6
10 2 3 4 5 6 100 2 3 4 5 6 1000 Dry diameter Dp0 (nm)
artificial seawater without exudate
artificial seawater with Chaetmix exudate monolayer artificial seawater with E. Huxleyi exudate monolayer
Fig. 10. Comparison of the particle size distribution for artificial
seawater without added surfactants and seawater proxies (SWP) en-riched with single algal exudates at 512 µM OC<0.2µm concen-tration (top) and size distributions obtained with the monolayer method (bottom). The size distribution obtained from filtered nat-ural seawater with added nutrients (=filtered natnat-ural seawater with f/2 medium) is included for comparison. Error bars indicate the variability of the measurements obtained from 6 scans during 1 h period as±1σ standard deviation.
effect on particle production. It should be noted, however, that the organic layer was not replenished during the dura-tion of the experiments, thus, removal of the monolayer by bubble bursting might have occurred on a timescale shorter than the time required to obtain a measurement. Also, the time for adsorption of organic material onto the bubble prior to bursting may be too reduced for adsorption equilibrium to be reached, explaining why no effects were observed.
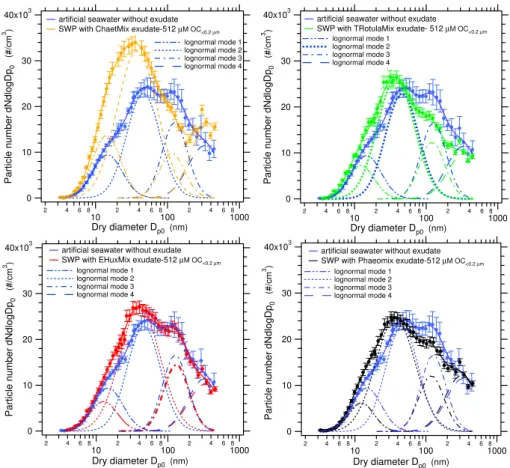
The results obtained with seawater enriched with mix-tures of algal exudates are shown in Fig. 11. Although the nanoplankton exudates alone did not produce any effect on the size distributions, when they were combined with the diatomaceous exudate, a shift of the aerosol size distribu-tions toward smaller sizes was observed. In the same way that the previous analysis of the diatomaceous exudate mea-surements, decomposition of the distribution into lognormal modes indicates that the effect is due to the reduction in the modal size and the increase in the particle number of the sec-ond lognormal mode at∼45 nm, together with the reduction of the third lognormal mode centered at∼125 nm (Fig. 11) (the indicated modal sizes refer to the case without added or-ganics). The largest effect observed was for the Chaetmix experiment, which is the mixture that contains the largest proportion ofChaetocerosexudate. This exudate type also caused the greatest effect in the experiments with single exu-dates. Measurements with the algal mixtures confirm that the organics in the diatomaceous exudates influence the particle production, while the nanoplankton exudate does not induce any change.
It is interesting to compare the measurements shown herein with studies by Sellegri et al. (2006) and Tyree et al. (2007), who examined the effect of SDS and oleic acid in seawater, as surfactant surrogates, on the production of ma-rine particles by bubble-bursting. In an analogous manner to the present study, a shift of the marine submicron size dis-tribution to smaller sizes was observed in both studies with the addition of amounts≥3 mgL−1of SDS and≥0.1 mgL−1 of oleic acid to artificial seawater. In a similar way to the presented measurements, an increase in the particle produc-tion, together with the size distribution shift, was reported by Tyree et al. (2007) in their experiments with oleic acid.
40x103
30
20
10
0
Particle number dNdlogDp
0
(#/cm
3)
2 4 6 8
10 2 4 6 8100 2 4 6 81000
Dry diameter Dp0 (nm)
artificial seawater without exudate SWP with EHuxMix exudate-512 µM OC<0.2 µm
lognormal mode 1 lognormal mode 2 lognormal mode 3 lognormal mode 4
40x103
30
20
10
0
Particle number dNdlogDp
0
(#/cm
3)
2 4 6 8
10 2 4 6 8100 2 4 6 81000
Dry diameter Dp0 (nm)
artificial seawater without exudate
SWP with TRotulaMix exudate- 512 µM OC<0.2 µm lognormal mode 1
lognormal mode 2 lognormal mode 3 lognormal mode 4
40x103
30
20
10
0
Particle number dNdlogDp
0
(#/cm
3)
2 4 6 8
10 2 4 6 8100 2 4 6 81000
Dry diameter Dp0 (nm)
artificial seawater without exudate SWP with Phaeomix exudate-512 µM OC<0.2 µm
lognormal mode 1 lognormal mode 2 lognormal mode 3 lognormal mode 4
40x103
30
20
10
0
Particle number dNdlogDp
0
(#/cm
3)
2 4 6 8
10 2 4 6 8100 2 4 6 81000
Dry diameter Dp0 (nm)
artificial seawater without exudate SWP with ChaetMix exudate-512 µM OC<0.2 µm
lognormal mode 1 lognormal mode 2 lognormal mode 3 lognormal mode 4
Fig. 11.Particle size distributions obtained for artificial seawater without exudate and seawater proxies enriched with mixtures of different
algal exudates at 512 µM OC<0.2µmconcentration. Error bars indicate the variability of the measurements obtained from 6 scans during 1 h period as±1σ standard deviation.
acid are valid as proxies of marine organic matter. A broader characterization of the physical and chemical properties of particles enriched with these substances, such as hygroscopic and CCN properties, should be performed in order to assess the adequacy of these compounds for representing marine or-ganics.
Tyree et al. (2007) explored the effect of marine organ-ics on the primary particle production by generating aerosol from seawater proxies prepared by mixing filtered natural seawater and artificial seawater at different ratios. In contrast to the present study, these authors did not find a correlation between the particle production and the concentration of or-ganics in seawater proxies. This discrepancy is most likely due to differences in the method of particle production and the properties of the seawater samples employed for conduct-ing the measurements. Primary aerosol organic enrichment has been shown to depend on the system for particle pro-duction (Fuentes et al., 2010). Thus, the use of a different aerosol generation mechanism in the present study (bubble-bursting induced by water impingement) and Tyree et al. (2007) (bubble-bursting induced by injecting air through a porous frit) might partly explain the differences between the results.
In addition, the effect of organics on the size distribution has been shown to be dependent on the seawater organic con-centration and the type of algal exudate. Significant effects on the particle production have only been observed for mini-mum concentrations between 175 µM and 300 µM OC<0.2µm
of diatomaceous exudate in this work. The natural seawater samples employed by Tyree et al. (2007), although enriched in organics (maximum concentrations of 250 µM and 190 µM OC<0.7µm), were probably not enriched enough in the
or-ganic surfactants present in the diatomaceous exudate that are able to produce an effect on the particle production. This is illustrated in the experiments conducted with nanoplank-ton exudate, where for unrealistically high organic carbon concentrations (910–2100 µM OC<0.2µm) there was not any effect on the particle production (see Fig. S3 in supplemen-tary material).
3 4 5 6 7 8
10 2 3 4 5 6 7 8100 2 3 4 5 Dry diameter Dp0 (nm)
200
150
100
50
0
Particle number dN/dlog(Dp
0
) (#/cm
3)
Productive area (29/05/07-01/06/07) Non-productive area (02/06/07-05/06/07) Lognormal mode 1
Lognormal mode 2 Lognormal mode 3
Fig. 12. Evolution of the size distribution of primary aerosol generated by bubbling unfiltered seawater during the RHaMBLe cruise
(29thMay- 5 June) and seawater chlorophyll-aconcentration (derived from SeaWiffs ocean color data) along the cruise track (left). Mean particle size distributions measured inside and outside the productive area during the RHaMBLe cruise (right) and decomposition into log-normal modes. Measurements were conducted at∼23◦C. Error bars indicate the variability of the measurements obtained from 6 scans during 1 h period as±1σstandard deviation.
Tseng et al. (1992) found that oleic acid, stearic acid, triolein, and cholesterol in seawater were transported to particles gen-erated by bubble bursting in decreasing order in direct rela-tionship to their susceptibility to be absorbed by rising bub-bles. The dependence of the produced effect on the type of organic exudate is likely to be related to the chemical prop-erties of the surfactants secreted by diverse algal strains. It has been shown that the photosynthetic extracellular release depends on the taxonomic composition of the phytoplankton populations (Wolter, 1982). Comparative analysis of the ex-udates released by a number of diatom species has shown dif-ferences in the excretion rate between strains within the same taxonomic group (Myklestad, 2000). These examples show clearly that the composition of the algal population has to be taken into consideration, however, further research is needed to establish correlations between the exudates chemical com-position and the observed phenomena in order to fully eluci-date this stated hypothesis.
The results presented in the current study indicate that interpretation and comparison of the effect of organic mat-ter on the production of marine aerosol should be made in light of the dependencies found regarding the seawater or-ganic enrichment and type of oror-ganic exudate. The pre-sented results show that a minimum concentration between 175 µM and 300 µM OC<0.2µmof diatomaceous exudate was needed to observe significant effects on the particle pro-duction. Since the average concentration of organic mat-ter in oceanic surface wamat-ters is reported to be 50–80 µM OC<0.5−0.7µm(Owaga and Tanque, 2003), the observed
ef-fects on particle production would only be significant in bloom areas, where µM OC<0.2µmconcentrations can reach values higher than 300 µM (Ittekot (1982) and data in
Ta-ble 1), with a regional abundance of diatoms. Diatoms are major contributors to the organic pool in seawater and are frequently found as a dominant group in plankton blooms (Lavender et al., 2008; Meskhidze and Nenes, 2006; Ittekot, 1982).
4.3 RHaMBLe field size distributions
The evolution of the size distribution of primary sea spray generated during the RHaMBLe cruise using unfiltered oceanic seawater is shown in Fig. 12, together with the chlorophyll-a concentration along the cruise track (derived from the SeaWiffs satellite data, May 2007). The productive and non productive regions can be identified by observing the Chl-a profile along the cruise track, which indicates 2 June as the delimiting date for the transition from the productive to the non-productive zone.
Although it is not observed a clear correlation between the chlorophyll-a profile and the particle size distributions in-side the bloom region, both the particle production and the chlorophyll-aconcentration drop on departing the productive area. In addition, the modal size of the distribution is shifted from circa 40 nm within the productive area to a larger value of 52 nm, outside the productive area.
Dp0<100 nm was larger in the productive area than in the non-productive region due the lower modal size and higher particle number that the lognormal mode centered at∼45 nm presents in the bloom region. This behaviour parallels the trends observed in the presented experiments with seawater proxies with and without exudate. As the seawater employed for the on-board measurements was not subjected to filtra-tion, the observed effect could be attributable to detritus, or-ganic macrogels and colloidal and dissolved oror-ganic carbon (Verdugo et al., 2004).
In the ocean, phytoplankton populations are exposed to varying stress conditions different to those in laboratory cul-tures (e.g. light, pH, temperature, nutrients, virus and bac-terial attack), which might affect the metabolic activity and organic matter released by the algal cells. The compara-ble trends between the laboratory measurements conducted with exudate from algal cultures and the on-board experi-ments with oceanic samples indicate that, notwithstanding the different conditions for algal growth, the exudate from algal cultures performs in a similar manner to the organic matter produced in real conditions.
Long-term observations of marine aerosol in North At-lantic waters by O’Dowd et al. (2004) and Yoon et al. (2007) have revealed seasonal variation in the characteristics of the atmospheric marine aerosol size distribution. This variation was typified by a higher particle number (Aitken mode), par-ticle size and parpar-ticle organic enrichment during high bio-logical activity periods (spring and summer) compared to low productivity periods (winter). The increase in the par-ticle number with the addition of organic matter observed in the laboratory and on-board experiments during the RHaM-BLe cruise are in agreement with the increase in the par-ticle production during high productivity periods observed by O’Dowd et al. (2004). However, it should be considered that the atmospheric aerosols are affected by factors such as temperature, wind speed and secondary aerosol production processes of biogenic, anthropogenic and terrestrial origin. Thus, direct extrapolation of primary aerosol experiments to atmospheric observations requires the factoring in of these additional functions.
In an attempt to explain the seasonal variability of the ma-rine aerosol distribution it has been postulated that the in-crease in the modal sizes occurring from winter to summer is related to the impact of the higher biological activity occur-ring duoccur-ring warm periods on the primary aerosol production (O’Dowd et al., 2004; Yoon et al., 2007). In contrast to this hypothesis, the results presented in the present study show that, if there is a contrasting effect, it is to reduce the modal sizes with increasing amounts of phytoplankton-derived or-ganic matter in seawater. This behaviour was observed when bubbling with both unfiltered seawater and seawater prox-ies with colloidal organic carbon <0.2 µm. This suggests that the seasonal evolution of the modal sizes observed by O’Dowd et al. (2004) is not directly driven by the increase in the primary biogenic matter production during warm
peri-ods, if the same processes are at play. It would then be neces-sary to invoke other reasons such as temperature, wind speed or aerosol secondary formation processes to explain the ob-served modal increase in the spring-summer periods. Sellegri et al. (2006) found that a shift of the modal diameters of the sea-spray distribution occurred with the increase of the tem-perature from 4◦C to 23◦C. This would imply that the tem-perature rise from winter to summer would produce an in-crease in the modal sizes of the size distribution, in an oppo-site trend to that induced by the presence of primary biogenic matter, according to the present study. Secondary aerosol for-mation is also enhanced during the high productivity periods (Yoon et al., 2007), which has been postulated to increase both total number concentration and non-sea salt sulphate mass during these periods. Oxidation of phytoplankton-produced gaseous emissions like non-methane hydrocarbons, has been postulated to lead to secondary organic aerosol for-mation during high biological activity periods (Meskhidze and Nenes, 2006). These are some of the hypothetical factors that could compensate for the reduction in the size induced by the primary organic matter, leading to an overall increase in the modal sizes during high biological activity periods. Further research is therefore needed to determine what the dominant factors are that drive the seasonal evolution of the atmospheric marine aerosol size distribution.
5 Size-resolved source flux parameterisation as a
function of the diatomaceous biogenic carbon concentration
Parameterisations of sea-spray source functions are generally formulated to estimate the sea-spray production as a func-tion of wind speed and whitecap fracfunc-tion (which in turn is formulated as function of wind speed) by using the so-called whitecap method (Lewis and Schwartz, 2004).
In order to account for the effect of the biogenic marine or-ganic matter on the particle production, a primary sea spray source parameterisation defined as a function of seawater di-atomaceous OC<0.2µm concentration was derived from the presented production experiments. Although other factors such as water temperature and salinity are likely to affect the sea spray particle production (M˚artensson et al., 2003; Lewis and Schwartz, 2004), these effects are not contem-plated here. The particle flux per bubble covered area can be calculated from the size distributions (based on the dry diam-eterDp0) by considering the bubble production (M˚artensson et al., 2003):
dFp
dlogDp0=
Q Ab
dNT
dlogDp0
(1) wheredFp/dlogDp0is the size-resolved particle flux per unit time and water surface covered by bubbles, Q is the sweep air flow,dNT/dlogDp0is the particle size distribution andAb,
of the bubble coverage was conducted under the assumption that the bubbles burst upon reaching the water surface. It has been postulated that the presence of surfactants might affect the lifetime of bubbles on the seawater surface and, thereby, the whitecap coverage (Lewis and Schwartz, 2004). The experimental characterization of this hypothetical effect is, nevertheless, missing (Lewis and Schwartz, 2004). The area covered by bubbles was calculated by integrating the steady state bubble spectrum, considering that at equilibrium conditions, the amount of bubbles produced is equal to the amount of bubbles reaching the surface. The bubble spec-trum obtained for one water jet (shown in Fig. 7) was scaled to a configuration with eight water jets. To do this, the air en-trainment linked to each individual jet in the multi-jet system was calculated by using the air entrainment ratio parameter-isation from Bin (1993), which yields a factor of 0.29 with respect to the air entrainment for the single water jet system. In this calculation, the bubble spectrum generated in seawater without added surfactants was employed under the assump-tion that the effects of surfactants on the bubble spectrum is negligible in the presence of electrolytes. This assump-tion is based on experiments by Asher et al. (1997), which show that the addition of surfactants to sterilised seawater does not modify the bubble spectrum generated by water im-pingement.
In order to account for the effect of the marine organics on the particle size distribution, the parameterisation was for-mulated to define the dependence of the lognormal param-eters of the modes comprising the sea-spray distribution on the seawater diatomaceous OC<0.2µmcontent. To derive the size-resolved flux source function the submicron size distri-butiondNT/dlogDp0in the 3–450 nmDp0range is defined as the sum of four lognormal modes:
dNT
dlogDp0=
i=4 X
i=1
dNT ,i
dlogDp0=
(2)
=
i=4 X
i=1
NT ,i
√ 2πlogσi
exp −
1 2
log Dp0/Dp0g,i
logσi
!2
whereiis the subindex for the mode number andNi,Dp0g,i
andσi are the total particle number, geometric mean and
ge-ometric standard deviation for each lognormal mode. The total particle number and geometric mean of the log-normal modes comprising the distributions can be parame-terised as a function of the seawater OC<0.2µm content by
fitting equations to the data obtained in the analysis pre-sented in Fig. 9. Using the relationships between the seawa-ter OC<0.2µmcontent and the particle size distribution prop-erties, the total particle number and the geometric mean di-ameter can be defined by fitting 3rd order polynomial and ex-ponential regressions to the data, respectively, in a diatoma-ceous OC<0.2µmconcentration range between 0 and 512 µM:
NT ,i=βi,1OC<0.2µm2+βi,2OC<0.2µm+βi,3 (3)
Table 5.Values of parameters inferred from polynomial and
expo-nential regressions defining the total particle number and geometric mean diameter of the lognormal modes comprising the size distri-butions as a function of the diatomaceous OC<0.2µm content of seawater (i= mode number).
Parameter Mode 1 Mode 2 Mode 3 Mode 4
αi,1 12.328 38.077 102.31 281.65
αi,2 2.2958 8.0935 25.251 46.80
αi,3 0.00452 0.00705 0.00080 0.000761
βi,1 0.0311 −0.031633 0.013154 −0.0017762
βi,2 −13.916 35.73 −9.7651 1.1665
βi,3 4747.8 12920 7313.4 6610
Dp0g,i=αi,1+αi,2exp −αi,3[OC<0.2µm] (4) The values of the parameters inferred from these regres-sions are included in Table 5. The geometric standard de-viation values derived from the fitting procedure were 1.55, 1.7, 1.5 and 1.7 for each of the lognormal modes (modes 1 to 4), in the organics-free seawater case. Only the value of the standard deviation of the second lognormal mode changed to 1.9 for the case with organics. For the rest of the modes no significant changes were observed in the geometric standard deviation with the modification of the organic concentration. Reasonable agreement between the predicted and observed particle fluxes is achieved with the fitting procedure applied, with a deviation of∼40% within 95% limits for all the exper-iments conducted in this study (Fig. 13). For generalisation of the derived source function flux to oceanic conditions it is assumed that the open ocean aerosol flux scales with bubble coverage based on the parameterisation in terms of whitecap coverage. Under these assumptions the oceanic size-resolved particle number flux is determined by multiplying the derived size resolved flux (dFp/dlogDp0) by the fractional whitecap coverage, W, as a function of wind speed:
dF0
dlogDp0=
dFp
dlogDp0
W= Q
Ab
dNT
dlogDp0
W (5)
where dF0/dlogDp is the size-resolved sea-spray source
flux. For determining the whitecap coveragethe formulation of Monahan and O’Muircheartaigh (1980) is applied:
W=3.84×10⁻⁶U103.41 (6)
104 105 106 107 108 109
dF
p
/dlogDp
0
fit (m
-2 s -1 )
104 105 106 107 108 109
dFp/dlogDp0 observed (m-2s-1) +40%
-40%
Fig. 13.Correlation between experimental and derived particle flux
using the parameterisation defined by Eqs. (1–4). The relative error indicated corresponds to the maximum deviation within the 95% limits.
Figure 14 shows the size-resolved particle source flux as a function ofDp0derived from the proposed parameterisation and others in the literature at a wind speed of 9 ms−1. The flux estimation for the exudate-free seawater case is com-parable to other parameterisations available in the submicron size range (M˚artensson et al., 2003; Clarke et al., 2006; Tyree et al., 2007). The novel source function, which extends the studied size range down to 3 nm, is able to account for the effect of the seawater organic matter on the shape of the size resolved flux. The highest impact of the organic matter on the flux distribution is observed for particle diameters below 100 nm. The sub-100 nm particle flux generated from sea-water with 300 µM OC<0.2µm is higher than that produced
from organic-free seawater with a multiplicative factor from 1.03 to 2. Particles in this size range can have an effect on the CCN formation. Although generally a minimum dry di-ameter of 80 nm is considered for cloud activation, observa-tions by Clarke et al. (2006) and Murphy et al. (1998) and modelling study by Pierce et al. (2006) suggests that parti-cles smaller than 80 nm can become effective CCN through heterogeneus growth and coagulation with other sub-80 nm particles. Furthermore, little is known on the effect that this organic matter can exert on the cloud activation properties of the sea-spray aerosol. Specific investigation on the cloud condensation activity of these particles is needed in order to determine the overall effect of the biogenic matter on cloud formation.
Total number source fluxes derived from the defined pa-rameterisation as a function of wind speed are compared in Fig. 15 with other submicron formulations obtained from laboratory measurements by M˚artensson et al. (2003) and
101 102 103 104 105 106 107
dF
0
/dlogDp
0
(m
-2 s -1 )
101 102 103 104
Dry diameter Dp0 (nm)
This study: seawater without exudate
This study: seawater with exudate: 300 µM OC<0.2 µm
This study: seawater with exudate: 512 µM OC<0.2 µm
Clarke et al., 2006 (surf zone) de Leeuw et al., 2000 (surf zone)
Mårtensson et al., 2003 (laboratory experiments, 25 °C) Monahan et al., 1986 (laboratory experiments)
Fig. 14. Comparison of the size-resolved source flux function
de-rived in this study at different diatomaceous OC<0.2µm concentra-tions and other formulaconcentra-tions available in literature (U10=9 m/s).
field measurements by Nilsson et al. (2001) and Geever et al. (2005). The results are also compared with the standard parameterisation of Monahan et al. (1986) and de Leeuw et al. (2000), both applied in the supermicron size range. The error bars in the source function derived in this study indi-cate an uncertainty of 45%, as derived from the variability in the particle size distribution measurements plus the mean de-viation associated with the data fitting procedure. As stated by M˚artensson et al. (2003), the supermicron size range ac-counts for a small fraction of the total particle flux. Compar-ison of the supermicron flux estimated using de Leeuw et al. (2000) and the submicron flux calculated with the proposed parameterisation indicates that the supermicron flux accounts for a small fraction (<2%) of total particle number flux. The source flux derived in this study is in agreement with the magnitude of particle fluxes estimated with other parameteri-sations comprising the submicron size range and particularly close to the curve of M˚artensson et al. (2003) for the case without algal exudate. According to the organic-dependent parameterisation, the presence of diatomaceous organic mat-ter at 300 µM OC<0.2µmconcentration causes an increase in the particle flux of ∼20% percent with respect to the case without marine surfactants.
103 104 105 106 107 108
F0
(m
-2 s -1 )
16 14 12 10 8 6 4 2 0
U10 (m/s)
Uncertainty in the flux estimation due to the whitecap method (L. & S., 2004) This study: seawater without exudate (whitecap method)
This study: seawater with exudate- 300 µM OC<0.2 µm (whitecap method) This study: seawater with exudate- 512 µM OC<0.2 µm(whitecap method) de Leeuw et al., 2000 (size range Dp0=1-5 microns) (whitecap method) Martensson et al., 2003 (lab., 25 °C) (whitecap method)
Monahan et al., 1986 (size range Dp0=1-10 microns) Geever et al., 2005
Nilsson et al., 2001
Parameterisations on the supermicron size range Parameterisations
including the submicron size range
Fig. 15.Comparison of total source flux derived in this study as a
function of the wind speed for organics-free seawater and seawater enriched with organic matter and other available parameterisations defined in the submicron and supermicron size regions in the liter-ature. Error bars are included for indication of the upper and lower bounds in the particle flux determination as a result of propagation of errors through the analysis procedure.
whitecap coverage measurements obtained by photographic studies has been plotted in Fig. 15. The large scatter in the measurements of whitecap coverage indicates that factors other than wind speed play a role in the determination of the whitecap fraction. Atmospheric stability, surface tem-peratures, surface current velocity, wind fetch and duration, salinity and surfactant concentration can also affect sea state and whitecap formation (Anguelova and Webster, 2006). Quantification of the effects of these factors on the whitecap coverage and, specifically, the effect due to the presence of biogenic surfactants is missing. Thereby, improvement in the determination of the whitecap coverage is important for reducing the uncertainty in studies where the whitecap method is applied (M˚artensson et al., 2003; Clarke et al., 2006; Tyree et al., 2007)
Within the limitations imposed by the uncertainty associ-ated to the determination of the whitecap fraction, the pa-rameterisation proposed in this study would potentially con-stitute a useful tool for the modeling of submicron aerosol primary fluxes in the 3–450 nm dry diameter range.
6 Relationship between chlorophyll-aand seawater
OC<0.2µmconcentration
In order to facilitate the use of the presented parameterisa-tion as a funcparameterisa-tion of ocean-related data, an approximaparameterisa-tion to link chl-a diatom biomass and organic carbon production is proposed. Analysis of water-leaving radiances measured by ocean color sensors (method PhySAT, Alvain et al., 2008) and the NASA Ocean Biogeochemical Model (Gregg et al., 2003) provide estimates of the global distribution of diatom biomass in the oceans. Also, recent progress has been made on the retrieval of the chl-a diatom biomass oceanic distribu-tion by applying the Differential Optical Absorpdistribu-tion Spec-troscopy method (PhytoDOAS) with input of phytoplank-ton differential absorption spectra from the satellite sensor SCIAMACHY (Bracher et al., 2009). It should be taken into account that ocean color data provide estimates rather than accurate information on the phytoplankton distribution in the oceans; however, the information derived from ocean-color products can be used as a first-order approximation of the marine biota distribution.
The origin of phytoplankton-derived organic carbon in seawater is the photosynthetic extracellular production and the liberation of cellular organic matter as a result of cell lysis (Myklestad, 2000). The mean life span of phytoplank-ton, considering cell mortality due to cell lysis, is∼23 days (Marba` et al., 2009), with approximately 10 days spent in the growth phase (Obernosterer and Herndl, 1995). Most of the organic matter released by phytoplankton is of la-bile and semilala-bile nature (Owaga and Tanque, 2003), which is degraded by bacteria within periods from days to several weeks.
Assuming a steady population phytoplankton population with a maximum bloom duration of the order of the typ-ical phytoplankton lifespan (23 days), a production bal-ance can be used as a first-order estimation of the amount of total organic matter resulting from extracellular re-lease (TOCextracell), cell lysis (TOClysis) and biodegradation (TOCbiodeg) during the algae lifetime as:
TOC=TOCextracell+TOClysis−TOCbiodeg=
tlysis
X
t=1
ERTOC·flysis·Chl-adiatom+
tgrazing
X
t=1
ERTOC·(1−flysis)·Chl-adiatom+
flysis·Chl-adiatom[C:Chl-adiatom] (7) where Chl-adiatom is the Chl-a diatom biomass concentra-tion, ERTOCis the specific extracellular production rate (µg C µg Chl-a−1h−1),t
lysisandflysisare the lifespan and the frac-tion of the biomass which dies by lysis, respectively,tgrazing is the lifespan of algal cells removed by grazing and