ISSN 1553-345X
© 2008 Science Publications
Corresponding Author: Ali Elkamel, Department of Chemical Engineering, University of Waterloo, 200 University Avenue West, Waterloo, ON N2T 2R8, Canada
Analysis and Optimization of Carbon Dioxide Emission
Mitigation Options in the Cement Industry
1
Mohammed Ba-Shammakh,
2Hernane Caruso,
2Ali Elkamel,
2Eric Croiset, and
2Peter L. Douglas
1
Department of Chemical Engineering, King Fahd University of Petroleum & Minerals,
Dhahran, Saudi Arabia
2
Department of Chemical Engineering, University of Waterloo, Waterloo, Ontario Canada N2L 3G1
Abstract: The cement industry is responsible for approximately 5% of global anthropogenic carbon dioxide emissions emitting nearly 900 kg of CO2 for every 1000 kg of cement produced. Effective
control strategies to mitigate these emissions are discussed and a mathematical programming model able to suggest the best cost effective strategy is outlined. Control costs consisting of operating and investment costs along with the efficiency of control options are taken into account in the model. A representative case study from the cement industry was considered in order to illustrate the use of the model in giving optimal control strategies. Efficiency improvement measures were found to be effective options for reduction targets up to 10 %. The model suggested that fuel switching and carbon capture must be considered at reduction targets higher than 10%. The cost of cement production was shown to increase dramatically with an increase in reduction target.
Key words: Cement industry, CO2 emissions, CO2 capture, process optimization
INTRODUCTION
The rapid deterioration of the global environment forces governments around the globe to increasingly take into consideration environmental issues. One of the most important and debated issues is the enhanced greenhouse effect due to greenhouse gases (GHG) emissions. The burning of fossil fuels releases more than six billion tonnes of carbon dioxide (CO2) into the
atmosphere each year [1]. The cement industry is among the industries that release the most CO2 to the
atmosphere. Concrete is the world’s most important construction material, and for each tonne of Portland cement (an essential component of concrete) produced, approximately one tonne of CO2 is emitted to the
atmosphere [2]. The cement industry generates approximately 5% of the global anthropogenic CO2
emissions [3]. This is mostly due to combustion at the manufacturing operations, transportation, and combustion of fossil fuel required to produce the electricity consumed by the cement industry. Environmental policies related to CO2 emissions can
potentially affect greatly the cement industry. Today, there are some economically acceptable alternatives for manufacturing an environmentally-friendly Portland cement, e.g. substitute materials and alternative fuels. Whatever alternatives are implemented, they must be
pragmatic. The possibility of making a profit with CO2
emissions is also a parameter that may impact the competitiveness of the cement industry.
CEMENT FABRICATION PROCESS
Portland cement manufacturing requires a precise mix of raw materials. This mix is commonly called the raw mix and mainly consists of two main natural raw materials: limestone (calcium carbonate-CaCO3) and
argillaceous materials. The cement industry must therefore start by quarrying limestone and clay. The main objective of raw material control is to produce a Kiln feed that will allow the production of a quality cement clinker, while conserving as much energy as possible. The cement clinker (clinker) requires a defined proportion of the elements calcium, silicon, aluminum, and iron; all these raw materials together with the fuel ash must combine and form the typical clinker composition. Figure 1 shows the process flow diagram of a typical cement plant [1].
sources it is necessary to blend and homogenize the raw material efficiently. The main objective of this step is to minimize impacts on the efficiency of the Kiln.
Fig.1: Process diagram of a typical cement plant The raw material burning or clinkering step takes place in the Preheater Tower and in the Kiln. The Preheater Tower is composed of a series of countercurrent flow cyclones that transfer heat from the Kiln to the raw materials. Some of the newest Preheater Towers have a section which contains a fuel combustion chamber, called precalciner. In this stage, calcination of the raw materials will start and CO2 will
be formed. The Kiln is the main piece of equipment in the cement plant and “are the world’s largest piece of moving industrial process equipment and one of the hottest” [4]. The Kiln is a long, horizontal, rotating, cylindrical pipe that is at least 60 m long and can be up to 200 m long and with diameters ranging from 3 to 9 m. Its internal surface is covered with refractory bricks.
The blended raw materials are fed in to the upper end of the Preheater Tower going all the way through the end of the rotary Kiln. The Kiln slowly rotates, approximately one to four revolutions per minute, and the raw material tumbles through increasingly hotter zones. The flame at one end of the Kiln can be fuelled by powdered materials such as coal, petroleum coke, or by natural gas, oil, and recycled materials. The heat will start a series of chemical reactions and the raw material becomes molten, and fuses together into modules, called clinker, which are the final product from the Kiln. The clinker is discharged red-hot from the end of the Kiln and conducted through different types of coolers to partially recover the thermal energy and lower the clinker handling temperature. The clinker coming out of the Kiln is approximately at 1500ºC. It is cooled in an air-cooled cooler. Ambient air is blown into the cooler to exchange heat between the hot clinker and the ambient air. After cooling the
clinker temperature drops to approximately 170ºC. The final step to produce cement is the cement grinding, where the clinker is ground together with additives in a cement mill. The cement mill is a horizontal metallic cylinder containing metallic balls. As it rotates the crushing action of the balls grinds and mixes the clinker and additives, forming the final product. The above description illustrates clearly the energy intensity of the different steps involved in the cement industry and the corresponding CO2 implications.
Several studies have been conducted to reduce CO2
emissions from the cement industry. Sheinbaum et al.
[5]
considered CO2 abatement costs through efficiency
improvement in Mexico. Hendriks et al.[6] shows that a wide range of options exists to reduce CO2 emissions
from a cement plant and provided cost data. Das and Kandpal [7] made an attempt to estimate CO2 emissions
from the cement industry in India. The impact of variations in product mixes and technology on CO2
emissions were also analyzed. Martin et al.[8] presented energy efficiency and CO2 emission reduction
opportunities in the U.S. cement industry. Carbon capture and storage (CCS) can also represent a promising option to reduce significantly CO2 emissions [1]
.
In this article, after identifying the various sources of CO2 in a cement plant and after introducing some possible mitigation measures, a mathematical programming model that will determines the optimal CO2 mitigation strategy with the least cost is presented.
The objective of the model is to minimize the total control cost consisting of operating costs and investment costs. The model takes into account the sources of CO2 emissions, cost, and efficiency of
control options. The model is then illustrated on a case study.
CO2 EMISSIONS IN CEMENT INDUSTRY
The main sources of carbon dioxide in cement manufacturing are combustion of fossil fuel and limestone calcinations. The most common fuels are coal, petroleum coke, fuel oil and natural gas. Currently, the cement industry in North America and Europe base its fuel choice on three basic factors: cost, product quality, and environmental impact. The fuel that best fills these three basic requirements will be the preferred choice. It is important to note that factors such as the cost of a new firing system, the amount of storage, and local fuel availability also play a key role in the decision process.
During the clinker process, limestone will suffer calcination and CO2 will be formed. The limestone
chemical reaction can be expressed by the equation below:
CaCO3 CaO + CO2 (1)
Prehe
Rot ary
l
Raw
Materia
Stock Raw Mill
Dedusting Plant
Blending Silos
Air quenching Cooler
Clinke r Silos
Additiv
es
Cement Mill
Cement Cooler
Cement Silos
The percentage of calcium oxide (CaO) in clinker is usually between 64 and 67 per cent. The balance is comprised of iron oxides, silicon oxides and aluminum oxides. The amount of CO2 generated by the process
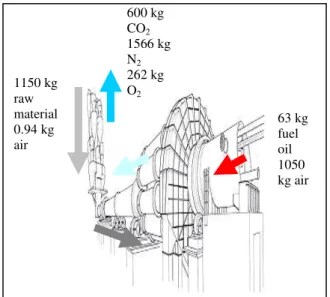
varies based on the specific loss of the raw materials (limestone) on ignition. An example of mass balance for for production of one tonne of cement is shown in Figure 2 [9].
There are other sources for CO2 emissions in a
cement plant, such as electricity and mobile equipments. These represent, however, a small contribution to the total CO2 generated by the cement
manufacturing. Approximately, half of the CO2 emitted
by the cement industry originates from the fuel and half from the calcinations (chemical reactions) that will convert raw materials into clinker [1].
Fig. 2: Typical cement plant mass balance CO2 MITIGATION OPTIONS
GHG mitigation has now become an important factor in creating a sustainable cement industry. Although regulated locally by different countries, the top 10 cement producers have their plants spread around the globe, and as part of a sustainability strategy, the cement industry is forced to reduce emissions. GHG mitigation has to overcome commercial and economical barriers. During the last 20 years environmental matters have had more influence in different global agreements; however, since solutions could result in a reduction in the profit margin of certain multinational corporations or adversely impact the economy of industrialized countries, the only possible solution is one that will offer environmental gains and strong business opportunities. In order to
achieve CO2 mitigation targets while promoting the
sustainability of the cement industry, below is a list of options that can impact on CO2 emissions.
Maintenance: One of the most important parts of a maintenance system is preventive maintenance. Preventive maintenance can increase plant efficiency and reduce the cost of corrective maintenance. One example of results delivered by a successful maintenance system is energy savings. Actions such as false air survey and control of the leaking point can significantly increase the kiln thermo efficiency. It is estimated that a simple air leak at the kiln hood can contribute to a 46 kJ/kg of clinker increase on the kiln thermal consumption [9].
Other strategies to reduce energy consumption include the gradual substitution of old motors by high-efficiency motors and the implementation of an integrated management system where the daily process routine contributes directly to increased maintenance effectiveness. The feeders and scales performance are examples of equipment that have direct influence on the kiln feed quality. A developed maintenance plan will support the kiln feed quality reducing the deviation on the material proportions which directly affect the fuel consumption. In general, a good maintenance program will contribute to an increase in the plant utilization ratio reducing the numbers of start-up and kiln preheats during the year [10]. Although not easily quantified, it is clear that a well structured maintenance program can highly contribute to emission reduction and plant performance improvement.
Plant Optimization: Plant optimization has been largely implemented in the cement industry not only as an action to reduce emissions, but also to promote higher kiln productivity and runtime. It is common knowledge in cement plants that many minor problems such as kiln seal leaks, cooler inefficiency, fuel atomization or fineness can compromise and impact plant performance. These problems alone can lead to thermal waste of up to six per cent. An optimization strategy should minimize fuel consumption and maximize clinker production correcting the clinker quality as required. The main idea is to make the process more consistent and reliable. For example, the operator might increase fan speed or reduce fuel injection based on the tower oxygen levels. It is estimated that such strategy can reduce heat consumption by three to five per cent and improve refractory life by 30 to 50 per cent [11].
Alternative Fuel and Pyroprocessing Improvements: The main opportunities for improvements and reduction 1150 kg
raw material 0.94 kg air
600 kg CO2
1566 kg N2
262 kg O2
of emissions associated with the cement industry are in the pyroprocess. As discussed previously, a large part of energy consumption, and consequently emission generation, takes place during the burning process. It is estimated that the average pyroprocess efficiency in the U.S. is about 34 per cent. Opportunities for improvement can be found mainly in process upgrades such as replacing wet systems and upgrading preheaters and precalciners. It is important to recognize that new burner designs and fuel systems can also play a considerable part in reducing emissions. New burners and fuel systems can contribute to reduced emissions by improving a cement plants’ flexibility to burn alternative fuels, and replacing high fossil carbon fuels with low fossil carbon fuels. An example of fuel substitution is the use of natural gas instead of coal. Some other types of alternative fuels include:
• Gaseous: refinery gases and landfill gas;
• Liquid: mineral oils, distillation residues, hydraulic oil; and,
• Solid: sewage sludge, plastic, tires, petroleum coke and tar.
Other impacts of alternative fuel on the plant operation are the refractory utilization rate and preheater tower pressure loss [12]. The organic portion will burn and generate energy required for the process. The mineral part will be integrated into the process and will contribute as raw material. Fly-ash is a typical example of alternative raw material that will contribute not only as a raw material but also as an energy source.
Replacement of Fossil Fuel by Waste-Derived Fuel (WDF): It is estimated that the use of waste-derived fuel (WDF) will increase by one per cent worldwide per year. The alternative implemented by some cement plants is to use approximately one per cent of WDF to replace fossil fuel [13]. It is important to note that this mitigation is indirect, because if these waste products had not been burned in cement kilns, they would have been incinerated or sent to a landfill, generating further CO2 emissions together with the CO2 generated by the
fossil fuel that was not replaced. This alternative has a potential to add great environmental value by solving the serious problem of waste disposal. Unfortunately, fossil fuel substitution by WDF is not an alternative supported by the general public. The public perception is that it would convert the cement kiln into a simple incinerator. This perception from the public pressures the local authorities to not consider this as a reasonable alternative to reduce fossil fuel consumption.
Raw Meal Burnability: The contribution of the raw materials burnability is difficult to measure. In general cement plants have targets for production improvement and profit margin when this alternative is considered. Raw materials fineness, composition and chemical module are the main improvements that must be made to achieve a constant raw material burnability. Such improvements could directly impact the amount of fuel used daily by the kiln. These improvements would also extend the refractory life cycle and reduce power consumption [14].
Use of By-products: This alternative can provide a practical solution to the usage of huge amounts of by-products generated, such as fly ash from power plants. In some cases like fly-ash, the by-product can contribute to improve concrete durability. This alternative needs to be studied locally to determine the availability and cost. European countries have been using by-products in high amounts. In general, it is important to note that cement standards need to be reviewed to accommodate the use of by-products as alternatives in the process of reducing GHG emissions [15].
Replacing Raw Material Limestone by Slag: Blast furnace slag is a non-metallic by-product from the iron production process. It is comprised of silicates, aluminosilicates, and calcium-alumina-silicates. By replacing raw material limestone with slag it is possible not only to prevent CO2 emissions due to
move materials. In general, the power used in the kiln corresponds to 40 to 50 kWh/tonne clinker. Power savings from the use of high efficiency motors will vary from plant to plant and from case to case. Most of the motor substitution is done during the replacement period when the motor life is nearly done. Another energy consumption point in the cement process is the adjustable speed drivers. Drivers are, in most cases, the largest power consumers in the cement process. Adjustable drivers can produce savings from 7 to 60 per cent [4]. These savings will be based on the application and the load applied to the motor and the application in the process.
New Preheater Tower: The preheater tower is a vital part of the process. A new preheater tower with low pressure drop cyclones will reduce the power consumption of the kiln fan system. It is possible to achieve a reduction of 0.6 to 1.1 kWh/t depending on the fan efficiency. A new installation can be expensive. In addition, installation and modification are site-specific, which makes it difficult to point out a general return on the investment. A new cyclone system can increase the overall dust transport cost [18]. This indicates that this solution is recommended for dry preheater and precalciner kilns older than 15 years of age.
Kiln Burner: Burner technology has improved quickly. A number of different burners have improved flame control and optimized fuel usage. One of the main objectives of the new burner technology is to create a more stable flame independent of the fuel type. Flame stability is one of the most important factors in maintaining a stable kiln operation and maximizing combustion effectiveness.
CO2 Capture and Disposal: Different methods for the
capture and disposal of CO2 at the point of combustion
have been researched and developed [1]. Examples of possibilities are: chemical stripping, membrane system, cryogenic separation and physical absorption. The implementation cost of each one of these possibilities is highly uncertain; costs are directly related to technical performance, economic growth and fuel type. Moreover, the disposal solutions available today present a great level of doubt regarding the technical feasibility for a full-scale implementation.
The CO2 concentration in a cement plant is higher
than in a power generation process. Studies have shown that the cement production process has a high quantity of low quality heat. This extra heat could be used in the CO2 capture process [19]. In general, the average cost to
capture one tonne of CO2 is estimated to be around
USD 50 [1].
Chemical scrubbing is considered to be the most mature process to capture CO2. The chemical stripping
method is based on Henry’s Law where the absorption depends on the temperature and pressure of the system. Chemical absorption is mainly applicable for a system where the exhaust gases present low concentration of CO2 and the system pressure is close to atmospheric
pressure. The main steps of the stripping method are absorption of CO2 by chemical solvents and recovery of
CO2 from chemical solvents by using low-grade heat
(usually extracted from power plants). One of the available technologies for removing CO2 from the gas
stream is chemisorption using monoethalnolamine. The design and costing of CO2 capture from cement plant
flue gas is similar to the design and costing of capturing CO2 from power plant using monoethalnolamine
[1]
. At a typical cement plant the cost for this method was estimated to be approximately $49-$54 per tonne of CO2 captured [1].
Physical absorption is another option for capturing CO2 and has its main application with low
concentration gases and vapors that are retained in a surface of porous solid materials. CO2 is held on the
surface of the porous material by (non-chemical) surface forces. The solid adsorbent material is regenerated using heat and the CO2 capture is complete [20]
.
Membrane systems are based on different physical and chemical interactions between the gas stream and the membrane material. Carbon dioxide capture by a membrane system is currently not considered as a common approach. The main obstacle for this technology is the necessity of multiple stages or cycles, which directly increases energy consumption and consequently, cost.
the cryogenic fraction method is based on the compression of the gas stream and subsequently, the gas temperature is reduced where the separation is possible by distillation. This method is mainly recommended in cases of high CO2 concentration (more
than 90 per cent) and therefore is not suitable for the cement industry.
As for CO2 disposal, the options are: discharge into natural gas reservoirs or aquifers, discharge deep into the ocean or reuse the CO2 in useful organic
compounds. Reviewing all the solutions available today, the ocean scenario has the highest capacity to store CO2, and absorbs the CO2 quantities generated by
a technical and economical option for CO2 disposal,
especially in the case of enhanced oil recovery and eventually coal bed methane recovery.
MATHEMATICAL MODEL
The above section illustrates clearly that there is a wide range of options that can be used to reduce CO2
emissions in the cement industry. These include:
• Improvement of the energy efficiency of the process
• Shifting to a more energy efficient process (e.g. from (semi) wet to dry process)
• Replacing high carbon fuels by low carbon fuels
• Removal of CO2 from the flue gases such as by
absorption (MEA process)
In order to help decision makers to adapt an appropriate CO2 reduction strategy, an optimization
model for the cement industry is presented in this section. The mathematical model consists of an objective function to be minimized and equality and inequality constraints. The objective of the model is to find the best strategy or mix of strategies to reduce CO2
up to a certain target with minimum overall cost for cement production while meeting the demand.
The objective function to be minimized can be written as:
($ / ) r r if if
r i f
if if ie ie ic ic
i f i e i c
Z yr C R C P
R X C Y C Z
= + +
+ +
(2)
Where:
Z : annualized capital and operating cost of the cement plant ($/yr)
Cr : cost of purchasing raw material r ($/tonne)
Rr : purchased amount of raw material r (tonne/yr)
Cif : operating cost for a unit i with fuel f ($/tonne)
Pif : amount produced from unit i using fuel f (tonne/yr)
Rif : annualized retrofit cost for switching unit i to run
with another fuel f ($/yr)
Xif : binary variable representing switching or not.
Cie : annualized cost of applying efficiency
improvement technology (e) on unit i ($/yr) Yie: binary variable representing applying efficiency
improvement technology (e) or not. Cic: annualized cost of applying CO2 capture
technology (c) on unit i ($/yr)
Zic: binary variable representing applying CO2 capture
technology (c) or not.
The first term in the objective function represents the cost associated with purchasing the raw material. The second term takes into account the operating cost for different units. The cost of switching to less carbon content fuel is shown in the third term. The fourth term represents the cost associated with applying efficiency improvement technologies. The remaining term adds the cost that results from applying CO2 capture
technology. A binary variable is defined for each CO2
mitigation option under study.
Constraints: The constraints for demand satisfaction, fuel selection and CO2 emissions reduction are
described as follows: a) Demand satisfaction
This constraint simply says that the total cement produced should be greater than or equal to the demand.
if i f
P ≥demand (3)
b) Fuel selection
Each unit i has to run with only one fuel f. For this reason, a binary variable is introduced to represent the type of fuel used in a given unit.
∀
=
f
if
i
X
1
(4)c) Emission constraint
The CO2 emitted from all units must satisfy a CO2
reduction target. Different technologies, e, to improve the efficiency are implemented in the mathematical model. It is assumed that the effect of these technologies is additive. The emission is also affected by applying CO2 capture technology.
(
)
2
2 2
1 1
1 %
if ie ie ic ic if
i f e c
CO e Y Z P
CO CO
ε
− −
≤ −
(5)
Where:
CO2if : CO2 emissions from unit i using fuel f (tonne per
tonne cement produced)
eie : percent gain in efficiency associated with
applying technology e on unit i
Yie: binary variable for applying efficiency
improvement technology e or not
εic : percent CO2 capture
Zic: binary variable for applying CO2 capture
% CO2: reduction target
CO2 : Current CO2 emissions (tonne/yr)
d) Selection of CO2 capture process to be installed
This constraint let the model select only one capture process for each unit i
i
Y
c
ic
≤
1
∀
(6)e) Non-negativity constraints
The amount produced must be greater than zero
i
P
if≥
0
∀
(7)The developed model is illustrated in the following case study.
Case Study
The problem of reducing CO2 emissions from
combustion sources within a cement plant is considered with three different mitigation options. The first option is the application of efficiency improvement technologies to reduce CO2 emissions. Table 1 shows
the different technologies considered in this study, along with their corresponding reduction in CO2
emissions. The second option for reducing CO2
emissions is the switching of fuel to a less carbon content fuel (e.g. switch from coal to natural gas). The third option is the application of CO2 capture
technologies.
An existing cement plant [22] with the following data was studied and the aim is to minimize the cost of cement production while reducing CO2 emissions by a
fixed target.
Cement production: 712,600 tonne/yr
Current total CO2 emissions: 553,800 tonne CO2/yr
Current total annualized cost: 25 x 106 $/yr
Three CO2 mitigation options will be considered and
these are:
• Applying efficiency improvement technologies to reduce CO2 emissions shown in Table 1.
• Switching to less carbon content fuel such as from coal to natural gas
• Applying “end of pipe” CO2 capture technologies.
The chemical absorption (MEA) process is the only considered option in this study with a cost of 50 $/tonne CO2 captured.
The model is first formulated as a mixed integer nonlinear model (MINLP). This model was then linearized using an exact linearization scheme similar to what we have employed in our previous work on
carbon dioxide mitigation in the power industry [23]. The resulting linearized model (mixed integer linear program or MILP) was coded in GAMS (General Algebraic Modeling System).
Table 1: Technologies for efficiency improvements
Technology % CO2
Reduction High efficiency motors and drives
Adjustable Speed Drives High efficiency classifiers Efficient grinding technologies Conversion from wet to dry process
4 5.5 8.1 10.5 50.0
DISCUSSION
The CO2 mitigation options discussed earlier were
incorporated into the model to select the least cost option to reduce CO2 emissions to a specified target.
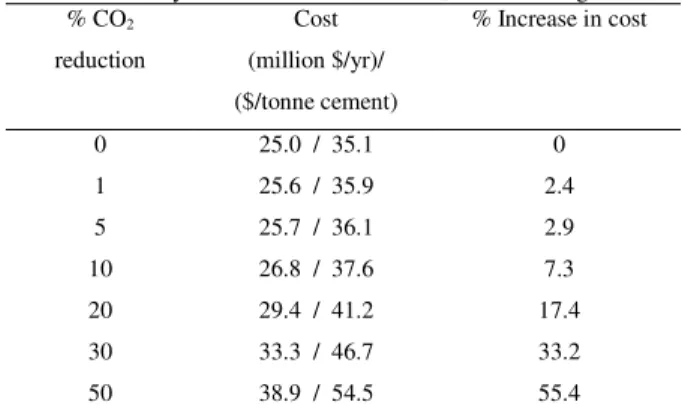
Different CO2 reduction targets were specified. Table 2
shows the results for different CO2 reduction targets.
For 1% reduction target, for example, the optimization process chose to apply the technology of high efficient motors and drives. The cost of production increased by about 2%. A second improvement technology was selected by the model at a reduction target of 5%. No fuel switching was applied up to 10 % where efficiency improvement technologies can be applied with an increase of about 7% in the cost. For a 20 reduction target, fuel switching, from coal to natural gas, was selected with only one technology for efficiency improvement (installation of high efficient motors and drives). The cost increased by about 17%. Carbon capture technology was selected at reduction targets higher than 30%. For a 50% reduction target, the optimization process still chose to apply capture technology.
Table 2: Summary of results for different CO2 reduction target
% CO2
reduction
Cost (million $/yr)/ ($/tonne cement)
% Increase in cost
0 1 5 10 20 30 50
25.0 / 35.1 25.6 / 35.9 25.7 / 36.1 26.8 / 37.6 29.4 / 41.2 33.3 / 46.7 38.9 / 54.5
Figure 3 shows the increase in the production cost for each CO2 reduction target. The line starts to sharply
increase at reduction targets ranging from 20 to 50%. This is expected since this is where optimization lead to decisions that employ CO2 capture options which have in general a much higher cost than other mitigation options.
0 10 20 30 40 50 60
0 5 10 15 20 25 30 35 40 45 50
% CO2 reduction
%
I
n
c
re
a
s
e
i
n
c
o
s
t
Fig. 3: Percent increase in cost for different CO2
reduction targets
CONCLUSIONS
An optimization model was developed in order to meet demand at a given CO2 reduction target. Three
mitigation options were considered. The model chose the best strategy or mix of strategies in order to meet a certain CO2 reduction target with the least cost
providing that the demand and other requirements were met. The model was formulated as a MINLP, exactly linearized, and then coded in GAMS.
It was found that the application of different efficiency improvement technologies represent good options especially at reduction targets up to 10%. Beyond this reduction target, fuel switching should be applied to achieve a reduction target such as 20%. At reduction targets higher than 20%, carbon capture technologies should be applied and efficiency improvement technologies are no more a good mitigation option. The cost of production increased dramatically when the reduction target is beyond 20 %. This is because carbon capture technologies were selected at these ranges and since these were the most expensive mitigation options. The cost per tonne Portland cement produced increased from 35.1 $/tonne to about 55 $/tonne which is about 20 $ increase for each tonne produced.
REFERENCES
1. Nazmul, S.M., E. Croiset, and P.L. Douglas, 2006. Techno-Economic study of CO2 capture from an
existing cement plant using MEA scrubbing. International Journal of Green Energy, 3: 1-24. 2. 2. Natural Resources Canada Climate Change
2006, ‘Cement and Concrete’, available: http://climatechange.nrcan.gc.ca (accessed: 15 March 2007).
3. IPCC. 2001. Climate Change 2001: the scientific basis. Intergovernmental Panel on Climate Change, Cambridge University Press, Cambridge, UK. 4. Choate, T.W., 2003. Energy and Emission
Reduction Opportunities for the Cement Industry, Industrial Technologies Program, U.S Department of Energy, Energy Efficiency and Renewable Energy, 14: 24-29.
5. Sheinbaum, C., I. Jauregui and L. Rodriguez, 1998. Carbon dioxide emission reduction scenarios in Mexico for year 2005. Mitigation and Adoption Strategies for Global Change, 2: 359-372.
6. Hendriks, C., E. Worrel, D. Dejager, K. Blok, and P. Riemer, 2004. Emission reduction of greenhouse gases from the cement industry. Greenhouse gas control technologies conference, 1-11.
7. Das, A. and T.C. Kandpal, 1997. Energy environment implications of cement manufacturing in India. Int. J. Energy Research, 21: 299-308. 8. Martin, N., E. Worrel, and L. Price, 1999. Energy
efficiency and carbon dioxide emissions reduction opportunities in the U.S. Cement Industry. Environmental energy technologies division report. 9. IEA Greenhouse Gas R&D, 1999. The reduction of greenhouse gas emissions from the cement industry. Report Number PH3/7, 25-49.
10. Saxena, J.P., 1995. Productivity improvements through reduction in Kiln downtime. World Cement, 26 (3), 64-68.
11. Votorantim 1994. Sistema especialista automatiza 25 linhas de cimento, Minérios/Minerales Magazine, São Paulo, 196, 28-29.
12. Grosse-Daldrup, H. and B. Scheubel, 1996. Alternative fuels and their impact on the refractory linings. Refratechnik Report, No. 45.
14. Gouda, G.R., 1977. Cement raw materials and their effect on fuel consumption. Rock Products, Chicago, 80 (10), 60-64.
15. Damtoft, J.S., 1998. Use of fly ash and other waste materials as raw feed and energy source in the Danish cement industry. Proceedings of Three-Day CANMET/ACI International Symposium on Sustainable Development of Cement and Concrete Industry, Ottawa, Canada, CANMET/ACI, 95-105. 16. Collins, R. J. and S.K. Ciesielski, 1994. Recycling and Use of Waste Materials and By-Products in Highway Construction. National Cooperative Highway Research Program Synthesis of Highway Practice 199, Transportation Research Board, Washington, DC, 1994.
17. Ehrenberg, A. 2002. CO2 emissions and energy
demand of granulated blast furnace slag. Proceedings of the 3rd European Slag Conference, EUROSLAG publication, 2, 151-166.
18. Jepsen, O.L. and K.P. Christensen, 1998. Improving fuel consumption and emissions by means of modern cooler, cyclone and calciner technology. Proceedings of WABE International Symposium on Cement and Concrete, Montreal, Canada, 5-15.
19. Thambimuthu, K.V., 2002. CO2 Capture and
Reuse. CANMET Energy Technology Centre, Natural Resources Canada IEA Greenhouse Gas R&D Programme Cheltenham, United Kingdom. 20. Cooper C. D. and F.C. Alley, 2002. Air Pollution
Control - A Design Approach.. Waveland Press, Inc., illinois.
21. Eckaus, R.S., H.D. Jacoby, A. D. Elterman, W.C. Leug W.C., and Z. Yang, 1997. Economical assessment of CO2 capture and disposal. Joint
Program on the Science and Policy of Global Change, Massachusetts Institute of Technology, Cambridge, MA.
22. Elkamel, A., A. Elgibaly, and W. Bouhamra, 1998. Optimal air pollution control strategies: the retrofitting problem. Advances in environmental research, 2 (3): 375-389.
23. Ba-Shammakh, M, A. Elkamel, P.L. Douglas, and E. Croiset, 2007. A mixed-integer nonlinear programming model for CO2 emission reduction in