www.atmos-chem-phys.net/16/15185/2016/ doi:10.5194/acp-16-15185-2016
© Author(s) 2016. CC Attribution 3.0 License.
Physical and optical properties of aged biomass burning
aerosol from wildfires in Siberia and the Western USA
at the Mt. Bachelor Observatory
James R. Laing1, Daniel A. Jaffe1,2, and Jonathan R. Hee1
1School of Science and Technology, University of Washington Bothell, Bothell, WA, USA 2Department of Atmospheric Science, University of Washington, Seattle, WA, USA
Correspondence to:Daniel A. Jaffe ([email protected])
Received: 15 June 2016 – Published in Atmos. Chem. Phys. Discuss.: 30 June 2016 Revised: 14 October 2016 – Accepted: 17 October 2016 – Published: 8 December 2016
Abstract. The summer of 2015 was an extreme forest fire year in the Pacific Northwest. Our sample site at the Mt. Bachelor Observatory (MBO, 2.7 km a.s.l.) in central Oregon observed biomass burning (BB) events more than 50 % of the time during August. In this paper we charac-terize the aerosol physical and optical properties of 19 aged BB events during August 2015. Six of the 19 events were in-fluenced by Siberian fires originating near Lake Baikal that were transported to MBO over 4–10 days. The remainder of the events resulted from wildfires in Northern California and Southwestern Oregon with transport times to MBO rang-ing from 3 to 35 h. Fine particulate matter (PM1), carbon
monoxide (CO), aerosol light scattering coefficients (σscat),
aerosol light absorption coefficients (σabs), and aerosol
num-ber size distributions were measured throughout the cam-paign. We found that the Siberian events had a significantly higher1σabs/1CO enhancement ratio, higher mass
absorp-tion efficiency (MAE; 1σabs/1PM1), lower single
scatter-ing albedo (ω), and lower absorption Ångström exponent
(AAE) when compared with the regional events. We sug-gest that the observed Siberian events represent that portion of the plume that has hotter flaming fire conditions and thus enabled strong pyroconvective lofting and long-range trans-port to MBO. The Siberian events observed at MBO there-fore represent a selected portion of the original plume that would then have preferentially higher black carbon emissions and thus an enhancement in absorption. The lower AAE val-ues in the Siberian events compared to regional events indi-cate a lack of brown carbon (BrC) production by the Siberian fires or a loss of BrC during transport. We found that mass
scattering efficiencies (MSE) for the BB events ranged from 2.50 to 4.76 m2g−1. We measured aerosol size distributions with a scanning mobility particle sizer (SMPS). Number size distributions ranged from unimodal to bimodal and had ge-ometric mean diameters (Dpm)ranging from 138 to 229 nm
and geometric standard deviations (σg)ranging from 1.53 to
1.89. We found MSEs for BB events to be positively corre-lated with the geometric mean of the aerosol size distribu-tions (R2=0.73), which agrees with Mie theory. We did not
find any dependence on event size distribution to transport time or fire source location.
1 Introduction
15186 J. R. Laing et al.: Physical and optical properties of aged biomass burning aerosol Biomass burning is a major contributor to global aerosol
bur-den and it has been predicted that these emissions are likely to increase due to climate change, particularly in the boreal forests of North America and Russia (Flannigan et al., 2009; Stocks et al., 1998) and in the Western USA (Y. Liu et al., 2014; Westerling et al., 2006). This makes the proper char-acterization of aged BB emissions even more important.
Currently there are few field measurements of well-aged BB emissions. Our knowledge of BB aerosol primarily comes from laboratory experiments and near-field measure-ments taken within a few hours of a wildfire (May et al., 2015, 2014; Okoshi et al., 2014; Vakkari et al., 2014; Yokel-son et al., 2013b, 2009). Holder et al. (2016) showed that lab-oratory measurements of aerosol optical properties do not ac-curately reproduce field measurements. Freshly emitted BB particles are small in diameter (30–100 nm) (Hosseini et al., 2010; Levin et al., 2010). As the plume ages, the aerosol undergoes rapid chemical and physical changes on the time scale of minutes to hours (Reid et al., 2005a, b; Vakkari et al., 2014). The change in particle size is due to coagulation and the condensation of organic material onto the existing parti-cles (Reid et al., 2005b; Seinfeld and Pandis, 2006). The co-agulation rate can be very high in fresh BB plumes since this is equivalent to the square of particle number concentration. This process increases the size of the particles while decreas-ing the number concentration. Condensation of secondary organic aerosol (SOA) onto particles in BB plumes also in-creases particle size. The condensation of SOA is counter-balanced by the loss of primary organic aerosol, which can evaporate during plume dilution (May et al., 2015, 2013). The net condensation/evaporation effect is highly variable. Some studies have observed an increase in mass with plume age due to SOA production (Briggs et al., 2016; Hobbs, 2003; Vakkari et al., 2014; Yokelson et al., 2009), while others have observed limited SOA formation (Akagi et al., 2012; Jolleys et al., 2015). All of these uncertainties in the aging process of biomass burning underscores the importance of characteriz-ing the physical and optical properties of well-aged biomass burning aerosol.
In this study we analyze 19 aged BB events observed in the summer of 2015 at Mt. Bachelor in Oregon. The BB events consisted of regional events (fires in Northern California and Southwestern Oregon; transported 3–35 h) and Siberian fire events (fires around Lake Baikal; transported 4–10 days). We investigated the aerosol optical and physical properties of these events and explored their variation with source loca-tion and transport time. This study addresses the following questions:
– What are the differences in the optical properties of re-gional and Siberian BB events observed at Mt. Bachelor Observatory (MBO)?
– What is the range of mass scattering efficiencies for BB events and what explains their variability?
– What is the range in aerosol size distributions of BB events at MBO and how does this vary with plume age?
2 Methods
2.1 Mt. Bachelor Observatory
The Mt. Bachelor Observatory is a mountaintop site that has been in operation since 2004 (Jaffe et al., 2005). It is lo-cated at the summit of Mt. Bachelor in central Oregon, USA (43.98◦N, 121.69◦W; 2764 m a.s.l.). A suite of measure-ments (including carbon monoxide, CO, ozone, O3, aerosol
scattering coefficients, and more) have been made contin-uously at the summit site. Previous studies have observed BB plumes in the free troposphere from regional and distant sources in the spring, summer, and fall (Baylon et al., 2015; Briggs et al., 2016; Collier et al., 2016; Timonen et al., 2014; Weiss-Penzias et al., 2007; Wigder et al., 2013) and long-range transport of Asian pollution in the spring (Ambrose et al., 2011; Fischer et al., 2010a, b; Gratz et al., 2014; Jaffe et al., 2005; Reidmiller et al., 2010; Timonen et al., 2014, 2013; Weiss-Penzias et al., 2006). During the summer of 2015 an intensive field campaign was performed at MBO to measure aerosol physical and optical properties of wildfire emissions.
2.2 CO, CO2, and meteorological data
CO and CO2 measurements were made using a
Pi-carro G2302 cavity ring-down spectrometer. Calibrations were performed every 8 h using three different National Oceanographic and Atmospheric Administration (NOAA) calibration gas standards, which are referenced to the World Meteorological Organization’s (WMO) mole fraction cali-bration scale (Gratz et al., 2014). Total uncertainty based on the precision of calibrations over the campaign was 3 %. Ba-sic meteorology measurements, such as temperature, humid-ity, and wind speed, were also measured continuously (Am-brose et al., 2011).
2.3 Aerosol instruments
We measured dry (relative humidity (RH) less than 35 %) aerosol scattering and absorption coefficients, aerosol num-ber size distribution, and particle mass during the 2015 sum-mer campaign in 5 min averages. An inline 1 µm impactor was located prior to the aerosol instruments. The aerosol instruments were located in a temperature-controlled room within the summit building, situated approximately 15 m be-low the inlet. The aerosol sample line was situated such that the last 2.5 m was located within a space that was tempera-ture controlled at 20±3◦C, typically 10–20◦C warmer than ambient. RH of the sampled air was less than 35 % through-out the campaign. The temperature increase from going through- out-side into the heated building reduced the RH of the sample. RH was measured in the sample airstream by the
ter and scanning mobility particle sizer (SMPS). The average RH during the campaign measured by the nephelometer and SMPS was 22.1 and 22.6 %, respectively. Ninety-five percent of the 5 min averaged samples had an RH less than 30 %.
We measured multi-wavelength aerosol light scatter-ing coefficients (σscat) using an integrating nephelometer
(model 3563, TSI Inc., Shoreview, MN) at wavelengths 450, 550, and 700 nm. During the 2015 campaign the TSI neph-elometer was periodically switched to measure both particle free air and CO2. The measured values were corrected for
offset and calibration drift in addition to angular nonideali-ties (Anderson and Ogren, 1998). The filtered air and CO2
were measured approximately every 2 weeks (Anderson and Ogren, 1998). The data reduction and uncertainty analysis that we followed for the scattering data are outlined by An-derson and Ogren (1998). Sources of uncertainties associated with the nephelometer include photon counting noise, zero-ing and calibration, and the correction for angular nonideali-ties. Combined these uncertainties yielded total uncertainties of∼15 % during BB events.
We measured aerosol light absorption coefficients (σabs)
with a 3λ tricolor absorption photometer (TAP, Brechtel
Inc., Hayward, CA) at wavelengths 467, 528, and 660 nm. Throughout the paper σscat and σabs values represent
mea-surements taken at 550 and 528 nm, respectively. The TAP is a new instrument that uses the same operating princi-ple as the Particle Soot Absorption Photometer (PSAP) and the same filters (47 mm PALL E70-2075W). Unlike the PSAP, the TAP rotates through eight filter spots per indi-vidual filter along with two reference spots. During deploy-ment at MBO, the TAP was set to rotate to the next filter spot when a filter spot’s transmission reached 50 %. The absorp-tion coefficients were corrected using the filter loading and aerosol scattering correction factors derived for the 3λPSAP
by Virkkula (2010). Uncertainty calculations were based on those used in a previous study at MBO for measurements with a 3λ PSAP (Fischer et al., 2010a). Sources of
uncer-tainty include noise, instrument drift, errors in the loading function, the correction for the scattering artifact, and uncer-tainty in the flow and spot size corrections (Anderson et al., 1999; Bond et al., 1999; Virkkula et al., 2005). Combining these uncertainties yielded total uncertainties of∼25–40 % during BB events.
Single scattering albedo (ω)for each event was calculated
as the reduced major axis (RMA) regression of scattering and total extinction (scattering +absorption) coefficient at 528 nm. To adjust theσscatvalue from 550 to 528 nm, a power
law relationship was assumed between scattering and wave-length. The 450–550 nm pair was used to adjust the 550 nm
σscatmeasurement to 528 nm using Eq. (1):
σscat528=σscat550×
λ550 λ528
SAE450,550
, (1)
whereλis wavelength and SAE is the scattering Ångström
exponent calculated with the two wavelengths specified. The SAE values were calculated for each 5 min interval using the scattering coefficients measured at 450 and 550 nm. Mean SAE values for the BB plumes ranged from 1.61 to 2.15. Uncertainties forωwere calculated the same as the
enhance-ment ratios (ERs), which is discussed in Sect. 2.4.
Absorption Ångström exponent (AAE) values were calcu-lated for the absorption coefficient pair of 467 and 660 nm using Eq. (2):
AAE= − log
σabs467 σabs660
log467660 . (2)
Uncertainties for AAE values were calculated by propagating the uncertainties from the measurements used to calculate AAE using addition in quadrature (Fischer et al., 2010a).
We measured 5 min averaged dry aerosol number size dis-tribution with a TSI 3938 SMPS. The SMPS system con-sisted of a TSI 3082 electrostatic classifier with a TSI 3081 differential mobility analyzer (DMA) and a TSI 3787 water-based condensation particle counter. A total of 107 bins were used to measure a diameter range from 14.1 to 637.8 nm. A sheath to aerosol flow ratio of 10 : 1 was used for the DMA. A multiple charge correction and diffusion loss correction were applied to the SMPS particle number concentration data using the TSI software. An additional diffusion correction for the inlet tube (15 m, 12 L min−1) was applied assuming a laminar flow (Hinds, 1999). Prior to deployment we con-firmed the sizing accuracy of the SMPS using polystyrene latex spheres.
We measured dry particle mass under 1 µm (PM1) with
an optical particle counter (OPC, model 1.109, Grimm Tech-nologies, Douglasville, GA). This is a US EPA equivalent method for measuring PM2.5mass concentration. The OPC was factory calibrated prior to deployment.
All particle measurements (σscat,σabs, PM1, number size
distribution) were corrected to standard temperature and pressure (STP;T =273.15,P =101.325 kPa).
2.4 Enhancement ratio calculations
ERs (1Y /1X) were calculated from the slope of the RMA
regression ofY plotted againstX. Briggs et al. (2016)
cal-culated ERs of BB plumes using three different methods: one method using the RMA slope of the linear correlation of two species and two others calculating absolute enhance-ment above local background using two different definitions of background. All three methods produced similar results for1σscat/1CO, 1NOy/1CO, and PAN/1CO but
differ-ing results for1O3/1CO. In our study we used the RMA
15188 J. R. Laing et al.: Physical and optical properties of aged biomass burning aerosol Mass scattering and mass absorption efficiencies (MSE
and MAE) were calculated as the ERs of1σscat/1PM1and 1σabs/1PM1, respectively, at 550 nm for σscatand 528 nm
for σabs. As previously mentioned,ωwas calculated as the
RMA regression of scattering and total extinction (scatter-ing + absorption). In all cases the enhancements (1) are
large compared to background, thus avoiding the problems described by Briggs et al. (2016) for small enhancements above background.
We determined the uncertainties for the ER calculations from the uncertainties in the extensive properties used in cal-culating the ERs and the uncertainty of the RMA regression using addition in quadrature. For example, the uncertainty in
1X/1Y was calculated by adding in quadrature the
uncer-tainty in the RMA regression, the unceruncer-tainty in theX
mea-surement, and the uncertainty in theY measurement.
We present both precision uncertainty and total uncer-tainty as described by Anderson et al. (1999) for all values derived from optical measurements. Precision uncertainty in-cludes uncertainty associated with noise and instrument drift. This is best used when comparing measurements collected using the same instruments and protocols. It is the appropri-ate uncertainty to consider when comparing individual BB events seen at MBO in this study. Total uncertainty includes precision uncertainty, the uncertainty associated with the cor-rections we applied to the data, and the uncertainty asso-ciated with the calibration method. This is the appropriate uncertainty to consider when comparing the measurements presented in this study with data collected using other mea-surement methods.
2.5 Biomass burning event identification
We identified BB events as time periods during which 5 min ambient aerosol scattering coefficientsσscat> 20 Mm−1for at
least 1 h, 5 min CO > 150 ppbv for at least 1 h, and there was a strong correlation (R2> 0.80) betweenσscatand CO. To
de-termine fire locations we calculated back trajectories using the National Oceanic and Atmospheric Administration Hy-brid Single-Particle Lagrangian Integrated Trajectory (HYS-PLIT) model, version 4 (Draxler, 1999; Draxler and Hess, 1997, 1998; Stein et al., 2015). We used the Global Data As-similation System (GDAS) 1◦×1◦ gridded meteorological data from the NOAA’s Air Resources Laboratory (NOAA-ARL). Within GDAS, the grid containing MBO is located at ∼1500 m a.m.g.l. (above model ground level) so back-trajectory starting heights of 1300, 1500, and 1700 m a.m.g.l. were chosen (Ambrose et al., 2011). We identified fire loca-tions using Moderate Resolution Imaging Spectroradiome-ter (MODIS) satellite-derived active fire counts (Justice et al., 2002) and Fire INventory from NCAR (FINN) data (Wiedinmyer et al., 2011). Similar criteria for identifying BB events have been used by Baylon et al. (2015) and Wigder et al. (2013) from data collected at MBO.
3 Results and discussion
3.1 Identified BB events and fire source identification The summer of 2015 was a very active fire season in the Pa-cific Northwest. During the month of August 2015, 51 % of the 5 min averages met the criteria for a BB event, having
σscat> 20 Mm−1and CO > 150 ppbv, including several
multi-day periods (Fig. 1). We split these multi-multi-day events up when discernable plumes within the event could be identified. Al-together we identified 19 events, ranging from 1.5 to 45 h in duration. We use the term event, not plume, because of the long duration of some of the events and the fact that most BB events observed in 2015 were influenced by emissions from multiple fires.
Two large multi-day events of regional BB smoke from fires in Northern California and Southwestern Oregon dom-inated the sampling period (dotted box in Fig. 1). Transport time from these regional fires to MBO, estimated from the back trajectories, ranged from 3 to 35 h. In between these two large regional BB events there was a time period that was influenced by Siberian wildfires (solid box in Fig. 1). During August there were intense forest fires around Lake Baikal in Siberia, peaking on 8 August 2015 with a total fire area of 681 km2, and an estimated CO and BC
emis-sions of 3.22×10⁸ and 1.33×10⁶kg day−1, respectively (FINN data) (Wiedinmyer et al., 2011). Transport times from Northeast Asia to MBO during these events ranged from 4 to 10 days. NASA MODIS Aqua and Terra images show the eastward transport of smoke from the Lake Baikal fires during this time period (NASA, 2016b). We used V3.30 aerosol classification products from the Cloud-Aerosol Lidar with Orthogonal Polarization (CALIOP) instrument on the Cloud-Aerosol Lidar Infrared Pathfinder Satellite Observa-tion (CALIPSO) satellite to confirm the transport of plumes of smoke from the Siberian fires to North America (NASA, 2016a; Winker et al., 2010, 2009). Aerosol plumes are iden-tified as one of six types: dust, polluted continental, polluted dust, smoke (biomass burning), clean continental, or clean marine aerosols (Omar et al., 2009).
3.2 Overview of summer 2015 BB events
Table 1 provides an overview of the 19 BB events from MBO during the summer of 2015. We calculated water vapor en-hancement (1WV) to indicate the origin of the event air
mass. Positive 1WV suggest the air mass ascended from
the boundary layer (BL) to MBO, while near zero or neg-ative values mean the air mass is relneg-atively dry and likely descended or arrived from the free troposphere (Baylon et al., 2015; Wigder et al., 2013). All of the regional BB events have1WV values≥1.00 g kg−1, while all of the Siberian-influenced events have1WV values near zero or negative.
The precision and total uncertainties for all of the parameters
Figure 1.Time series of CO, PM1, and aerosol scattering (σscat)at MBO during August. Threshold values (dashed black lines) used for BB
event criteria are displayed for CO (150 ppbv) and scattering (20 Mm−1). The dotted boxes represent multi-day periods of regional BB and encompasses events 2–8 and 16–19, respectively. The solid box represents the period influenced by Siberian BB and encompasses events 10–15.
derived from optical measurements are provided for these events in Table S1 in the Supplement.
We found the1σscat/1CO (σscatat STP) ER to range from
0.48 to 1.29 Mm−1ppbv−1, with the majority of events being between 0.8 and 1.25 Mm−1ppbv−1. We found1PM
1/1CO
(PM1 at STP) to range from 0.18 to 0.43 µg cm−3ppbv−1.
These values are in the same range as BB plumes seen previ-ously at MBO (Baylon et al., 2015; Wigder et al., 2013).
In 2015 many fires were burning throughout the north-western USA. Thus, in contrast to previous work at MBO, we were not able to calculate transport time for any of the regional BB events observed as they were influenced by mul-tiple fires with various transport times. Figure 2 provides an example of this and exemplifies the impossibility of deter-mining an exact transport time.
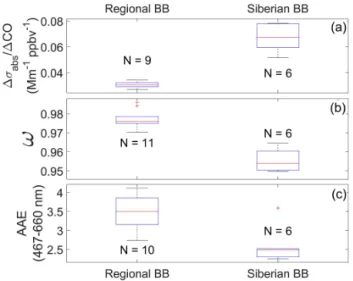
3.3 Optical properties of the BB aerosol at MBO We observed significant differences in the optical properties of regional and influenced BB events. The Siberian-influenced events had higher absorption coefficients relative to other measurements. This resulted in higher1σabs/1CO,
higher MAE (1σabs/1PM1), and lower ω (σscat/(σscat+
σabs))compared to regional BB events (Figs. 3 and 4). We
found no significant differences for 1σscat/1CO or MSE
(1σscat/1PM1) between regional and Siberian events. Back
trajectories for the Siberian events (events 10–15) origi-nated at high elevation over Siberia, suggesting that the BB emissions were lofted to altitudes of 4–10 km (Fig. 5). The Siberian events at MBO were observed over the course of a week (17–23 August 2015); therefore the back trajecto-ries in Fig. 5 represent a sustained meteorological pattern that consistently transported Siberian smoke to North Amer-ica throughout the week. Aerosol vertAmer-ical profiles measured by CALIOP corroborate the transport of BB plumes from the Siberian fires across the Pacific at altitudes of 4–10 km.
Figure 2.HYSPLIT back trajectories for Event 19. The blue back trajectories have a starting height of 1700 m a.m.g.l. (above model ground level), the green a starting height of 1500 m a.m.g.l., and the red a starting height of 1300 m a.m.g.l. The squares are MODIS fire spots from 27 to 29 August 2015 and are colored based on their fire radiative power (FRP).
Large BB plumes were identified over Northeast Asia and the North Pacific consisting primarily of BB smoke and some polluted dust over the North Pacific from 8 to 17 August 2015. Figures S1–S4 show selected CALIPSO transects from 13 to 16 August 2015 over the Pacific. The location and al-titude of these plumes match the back trajectories calculated from MBO for the Siberian events (Fig. 5), verifying that events 10–15 are heavily influenced by the Siberian fires.
15190
J
.
R.
Laing
et
al.:
Ph
ysical
and
optical
pr
operties
of
aged
biomass
b
ur
ning
aer
osol
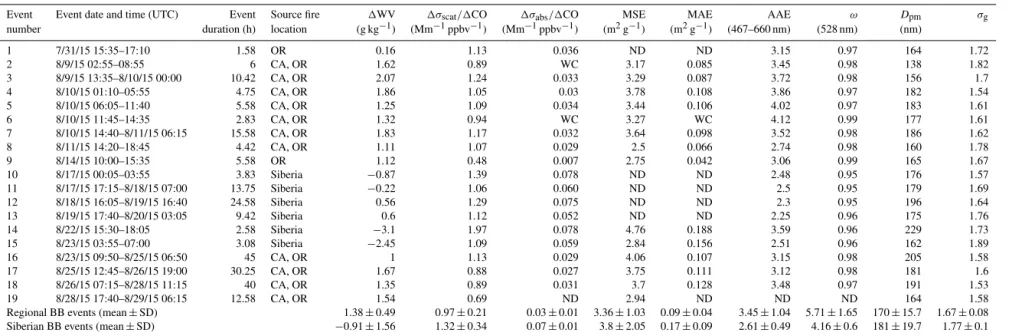
Table 1.Identified BB plumes at MBO during the summer of 2015. All enhancement ratios are obtained by taking the slope of a RMA linear regression between the two species. ND
(“no data”) indicates missing data. WC in the MAE column signifies a weak correlation (R2< 0.60).
Event Event date and time (UTC) Event Source fire 1WV 1σscat/1CO 1σabs/1CO MSE MAE AAE ω Dpm σg
number duration (h) location (g kg−1) (Mm−1ppbv−1) (Mm−1ppbv−1) (m2g−1) (m2g−1) (467–660 nm) (528 nm) (nm)
1 7/31/15 15:35–17:10 1.58 OR 0.16 1.13 0.036 ND ND 3.15 0.97 164 1.72
2 8/9/15 02:55–08:55 6 CA, OR 1.62 0.89 WC 3.17 0.085 3.45 0.98 138 1.82
3 8/9/15 13:35–8/10/15 00:00 10.42 CA, OR 2.07 1.24 0.033 3.29 0.087 3.72 0.98 156 1.7
4 8/10/15 01:10–05:55 4.75 CA, OR 1.86 1.05 0.03 3.78 0.108 3.86 0.97 182 1.54
5 8/10/15 06:05–11:40 5.58 CA, OR 1.25 1.09 0.034 3.44 0.106 4.02 0.97 183 1.61
6 8/10/15 11:45–14:35 2.83 CA, OR 1.32 0.94 WC 3.27 WC 4.12 0.99 177 1.61
7 8/10/15 14:40–8/11/15 06:15 15.58 CA, OR 1.83 1.17 0.032 3.64 0.098 3.52 0.98 186 1.62
8 8/11/15 14:20–18:45 4.42 CA, OR 1.11 1.07 0.029 2.5 0.066 2.74 0.98 160 1.78
9 8/14/15 10:00–15:35 5.58 OR 1.12 0.48 0.007 2.75 0.042 3.06 0.99 165 1.67
10 8/17/15 00:05–03:55 3.83 Siberia −0.87 1.39 0.078 ND ND 2.48 0.95 176 1.57
11 8/17/15 17:15–8/18/15 07:00 13.75 Siberia −0.22 1.06 0.060 ND ND 2.5 0.95 179 1.69
12 8/18/15 16:05–8/19/15 16:40 24.58 Siberia 0.56 1.29 0.075 ND ND 2.3 0.95 196 1.64
13 8/19/15 17:40–8/20/15 03:05 9.42 Siberia 0.6 1.12 0.052 ND ND 2.25 0.96 175 1.76
14 8/22/15 15:30–18:05 2.58 Siberia −3.1 1.97 0.078 4.76 0.188 3.59 0.96 229 1.73
15 8/23/15 03:55–07:00 3.08 Siberia −2.45 1.09 0.059 2.84 0.156 2.51 0.96 162 1.89
16 8/23/15 09:50–8/25/15 06:50 45 CA, OR 1 1.13 0.029 4.06 0.107 3.15 0.98 205 1.58
17 8/25/15 12:45–8/26/15 19:00 30.25 CA, OR 1.67 0.88 0.027 3.75 0.111 3.12 0.98 181 1.6
18 8/26/15 07:15–8/28/15 11:15 40 CA, OR 1.35 0.89 0.031 3.7 0.128 3.48 0.97 191 1.53
19 8/28/15 17:40–8/29/15 06:15 12.58 CA, OR 1.54 0.69 ND 2.94 ND ND ND 164 1.58
Regional BB events (mean±SD) 1.38±0.49 0.97±0.21 0.03±0.01 3.36±1.03 0.09±0.04 3.45±1.04 5.71±1.65 170±15.7 1.67±0.08 Siberian BB events (mean±SD) −0.91±1.56 1.32±0.34 0.07±0.01 3.8±2.05 0.17±0.09 2.61±0.49 4.16±0.6 181±19.7 1.77±0.1 1WV is water vapor enhancement, calculated for each event by subtracting the average WV for the summer sampling period from the WV value at the time when maximum CO was observed.
Aerosol scatteringσscat(550 nm) and absorptionσabs(528 nm) measurements were converted to STP.
MSE and MAE calculated as the1σscat/1PM1and1σabs/1PM1enhancement ratios, respectively.
Dpmis the geometric mean diameter andσgis the geometric standard deviation of the SMPS aerosol size distribution. WC indicates a weak correlation in the MAE column (R2< 0.60). ND indicates missing data. PM data were not available for events 1 and 10–13; absorption data were not available for events 19 and 20.
Atmos.
Chem.
Ph
ys.,
16,
15185–
15197
,
2016
www
.atmos-chem-ph
Figure 3. Scatter plots of (a)mass absorption efficiency (MAE) and(b)absorption enhancement ratio1σabs/1CO vs. single
scat-tering albedo (ω). MAE values were not calculated for four of the
six Siberian-influenced events due to missing PM1data.
Figure 4.Box plots of(a)1σabs/1CO,(b)single scattering albedo (ω) measured at 528 nm, and (c)absorption Ångström exponent (AAE) for absorption measurements at 467 and 660 nm for regional BB events and Siberian-influenced events.Nindicates the number
of events for each box. Lower and upper whiskers represent the min-imum and maxmin-imum values, respectively. Lower and upper lines of the box represent the 25th and 75th percentiles, respectively. The red line in the middle of the box represents the median, and the red plus mark represents outliers.
loft the plume high into the atmosphere where it can then undergo long-range transport. During the ARCTAS-A flight campaign in Alaska, Siberian fire plumes were found to have a much larger BC/CO ratio (8.5±5.4 ng m−3ppbv−1)
than North American fire plumes (2.3±2.2 ng m−3ppbv−1)
(Kondo et al., 2011). This difference was attributed to the Siberian fires having a higher modified combustion effi-ciency (MCE). In addition, for the Siberian BB plumes they found MCE to increase with altitude. Jolleys et al. (2015) correspondingly found higher 1BC/1OA (1black
car-bon/1organic aerosol) ratios to increase with altitude in
Eastern Canadian BB plumes. Intense, flaming fire plumes have higher injection heights into the atmosphere due to en-hanced pyroconvection, whereas smoldering fires have low thermal convective energy and are mostly contained within
Figure 5. Most of the HYSPLIT back trajectories for Siberian events (events 10–15) plotted as a function of altitude. Roughly 10 % of the back trajectories that did not follow the main transport track were not plotted. Forest fires from 7 to 16 August 2015 iden-tified by the Fire INventory from NCAR (FINN) fires are marked by red squares. These transects are not sequential and do not track one plume of Siberian smoke, but rather they illustrate the extensive eastward transport of Siberian smoke over the course of the week. The four black boxes represent the locations of smoke plumes iden-tified by CALIPSO cross sections detailed in Figs. S1–S4.
the BL. BB aerosol lofted to the free troposphere via py-roconvection is less likely to be removed and can have a longer atmospheric lifetime of up to 40 days (Bond et al., 2013). The back trajectories for the Siberian events corrobo-rate this idea. They were all relatively dry (water vapor mix-ing ratio < 5 g kg−1)with little precipitation during transport, suggesting the aerosol in the Siberian events was subjected to very limited wet deposition, which is the main removal mechanism from the atmosphere. Flaming conditions pro-duce more BC and less OA generally, which leads to ampli-fied absorption (Vakkari et al., 2014; Yokelson et al., 2009). Flaming conditions are associated with high MCE values (Reid et al., 2005a). Unfortunately, we were not able to cal-culate MCE values for the Siberian events at MBO due to extensive dilution and boundary layer mixing during trans-port (Yokelson et al., 2013a).
While the ω values for the Siberian events are
signifi-cantly lower relative to the regional events, they are all high (> 0.95) compared to typical flaming conditions measured in the laboratory or near-field measurements (S. Liu et al., 2014; Vakkari et al., 2014). S. Liu et al. (2014) found a robust re-lationship betweenωand MCE in laboratory BB emissions
where MCE was negatively correlated withω. However,
ob-servations have found thatωincreases significantly hours
af-ter emission in BB plumes (Reid et al., 2005a; Vakkari et al., 2014). A previous study at MBO found that well-aged BB plumes do not follow the S. Liu et al. (2014) parameteriza-tion (Briggs et al., 2016). All of the BB plumes observed by Briggs et al. (2016) hadω> 0.91 despite MCE values as high
as 0.98, and no relationship was found betweenωand MCE.
The highωvalues typical of aged BB plumes are most likely
15192 J. R. Laing et al.: Physical and optical properties of aged biomass burning aerosol condensation. Given this we believe the ω’s seen in these
Siberian plumes are different and significantly higher than the ω’s directly after emission and are therefore cannot be
equated to an MCE value.
We found AAE values for the Siberian events to be signif-icantly lower than regional BB events (Figs. 3 and 4). High AAE values are indicative of the presence of brown carbon (BrC). Brown carbon is a fraction of OA that selectively ab-sorbs short wavelengths (Andreae and Gelencsér, 2006; Chen and Bond, 2010; Kirchstetter et al., 2004). There are two possible explanations for the difference in AAE values. The first is that the flaming conditions that produced the Siberian events seen at MBO had higher BC and lower OA emis-sions, which inherently have lower AAE as total absorption is dominated by BC and less BrC is initially produced. Lab-oratory and field studies have corroborated this and observed an inverse relationship between MCE and AAE (Holder et al., 2016; S. Liu et al., 2014; McMeeking et al., 2014). The other explanation is that BrC is lost during transport through photobleaching, volatilization, and aerosol-phase reactions. Forrister et al. (2015) determined that BrC decreased with transport with a half-life of 9 h and that AAE decreases from ∼4.0 to∼2.5 24 h after emission. All of the regional BB events were influenced by multiple fires that had transport times varying from 3 to 35 h. With each event being influ-enced by at least one fire with a transport time ≤6 h, this short transport time is consistent with the higher AAE values we observed.
3.4 Mass scattering efficiency
MSE is important for calculating the radiative forcing ef-fects of aerosols in global climate and chemical transport models. Estimates of MSE are used to convert aerosol mass measurements to aerosol optical properties (Briggs et al., 2016; Hand and Malm, 2007; Pitchford et al., 2007). MSE is dependent on particle composition, which determines the particle’s refractive index and hygroscopicity, and aerosol size distribution (Hand and Malm, 2007). We calculated MSE as the slope of the RMA regression ofσscatand PM1
(1σscat/1PM1). R2 values were > 0.94 for all events. We
found MSE values ranged from 2.50 to 4.76 m2g−1, which are consistent with previously measured values.
During 2013 at MBO, MSE values estimated using Aerosol Mass Spectrometer (AMS) organic matter data and the σscat for four wildfire plumes ranged from 2.8 to
4.8 m2g−1(mean: 3.7 m2g−1)(Briggs et al., 2016). Levin et al. (2010) calculated MSE values for fresh BB smoke from a variety of fuels to range from 1.5 to 5.7 m2g−1, with most
of the values falling between 2.0 and 4.5 m2g−1. Reid et
al. (2005a) reviewed MSE values from BB events and found a range between 3.2 and 4.2 m2g−1(mean: 3.8 m2g−1)for temperate and boreal fresh smoke and larger values for aged smoke (3.5–4.6 m2g−1; mean: 4.3 m2g−1). MSE values up-wards of∼6 m2g−1have been observed for aged BB plumes
(Hand and Malm, 2007; McMeeking et al., 2005). Due to the large variation in MSE values for BB events, assigning an average MSE value to convert aerosol mass measurements to aerosol optical properties or vice versa introduces significant uncertainties.
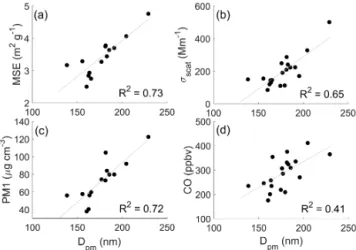
We investigated the cause for the variation in the MSE val-ues that we observed. We found MSE’s for BB events to be positively correlated withDpm(R2=0.73) (Fig. 6a). If two Dpmvalues associated with bimodal size distributions are
re-moved, the correlation increases substantially (R2=0.88). A
positive correlation between MSE and mean particle diame-ter has previously been observed in ambient data (Lowenthal and Kumar, 2004) and laboratory studies (McMeeking et al., 2005). Theoretically according to Mie theory, MSE will in-creases as the average particle diameter grows, through co-agulation and condensation, toward the measurement wave-length (550 nm) (Seinfeld and Pandis, 2006).
3.5 BB size distributions
Figure 7 shows the BB aerosol number size distributions for the regional events (solid lines) and Siberian events (dashed lines) we observed at MBO. We foundDpm andσg of the
number distributions to range from 138 to 229 nm and 1.53 to 1.89, respectively. The size distributions observed at MBO are similar to Janhäll et al. (2010), who compiled aged BB size distributions. They found the accumulation mode mean diameter to range from 175 to 300 nm with geometric stan-dard deviations of 1.3–1.7. No dependence was found inDpm
in plumes of regional or Siberian origins. Similarly during the ARCTAS-B flight campaign, aged BB plumes of West-ern Canadian and Asian origins were found to have simi-lar size distributions (Canadian:Dpm=224±14 nm, σg= 1.31±0.05; Asian: Dpm=238±11 nm, σg=1.31±0.03) (Kondo et al., 2011). The BORTAS-B flight campaign in Eastern Canada observed aged BB plumes with median di-ameters of 180–240 nm (Sakamoto et al., 2015).
We observed clear bimodal distributions with an accumu-lation mode (100–500 nm) and Aitken mode (20–100 nm) for five events (2, 3, 11, 14, and 15). The Aitken mode in these size distributions most likely represents a secondary source from within the BL. A prominent “tail” consisting of higher than expected number concentrations of small-diameter par-ticles (30–90 nm) was observed for most of the unimodal events at MBO. It would be expected that particles in this size range would grow to larger particles through coagulation relatively quickly. Sakamoto et al. (2015) observed a similar elevation in the number concentration of small particles dur-ing the BORTAS-B campaign. They attempted to account for the existence of the tail with a Lagrangian box model of co-agulation and dilution but were unable to do so. Coco-agulation should cause a significant decrease in Aitken mode particles in a matter of hours, and nucleation and condensation growth rates would have to be unreasonably high to maintain these small particles.
Figure 6.Scatter plots of(a)MSE,(b)σscat,(c)PM1, and(d)CO vs.Dpmfor the BB events at MBO in the summer of 2015.
Figure 7.Event-integrated aerosol number size distributions (cor-rected to STP) in dN/dlogDp(no. cm−1). The regional BB events
have solid colored lines and the Siberian BB events have dashed black lines.
We observed no clear distinction between the size distri-butions from regional and Siberian events. These results are consistent with previous studies that have not observed a de-pendence from plume age, transport time, or source location on the BB size distribution. Kondo et al. (2011) found lit-tle difference between theDpmof Siberian and Canadian BB
plumes despite different chemical composition, optical prop-erties, and transport times. Similarly, Sakamoto et al. (2015) found no trend in size distribution with plume transport dis-tance. In a study performed in the Front Range of Col-orado, Carrico et al. (2016) found no significant difference between the size distribution of an hours-old and a days-old fire plume.
As previously stated, we found MSEs for BB events to be positively correlated with Dpm. This makes physical sense
due to increased light scattering efficiency of larger parti-cles closer to the wavelength of light (550 nm). In addition,
we found event-integratedDpmto be correlated with
event-integratedσscat(R2=0.65) and PM1mass (R2=0.72), and
moderately correlated with CO (R2=0.41) (Fig. 6b, c, d). Dpm was not found to be correlated with any normalized
ER (1σscat/1CO,1PM1/1CO). CO,σscat, and PM1can be
thought of as surrogates for plume concentration. The corre-lation between these proxies of plume concentration andDpm
indicates that in general, the more concentrated BB plumes have larger size distributions.
In a related study, Sakamoto et al. (2016) selected subsets of the MBO BB regional events presented here and tested them against parameterizations of the aged size distribution. The parameterizations calculateDpmandσgfrom inputs that
can be derived from emissions-inventory and meteorological parameters. The seven inputs are emission median dry di-ameter, emission distribution modal width, mass emissions flux, fire area, mean boundary-layer wind speed, plume mix-ing depth, and time/distance since emission. We identified 11 plumes from regional events that had consistent transport to known regional fires. The simple fits captured over half of the variability in observedDpmand modal width, even though
the freshly emittedDpm and modal widths were unknown.
The results demonstrate that the parameterizations presented in Sakamoto et al. (2016) Sect. 3.4 can be successfully used to estimate aged BB size distributions in regional BB plumes with transport times up to 35 h. Using these parameteriza-tions to estimate BB plume size distribution in global and regional aerosol models is a significant improvement to as-suming fixed values for size-distribution parameters.
The Sakamoto et al. (2016) parameterizations were partic-ularly sensitive to mass emissions flux and fire area, as well as wind speed and transport time. If mass emissions flux is interpreted as surrogate for plume concentration, this agrees with our conclusion that increased plume concentration re-sults in a larger size distribution.
4 Conclusions
We characterized the physical and optical properties of 19 aged biomass burning events observed at the Mt. Bachelor Observatory in the summer of 2015. Regional (Northern Cal-ifornia and Southwestern Oregon) and Siberian events were observed. Our main conclusions were as follows:
– 1σscat/1CO (σscat at STP) enhancement ratio ranged
from 0.48 to 1.29 Mm−1ppbv−1, with the majority of events being between 0.8 and 1.25 Mm−1ppbv−1.
– Siberian-influenced events had significantly higher
1σabs/1CO and MAE and lower ω compared to
pro-15194 J. R. Laing et al.: Physical and optical properties of aged biomass burning aerosol duce more BC, which would explain the amplified
ab-sorption in the Siberian events.
– AAE values were significantly lower for the Siberian events than regional events, which indicates lack of BrC produced by the Siberian fires or loss of BrC during transport through photobleaching, volatilization, and aerosol-phase reactions.
– Mass scattering efficiencies ranged from 2.50 to 4.76 m2g−1. MSE was positively correlated with Dpm
(R2=0.73), which agrees with Mie theory.
– Aerosol number size distribution Dpm and σg ranged
from 138 to 229 nm and 1.53 to 1.89, respectively. Five of the 19 events had bimodal distributions, the rest being unimodal. The unimodal distributions had a prominent “tail” of small-diameter particles (30–90 nm). No dis-tinction could be made between regional and Siberian size distributions.
5 Data availability
The SMPS data from Mt. Bachelor Observatory during 2015 is permanently archived at the University of Washing-ton Research Works site: http://hdl.handle.net/1773/36293, doi:10.21419/B9159X (Jaffe, 2016a).
The Mt. Bachelor Observatory 2015 dataset are per-manently archived at the University of Washington Research Works site: http://hdl.handle.net/1773/37330, doi:10.21419/B9WC70 (Jaffe, 2016b).
The Supplement related to this article is available online at doi:10.5194/acp-16-15185-2016-supplement.
Author contributions. James R. Laing performed the data analysis and prepared the manuscript with assistance from all co-authors.
Disclaimer. The views, opinions, and findings contained in this re-port are those of the author(s) and should not be construed as an official National Oceanic and Atmospheric Administration or US Government position, policy, or decision.
Acknowledgements. Funding for research at MBO was supported by the National Science Foundation (grant number: 1447832). MBO is also supported by a grant from the NOAA Earth System Re-search Laboratory. The authors gratefully acknowledge the NOAA Air Resources Laboratory (ARL) for the provision of the HYSPLIT transport model used in this publication. The CALIPSO satellite products were supplied from the NASA Langley Research Center.
Edited by: S. A. Nizkorodov
Reviewed by: two anonymous referees
References
Akagi, S. K., Craven, J. S., Taylor, J. W., McMeeking, G. R., Yokel-son, R. J., Burling, I. R., Urbanski, S. P., Wold, C. E., Seinfeld, J. H., Coe, H., Alvarado, M. J., and Weise, D. R.: Evolution of trace gases and particles emitted by a chaparral fire in California, Atmos. Chem. Phys., 12, 1397–1421, doi:10.5194/acp-12-1397-2012, 2012.
Ambrose, J. L., Reidmiller, D. R., and Jaffe, D. A.: Causes of high O(3) in the lower free troposphere over the Pacific Northwest as observed at the Mt. Bachelor Observatory, Atmos. Environ., 45, 5302–5315, doi:10.1016/j.atmosenv.2011.06.056, 2011. Anderson, T. L. and Ogren, J. A.: Determining aerosol radiative
properties using the TSI 3563 integrating nephelometer, Aerosol Sci. Tech., 29, 57–69, 1998.
Anderson, T. L., Covert, D., Wheeler, J., Harris, J., Perry, K., Trost, B., Jaffe, D., and Ogren, J.: Aerosol backscatter fraction and single scattering albedo: Measured values and uncertainties at a coastal station in the Pacific Northwest, J. Geophys. Res., 104, 26793–26807, 1999.
Andreae, M. O. and Gelencsér, A.: Black carbon or brown car-bon? The nature of light-absorbing carbonaceous aerosols, At-mos. Chem. Phys., 6, 3131–3148, doi:10.5194/acp-6-3131-2006, 2006.
Andreae, M. O. and Merlet, P.: Emission of trace gases and aerosols from biomass burning, Global Biogeochem. Cy., 15, 955–966, doi:10.1029/2000gb001382, 2001.
Baylon, P., Jaffe, D. A., Wigder, N. L., Gao, H., and Hee, J.: Ozone enhancement in western US wildfire plumes at the Mt. Bachelor Observatory: The role of NOx, Atmos. Environ., 109, 297–304, doi:10.1016/j.atmosenv.2014.09.013, 2015.
Bond, T. C., Anderson, T. L., and Campbell, D.: Calibration and intercomparison of filter-based measurements of visible light ab-sorption by aerosols, Aerosol Sci. Tech., 30, 582–600, 1999. Bond, T. C., Streets, D. G., Yarber, K. F., Nelson, S. M., Woo, J. H.,
and Klimont, Z.: A technology-based global inventory of black and organic carbon emissions from combustion, J. Geophys. Res.-Atmos., 109, D14203, doi:10.1029/2003jd003697, 2004. Bond, T. C., Doherty, S. J., Fahey, D. W., Forster, P. M., Berntsen,
T., DeAngelo, B. J., Flanner, M. G., Ghan, S., Kärcher, B., Koch, D., Kinne, S., Kondo, Y., Quinn, P. K., Sarofim, M. C., Schultz, M. G., Schulz, M., Venkataraman, C., Zhang, H., Zhang, S., Bel-louin, N., Guttikunda, S. K., Hopke, P. K., Jacobson, M. Z., Kaiser, J. W., Klimont, Z., Lohmann, U., Schwarz, J. P., Shin-dell, D., Storelvmo, T., Warren, S. G., and Zender, C. S.: Bound-ing the role of black carbon in the climate system: A scientific as-sessment, J. Geophys. Res., 118, 1–173, doi:10.1002/jgrd.50171, 2013.
Boucher, O., Randal, D., Artaxo, P., Bretherton, C., Feingold, G., Forster, P., Kerminen, V.-M., Kondo, Y., Liao, H., Lohmann, U., Rasch, P., Satheesh, S. K., Sherwood, S., Stevens, B., and Zhan, X.-Y.: Clouds and Aerosols, in: Climate Change 2013: The Phys-ical Science Basis. Contribution of Working Group I to the Fifth Assessment Report of the Intergovernmental Panel on Climate Change, edited by: Stocker, T. F., Qin, D., Plattner, G.-K.,
nor, M., Allen, S. K., Boschung, J., Nauels, A., Xia, Y., Bex, V., and Midgley, P. M., Cambridge University Press, Cambridge, UK, 2013.
Briggs, N. L., Jaffe, D. A., Gao, H., Hee, J. R., Baylon, P. M., Zhang, Q., Zhou, S., Collier, S. C., Sampson, P. D., and Cary, R. A.: Par-ticulate Matter, Ozone, and Nitrogen Species in Aged Wildfire Plumes Observed at the Mount Bachelor Observatory, AAQR, in press, 2016.
Carrico, C. M., Prenni, A. J., Kreidenweis, S. M., Levin, E. J., McCluskey, C. S., DeMott, P. J., McMeeking, G. R., Nakao, S., Stockwell, C., and Yokelson, R. J.: Rapidly evolv-ing ultrafine and fine mode biomass smoke physical proper-ties: Comparing laboratory and field results, J. Geophys. Res., doi:10.1002/2015JD024389, 2016.
Chen, Y. and Bond, T. C.: Light absorption by organic carbon from wood combustion, Atmos. Chem. Phys., 10, 1773–1787, doi:10.5194/acp-10-1773-2010, 2010.
Collier, S., Zhou, S., Onasch, T. B., Jaffe, D. A., Kleinman, L., Sed-lacek III, A. J., Briggs, N. L., Hee, J., Fortner, E., and Shilling, J. E.: Regional Influence of Aerosol Emissions from Wildfires Driven by Combustion Efficiency: Insights from the BBOP Cam-paign, Environ. Sci. Technol., 50, 8613–8622, 2016.
Draxler, R. R.: HYSPLIT4 user’s guide, NOAA Tech. Memo Rep., NOAA Air Resources Laboratory, Silver Spring, MD, USA, 1999.
Draxler, R. R. and Hess, G. D.: Description of the HYSPLIT_4 modeling system, NOAA Tech. Memo Rep., 24 pp., NOAA Air Resources Laboratory, Silver Spring, MD, USA, 1997.
Draxler, R. R. and Hess, G. D.: An overview of the HYSPLIT_4 modeling system of trajectories, dispersion, and deposition, Aust. Meteorol. Mag., 47, 295–308, 1998.
Fischer, E. V., Jaffe, D. A., Marley, N. A., Gaffney, J. S., and Marchany-Rivera, A.: Optical properties of aged Asian aerosols observed over the US Pacific Northwest, J. Geophys. Res.-Atmos., 115, D20209, doi:10.1029/2010JD013943, 2010a. Fischer, E. V., Jaffe, D. A., Reidmiller, D. R., and Jaeglé, L.:
Me-teorological controls on observed peroxyacetyl nitrate at Mount Bachelor during the spring of 2008, J. Geophys. Res., 115, D03302, doi:10.1029/2009jd012776, 2010b.
Flannigan, M. D., Krawchuk, M. A., de Groot, W. J., Wotton, B. M., and Gowman, L. M.: Implications of changing climate for global wildland fire, Int. J. Wildland Fire, 18, 483–507, 2009.
Forrister, H., Liu, J., Scheuer, E., Dibb, J., Ziemba, L., Thornhill, K. L., Anderson, B., Diskin, G., Perring, A. E., and Schwarz, J. P.: Evolution of brown carbon in wildfire plumes, Geophys. Res. Lett., 42, 4623–4630, 2015.
Gratz, L. E., Jaffe, D. A., and Hee, J. R.: Causes of increasing ozone and decreasing carbon monoxide in springtime at the Mt. Bache-lor Observatory from 2004 to 2013, Atmos. Environ., 109, 323– 330, doi:10.1016/j.atmosenv.2014.05.076, 2014.
Hand, J. L. and Malm, W. C.: Review of aerosol mass scattering ef-ficiencies from ground-based measurements since 1990, J. Geo-phys. Res., 112, D16203, doi:10.1029/2007jd008484, 2007. Haywood, J. and Boucher, O.: Estimates of the direct and indirect
radiative forcing due to tropospheric aerosols: A review, Rev. Geophys., 38, 513–543, doi:10.1029/1999rg000078, 2000. Hinds, W. C.: Aerosol Technology: Properties, Behavior, and
Mea-surement of Airborne Particles, 2nd Edition, John Wiley & Sons, Inc., New York, USA, 1999.
Hobbs, P. V.: Evolution of gases and particles from a sa-vanna fire in South Africa, J. Geophys. Res., 108, 8485, doi:10.1029/2002jd002352, 2003.
Holder, A. L., Hagler, G. S., Aurell, J., Hays, M. D., and Gullett, B. K.: Particulate matter and black carbon optical properties and emission factors from prescribed fires in the southeastern United States, J. Geophys. Res., 121, 3465–3483, 2016.
Hosseini, S., Li, Q., Cocker, D., Weise, D., Miller, A., Shrivastava, M., Miller, J. W., Mahalingam, S., Princevac, M., and Jung, H.: Particle size distributions from laboratory-scale biomass fires us-ing fast response instruments, Atmos. Chem. Phys., 10, 8065– 8076, doi:10.5194/acp-10-8065-2010, 2010.
Jaffe, D.: SMPS particle size data from the Mt. Bachelor Obser-vatory for summer 2015, available at: http://hdl.handle.net/1773/ 36293 (last access: 1 November 2016), 2016a.
Jaffe, D.: Mt. Bachelor Observatory 2015, available at: http://hdl. handle.net/1773/37330 (last access: 6 December 2016), 2016b. Jaffe, D. A., Prestbo, E., Swartzendruber, P., Weiss-Penzias, P.,
Kato, S., Takami, A., Hatakeyama, S., and Kajii, Y.: Export of at-mospheric mercury from Asia, Atmos. Environ., 39, 3029–3038, doi:10.1016/j.atmosenv.2005.01.030, 2005.
Janhäll, S., Andreae, M. O., and Pöschl, U.: Biomass burning aerosol emissions from vegetation fires: particle number and mass emission factors and size distributions, Atmos. Chem. Phys., 10, 1427–1439, doi:10.5194/acp-10-1427-2010, 2010. Jolleys, M. D., Coe, H., McFiggans, G., Taylor, J. W., O’Shea, S.
J., Le Breton, M., Bauguitte, S. J.-B., Moller, S., Di Carlo, P., Aruffo, E., Palmer, P. I., Lee, J. D., Percival, C. J., and Gal-lagher, M. W.: Properties and evolution of biomass burning or-ganic aerosol from Canadian boreal forest fires, Atmos. Chem. Phys., 15, 3077–3095, doi:10.5194/acp-15-3077-2015, 2015. Justice, C. O., Giglio, L., Korontzi, S., Owens, J., Morisette, J. T.,
Roy, D., Descloitres, J., Alleaume, S., Petitcolin, F., and Kauf-man, Y.: The MODIS fire products, Remote Sens. Environ., 83, 244–262, doi:10.1016/s0034-4257(02)00076-7, 2002.
Kirchstetter, T. W., Novakov, T., and Hobbs, P. V.: Evidence that the spectral dependence of light absorption by aerosols is affected by organic carbon, J. Geophys. Res.-Atmos., 109, D14203, doi:10.1029/2004jd004999, 2004.
Kondo, Y., Matsui, H., Moteki, N., Sahu, L., Takegawa, N., Ka-jino, M., Zhao, Y., Cubison, M. J., Jimenez, J. L., Vay, S., Diskin, G. S., Anderson, B., Wisthaler, A., Mikoviny, T., Fuel-berg, H. E., Blake, D. R., Huey, G., Weinheimer, A. J., Knapp, D. J., and Brune, W. H.: Emissions of black carbon, organic, and inorganic aerosols from biomass burning in North Amer-ica and Asia in 2008, J. Geophys. Res.-Atmos., 116, D08204, doi:10.1029/2010JD015152, 2011.
Levin, E. J. T., McMeeking, G. R, Carrico, C. M., Mack, L. E., Kreidenweis, S. M., Wold, C. E., Moosmüller, H., Arnott, W. P., Hao, W. M., Collett Jr., J. L., and Malm, W. C.: Biomass burn-ing smoke aerosol properties measured durburn-ing Fire Laboratory at Missoula Experiments (FLAME), J. Geophys. Res.-Atmos., 115, D18210, doi:10.1029/2009jd013601, 2010.
15196 J. R. Laing et al.: Physical and optical properties of aged biomass burning aerosol Liu, Y., Goodrick, S., and Heilman, W.: Wildland fire emissions,
carbon, and climate: Wildfire-climate interactions, Forest Ecol. Manag., 317, 80–96, doi:10.1016/j.foreco.2013.02.020, 2014. Lowenthal, D. H. and Kumar, N.: Variation of mass scattering
effi-ciencies in IMPROVE, J. Air Waste Manage., 54, 926–934, 2004. May, A. A., Levin, E. J. T., Hennigan, C. J., Riipinen, I., Lee, T., Collett, J. L., Jimenez, J. L., Kreidenweis, S. M., and Robin-son, A. L.: Gas-particle partitioning of primary organic aerosol emissions: 3. Biomass burning, J. Geophys. Res.-Atmos., 118, 11327–11338, doi:10.1002/jgrd.50828, 2013.
May, A. A., McMeeking, G. R., Lee, T., Taylor, J. W., Craven, J. S., Burling, I., Sullivan, A. P., Akagi, S., Collett Jr., J. L., Flynn, M., Coe, H., Urbanski, S. P., Seinfeld, J. H., Yokelson, R. J., and Kreidenweis, S. M.: Aerosol emissions from pre-scribed fires in the United States: A synthesis of laboratory and aircraft measurements, J. Geophys. Res.-Atmos., 119, 11826– 11849, doi:10.1002/2014jd021848, 2014.
May, A. A., Lee, T., McMeeking, G. R., Akagi, S., Sullivan, A. P., Urbanski, S., Yokelson, R. J., and Kreidenweis, S. M.: Obser-vations and analysis of organic aerosol evolution in some pre-scribed fire smoke plumes, Atmos. Chem. Phys., 15, 6323–6335, doi:10.5194/acp-15-6323-2015, 2015.
McMeeking, G. R., Kreidenweis, S. M., Carrico, C. M., Lee, T., Collett, J. L., and Malm, W. C.: Observations of smoke-influenced aerosol during the Yosemite Aerosol Characterization Study: Size distributions and chemical composition, J. Geophys. Res.-Atmos., 110, D09206, doi:10.1029/2004JD005389, 2005. McMeeking, G. R., Fortner, E., Onasch, T. B., Taylor, J. W.,
Flynn, M., Coe, H., and Kreidenweis, S. M.: Impacts of non-refractory material on light absorption by aerosols emitted from biomass burning, J. Geophys. Res.-Atmos., 119, 12272–12286, doi:10.1002/2014jd021750, 2014.
NASA: The Cloud-Aerosol Lidar and Infrared Pathfinder Satellite Observation (CALIPSO), available at: http://www-calipso.larc. nasa.gov/ (last access: 5 January 2016), 2016a.
NASA: WorldView, available at: https://worldview.earthdata.nasa. gov/ (last access: 5 January 2016), 2016b.
Okoshi, R., Rasheed, A., Reddy, G. C., McCrowey, C. J., and Curtis, D. B.: Size and mass distributions of ground-level sub-micrometer biomass burning aerosol from small wildfires, Atmos. Environ., 89, 392–402, doi:10.1016/j.atmosenv.2014.01.024, 2014.
Omar, A. H., Winker, D. M., Vaughan, M. A., Hu, Y., Trepte, C. R., Ferrare, R. A., Lee, K.-P., Hostetler, C. A., Kittaka, C., and Rogers, R. R.: The CALIPSO automated aerosol classification and lidar ratio selection algorithm, J. Atmos. Ocean. Tech., 26, 1994–2014, 2009.
Pierce, J. R., Chen, K., and Adams, P. J.: Contribution of primary carbonaceous aerosol to cloud condensation nuclei: processes and uncertainties evaluated with a global aerosol microphysics model, Atmos. Chem. Phys., 7, 5447–5466, doi:10.5194/acp-7-5447-2007, 2007.
Pitchford, M., Malm, W., Schichtel, B., Kumar, N., Lowenthal, D., and Hand, J.: Revised algorithm for estimating light extinction from IMPROVE particle speciation data, J. Air Waste Manage., 57, 1326–1336, 2007.
Reid, J. S., Eck, T. F., Christopher, S. A., Koppmann, R., Dubovik, O., Eleuterio, D. P., Holben, B. N., Reid, E. A., and Zhang, J.: A review of biomass burning emissions part III: intensive optical
properties of biomass burning particles, Atmos. Chem. Phys., 5, 827–849, doi:10.5194/acp-5-827-2005, 2005a.
Reid, J. S., Koppmann, R., Eck, T. F., and Eleuterio, D. P.: A review of biomass burning emissions part II: intensive physical proper-ties of biomass burning particles, Atmos. Chem. Phys., 5, 799– 825, doi:10.5194/acp-5-799-2005, 2005b.
Reidmiller, D. R., Jaffe, D. A., Fischer, E. V., and Finley, B.: Ni-trogen oxides in the boundary layer and free troposphere at the Mt. Bachelor Observatory, Atmos. Chem. Phys., 10, 6043–6062, doi:10.5194/acp-10-6043-2010, 2010.
Sakamoto, K. M., Allan, J. D., Coe, H., Taylor, J. W., Duck, T. J., and Pierce, J. R.: Aged boreal biomass-burning aerosol size dis-tributions from BORTAS 2011, Atmos. Chem. Phys., 15, 1633– 1646, doi:10.5194/acp-15-1633-2015, 2015.
Sakamoto, K. M., Laing, J. R., Stevens, R. G., Jaffe, D. A., and Pierce, J. R.: The evolution of biomass-burning aerosol size dis-tributions due to coagulation: dependence on fire and meteoro-logical details and parameterization, Atmos. Chem. Phys., 16, 7709–7724, doi:10.5194/acp-16-7709-2016, 2016.
Seinfeld, J. H. and Pandis, S. N.: Atmospheric Chemistry and Physics: From Air Pollution to Climate Change 2nd Edition, John Wiley & Sons, Inc., Hoboken, New Jersey, USA, 2006. Spracklen, D. V., Carslaw, K. S., Pöschl, U., Rap, A., and Forster,
P. M.: Global cloud condensation nuclei influenced by carbona-ceous combustion aerosol, Atmos. Chem. Phys., 11, 9067–9087, doi:10.5194/acp-11-9067-2011, 2011.
Stein, A. F., Draxler, R. R., Rolph, G. D., Stunder, B. J. B., Cohen, M. D., and Ngan, F.: NOAA’s Hysplit atmospheric transport and dispersion modeling system, B. Am. Meteorol. Soc., 96, 2059– 2077, doi:10.1175/bams-d-14-00110.1, 2015.
Stocks, B. J., Fosberg, M. A., Lynham, T. J., Mearns, L., Wotton, B. M., Yang, Q., Jin, J.-Z., Lawrence, K., Hartley, G. R., Mason, J. A., and McKenney, D. W.: Climate change and forest fire poten-tial in Russian and Canadian boreal forests, Clim. Change, 38, 1–13, doi:10.1023/a:1005306001055, 1998.
Timonen, H., Wigder, N., and Jaffe, D.: Influence of back-ground particulate matter (PM) on urban air quality in the Pacific Northwest, J. Environ. Manage., 129, 333–340, doi:10.1016/j.jenvman.2013.07.023, 2013.
Timonen, H., Jaffe, D. A., Wigder, N., Hee, J., Gao, H., Pitzman, L., and Cary, R. A.: Sources of carbonaceous aerosol in the free troposphere, Atmos. Environ., 92, 146–153, doi:10.1016/j.atmosenv.2014.04.014, 2014.
Vakkari, V., Kerminen, V. M., Beukes, J. P., Tiitta, P., van Zyl, P. G., Josipovic, M., Venter, A. D., Jaars, K., Worsnop, D. R., Kulmala, M., and Laakso, L.: Rapid changes in biomass burning aerosols by atmospheric oxidation, Geophys. Res. Lett., 41, 2644–2651, doi:10.1002/2014gl059396, 2014.
Virkkula, A.: Correction of the Calibration of the 3-wavelength Par-ticle Soot Absorption Photometer (3 PSAP), Aerosol Sci. Tech., 44, 706–712, doi:10.1080/02786826.2010.482110, 2010. Virkkula, A., Ahlquist, N. C., Covert, D. S., Arnott, W. P.,
Sheri-dan, P. J., Quinn, P. K., and Coffman, D. J.: Modification, calibration and a field test of an instrument for measuring light absorption by particles, Aerosol Sci. Tech., 39, 68–83, doi:10.1080/027868290901963, 2005.
Weiss-Penzias, P., Jaffe, D. A., Swartzendruber, P., Dennison, J. B., Chand, D., Hafner, W., and Prestbo, E.: Observations of Asian air pollution in the free troposphere at Mount Bachelor
vatory during the spring of 2004, J. Geophys. Res.-Atmos., 111, D10304, doi:10.1029/2005JD006522, 2006.
Weiss-Penzias, P., Jaffe, D., Swartzendruber, P., Hafner, W., Chand, D., and Prestbo, E.: Quantifying Asian and biomass burning sources of mercury using the Hg/CO ratio in pollution plumes
observed at the Mount Bachelor Observatory, Atmos. Environ., 41, 4366–4379, doi:10.1016/j.atmosenv.2007.01.058, 2007. Westerling, A. L., Hidalgo, H. G., Cayan, D. R., and Swetnam, T.
W.: Warming and earlier Spring increase western US forest wild-fire activity, Science, 313, 940–943, 2006.
Wiedinmyer, C., Akagi, S. K., Yokelson, R. J., Emmons, L. K., Al-Saadi, J. A., Orlando, J. J., and Soja, A. J.: The Fire INventory from NCAR (FINN): a high resolution global model to estimate the emissions from open burning, Geosci. Model Dev., 4, 625– 641, doi:10.5194/gmd-4-625-2011, 2011.
Wigder, N. L., Jaffe, D. A., and Saketa, F. A.: Ozone and partic-ulate matter enhancements from regional wildfires observed at Mount Bachelor during 2004–2011, Atmos. Environ., 75, 24–31, doi:10.1016/j.atmosenv.2013.04.026, 2013.
Winker, D. M., Vaughan, M. A., Omar, A., Hu, Y., Powell, K. A., Liu, Z., Hunt, W. H., and Young, S. A.: Overview of the CALIPSO mission and CALIOP data processing algorithms, J. Atmos. Ocean. Tech., 26, 2310–2323, 2009.
Winker, D. M., Pelon, J., Coakley Jr., J., Ackerman, S., Charlson, R., Colarco, P., Flamant, P., Fu, Q., Hoff, R., and Kittaka, C.: The CALIPSO mission: A global 3-D view of aerosols and clouds, B. Am. Meteorol. Soc., 91, 1211, doi:10.1175/2010BAMS3009.1, 2010.
Yokelson, R. J., Crounse, J. D., DeCarlo, P. F., Karl, T., Urbanski, S., Atlas, E., Campos, T., Shinozuka, Y., Kapustin, V., Clarke, A. D., Weinheimer, A., Knapp, D. J., Montzka, D. D., Holloway, J., Weibring, P., Flocke, F., Zheng, W., Toohey, D., Wennberg, P. O., Wiedinmyer, C., Mauldin, L., Fried, A., Richter, D., Walega, J., Jimenez, J. L., Adachi, K., Buseck, P. R., Hall, S. R., and Shetter, R.: Emissions from biomass burning in the Yucatan, At-mos. Chem. Phys., 9, 5785–5812, doi:10.5194/acp-9-5785-2009, 2009.
Yokelson, R. J., Andreae, M. O., and Akagi, S. K.: Pitfalls with the use of enhancement ratios or normalized excess mixing ra-tios measured in plumes to characterize pollution sources and aging, Atmos. Meas. Tech., 6, 2155–2158, doi:10.5194/amt-6-2155-2013, 2013a.