Joana Raquel Afonso Gomes
Degree in Biochemistry
Protein glycosylation of extracellular vesicles from
ovarian carcinoma cells
Dissertation to obtain the Master Degree in Biochemistry for Health
Supervisor: Júlia Carvalho Costa, Principal Investigator, ITQB
Joana Raquel Afonso Gomes
Degree in Biochemistry
Protein glycosylation of extracellular vesicles from
ovarian carcinoma cells
Dissertation to obtain the Master Degree in Biochemistry for Health
Supervisor: Júlia Carvalho Costa, Principal Investigator, ITQB
Jury:
President: Doctor Pedro Manuel Henriques Marques Matias Opponent: Doctor Duarte Custal Ferreira Barral
Members of the jury: Doctor Júlia Carvalho Costa
Doctor Margarida Archer Baltazar Pereira da Silva Franco Frazão
Instituto de Tecnologia Química e Biológica
iii
Copyright
Joana Raquel Afonso Gomes
Protein glycosylation of extracellular vesicles from ovarian carcinoma cells
v
Acknowledgments
It would not be possible to do this master thesis without the help and support of several people to whom I would like to express my sincere acknowledgments.
Firstly, I would like to thank to my supervisor, Dr. Júlia Costa, for the opportunity, for the guidance, for always being available and for all the scientific discussions that helped me to improve.
To Dr. Patrícia Alves for the kind help in the interpretation of mass spectrometry data. To Dr. Cristina Peixoto and to Sofia Carvalho for the acquisition and interpretation of the NTA data.
To Daniel Simão for the help in obtaining the membrane fraction.
To my lab colleagues, Cláudia e Margarida, for being such good friends and for all the support in those days where science did not work as expected.
A todos os meus amigos de faculdade, em especial ao Filipe, por todas as palavras de incentivo e apoio ao longo deste ano. Obrigada por me fazeres rir com as tuas brincadeiras.
Às minhas amigas Filipa, Fátima e Catarina que apesar da distância e das conversas espaçadas me mostraram sempre, ao longo de todos estes anos, o verdadeiro significado do
nosso lema ‘Ser amiga é ser irmã’.
Ao Nuno. Obrigada por toda a tua paciência, carinho e apoio. Obrigada por me fazeres sorrir com as coisas mais simples e por me mostrares sempre o ‘bright side of life’ mesmo nos dias mais cinzentos.
À minha irmã, Gisela. Obrigada por seres a melhor amiga e companheira de aventuras e pelas tuas palavras encorajadoras, mesmo naqueles dias em que parecia não querer ouvir.
vii
Preface
This work was performed in the Laboratory of Glycobiology of ITQB-UNL and funded by projects: ENMed/0001/2013, EURONANOMED II, Fundação para a Ciência e Tecnologia (FCT), Portugal; EU JPND Research, FCT, JPND/0003/2011; Pest-OE/EQB/LA0004/2011, FCT.
Joana Gomes is recipient of fellowship 007/BI/2015, from project ICV 342, ITQB.
Part of this work was published in Biomolecules: Gomes J, Gomes-Alves P, Carvalho SB, Peixoto C, Alves PM, Altevogt P, Costa J (2015). Extracellular Vesicles from Ovarian Carcinoma Cells Display Specific Glycosignatures Biomolecules 5:1741-61.
Part of this work was presented in a flash oral presentation and in a poster session in
ix
Abstract
Extracellular vesicles (EVs) are released by almost all types of cells, including tumor, immune and stem cells, and are also present in body fluids like saliva, urine, breast milk and malignant ascites. EVs have a unique cargo of proteins, lipids and nucleic acids, and conserve characteristics from donor cells.
Herein, EVs and total cell membranes (MBs) were isolated from human ovarian carcinoma OVMz cells, and further characterized. EVs showed a strong enrichment in the specific EVs markers CD63, CD9 and Tsg101 and had an average size of 145 nm. On the other hand, MBs fraction contained markers of cellular organelles, including, calnexin (endoplasmic reticulum), GRASP65 and GS28 (Golgi apparatus), LAMP-1 (lysosomes) and L1CAM (plasma membrane).
The glycoprotein galectin-3 binding protein (LGALS3BP) was found to be strongly enriched in the EVs fraction where it was identified by mass spectrometry (MALDI-TOF/TOF), after trypsin digestion, and by immunoblotting. Digestion with endoglycosidase H, peptide N-glycosidase F and sialidase showed that LGALS3BP contained complex N-glycans with sialic acid.
The MBs and EVs glycan profiles were compared by lectin blotting, with a panel of lectins. EVs displayed specific glycosignatures relatively to MBs, with enrichment in α2,3-linked sialic acid, fucose and bisecting GlcNAc-containing glycoproteins. Glycoproteins with the LacdiNAc motif and O-glycans with the T-antigen were also detected.
The inhibition of the processing of high mannose to complex/hybrid N-linked glycans
with the α-mannosidase I inhibitor, kifunensine, caused changes in the EVs composition including decreased levels of the glycoproteins L1CAM, CD63, CD9 and LGALS3BP but also the non-glycosylated protein Tsg101.
In conclusion, the isolated vesicles were enriched in specific EVs markers including the sialoglycoprotein LGALS3BP. Furthermore, the results showed that glycosignatures of EVs were specific and altered glycosylation within the cell affected the composition and/or dynamics of EVs release. Altogether, these results could provide potential novel biomarkers for ovarian cancer.
Keywords– glycosylation; extracellular vesicles; ovarian cancer; galectin-3-binding protein;
xi
Resumo
As vesículas extracelulares (EVs) são libertadas por quase todos os tipos de células, incluindo células tumorais, e estão também presentes em fluidos corporais.
Neste trabalho, foram isoladas e caracterizadas frações de EVs e de membranas celulares (MBs) provenientes da linha celular humana de carcinoma do ovário, OVMz. Na fração de EVs observou-se um enriquecimento nas proteínas CD63, CD9 and Tsg101, marcadores específicos de EVs, e as vesículas apresentaram um tamanho médio de 145 nm. Na fração de MBs foi observada a presença de marcadores de organitos celulares, sendo estes calnexina (retículo endoplasmático), GRASP65 e GS28 (complexo de Golgi), LAMP-1 (lisossomas), L1CAM (membrana plasmática).
Na fração de EVs observou-se um forte enriquecimento da glicoproteína “galectin-3
binding protein” (LGALS3BP) a qual foi identificada por espectrometria de massa (MALDI-TOF/TOF) e por “immunoblotting”. As digestões com endoglicosidase H, péptido N-glicosidase F e sialidase mostraram que a LGALS3BP continha N-glicanos do tipo complexo com ácido siálico.
Os perfis de glicosilação das frações de EVs e de MBs foram comparados por “blotting”
de lectinas. A fração de EVs demonstrou ter um perfil de glicosilação específico e distinto, com enriquecimento em glicoproteínas contendo ácido siálico na ligação α2,3, fucose e “bisecting”
GlcNAc. Foi também detectada a estrutura LacdiNAc e o antigénio-T.
A inibição do processamento de N-glicanos do tipo oligomanose para o tipo complexo/híbrido, com o inibidor “kifunensine”, provocou alterações na composição da fração
de EVs, reduzindo os níveis das glicoproteínas L1CAM, CD63, CD9 e LGALS3BP e da proteína não glicosilada Tsg101.
Concluindo, a fração de EVs encontrava-se enriquecida em marcadores de EVs incluindo a sialoglicoproteína LGALS3BP. Os resultados mostraram ainda que os perfis de glicosilação das EVs eram específicos, tendo a alteração da glicosilação celular afectado a composição e/ou dinâmica da libertação de EVs. No seu conjunto, estes resultados poderão fornecer novos potenciais biomarcadores para cancro do ovário.
Palavras-chave– glicosilação; vesículas extracelulares; cancro do ovário; “galectin-3-binding
xiii
Index
1. Introduction ... 1
1.1 Ovarian cancer ... 1
1.2 Protein glycosylation ... 2
1.2.1 Biosynthesis of glycans ... 2
1.2.2 Glycosylation in cancer... 4
1.3 Extracellular vesicles ... 5
1.3.1 Characteristics ... 5
1.3.2 EVs biogenesis ... 6
1.3.3 EVs in cancer ... 7
1.4 Thesis objectives ... 8
2. Material and Methods ... 11
2.1 Cell culture and EVs production ... 11
2.2 Protein quantification ... 11
2.3 Preparation of cellular extract and total cell membranes fraction ... 11
2.4 SDS-PAGE, immunoblotting and lectin blotting analysis ... 12
2.5 Immunoprecipitation and deglycosylation of LGALS3BP ... 14
2.6 Nanoparticle tracking analysis ... 15
2.7 MALDI-TOF/TOF analysis and protein identification ... 15
3. Results ... 17
3.1 Characterization of OVMz cell line ... 17
3.2 Isolation and characterization of EVs and MBs ... 17
3.3 MALDI-TOF/TOF ... 20
3.4 LGALS3BP glycosylation ... 20
3.5 Glycosignatures of EVs and MBs ... 22
3.6 Effect of kifunensine ... 24
4. Discussion ... 27
4.1 EVs characterization and purification ... 27
4.2 Protein sorting and glycosylation ... 29
xiv
5. Conclusions ... 33
6. Future perspectives ... 35
xv
Index of figures
Figure 1.1 – Main classes of N-glycans ... 2
Figure 1.2 – Processing and maturation of N-glycans ... 3
Figure 1.3 – Schematic representation of EVs composition ... 6
Figure 1.4 – Schematic representation of EVs subpopulations ... 6
Figure 3.1 – Optical microscopy visualization of OVMz cells... 17
Figure 3.2 – Growth curve of OVMz cells ... 17
Figure 3.3 – Diagrammatic representation of the EVs and MBs isolation procedure ... 18
Figure 3.4 – Isolation of EVs from OVMz cells ... 18
Figure 3.5 – Comparison of protein profiles of MBs and EVs from OVMz cells ... 19
Figure 3.6 – Deglycosylation of immunoprecipitated LGALS3BP ... 20
Figure 3.7 – Comparison of glycosignatures from MBs and EVs ... 23
xvii
Index of tables
Table 1.1 – Guidelines for ovarian cancer staging from FIGO ... 1
Table 2.1 – Antibodies and incubation conditions used in immunoblotting analysis ... 13
Table 2.2 – Lectins, competitive sugars and conditions used in lectin blotting analysis ... 14
Table 3.1 – List of proteins identified in EVs and MBs from OVMz cells using MALDI-TOF/TOF after SDS-PAGE separation ... 21
xix
Abbreviations
AAL –Aleuria aurantia lectin Asn – Asparagine
BCA – Bicinchoninic Acid CA-125 – Cancer Antigen 125 CE – Cellular Extract
Con A – Concanavalin A ECL –Erythrina cristagalli lectin EDTA – Ethylenediamine Tetraacetic Endo H – Endoglycosidase H EOC – Epithelial Ovarian Cancer
E-PHA –Phaseolus vulgaris erythroagglutinin ER – Endoplasmic Reticulum
ESCRT – Endosomal Sorting Complex Required for Transport EVs – Extracellular Vesicles
FIGO – Federation of Gynecology and Obstetrics Fuc – Fucose
Gal – Galactose
GalNAc – N-Acetylgalactosamine GlcNAc – N-Acetylglucosamine
GlcNAcT – N-Acetylglucosaminyltransferase
GclNAcT III –β1,4-N-Acetylglucosaminyltransferase III GlcNAcT V –β1,6-N-Acetylglucosaminyltransferase V HRP – Horseradish Peroxidase
ILVs – Intraluminal Vesicles KIF – Kifunensine
Lac – Lactose
MAL –Maackia amurensis lectin MBs – Total Cell Membranes MVBs – Multivesicular Bodies NTA – Nanoparticle tracking analysis PBS – Phosphate-Buffered Saline
PBST – Phosphate-Buffered Saline with 0.1% (w/v) Tween-20 PNA – Peanut agglutinin
PNGase F – Peptide N-glycosidase F PTM – Post-Translational Modification Ser – Serine
SNA –Sambucus nigra agglutinin Thr – Threonine
TBS – Tris-Buffered Saline
TBST – Tris-Buffered Saline with 0.1% (w/v) Tween-20 WGA – Wheat germ agglutinin
1
1. Introduction
1.1 Ovarian Cancer
Ovarian cancer is the seventh most common type of cancer among women and the eighth in terms of cancer related deaths. In developed countries in particular, it rises to sixth in terms of overall mortality, being also the most lethal gynecological cancer (Torre et al. 2015).
Ovarian cancer is a very heterogeneous disease that can originate from three different types of cells: epithelial, stromal endocrine and germ cells, resulting in distinct types of cancer. The most common type is epithelial ovarian cancer (EOC) that represents 90% of the malignant cases. The disease also presents different histological subtypes: serous, mucinous, endometrioid, clear cell, transitional cell, mixed and undifferentiated, where the subtype serous is the most usual with 75% of the cases (Jelovac and Armstrong 2011).
According to the International Federation of Gynecology and Obstetrics (FIGO), ovarian cancer progression can be classified by its localization (Table 1.1).
Stage I Tumor is confined to ovaries.
Stage II Tumor involves one or both ovaries with pelvic extension (below the pelvic brim) or primary peritoneal cancer.
Stage III Tumor involves one or both ovaries with cytologically or histologically
confirmed spread to the peritoneum outside the pelvis and/or metastasis to the retroperitoneal lymph nodes.
Stage IV Distant metastasis excluding peritoneal metastasis.
A key factor to a positive therapeutic outcome is the stage at which the disease is detected. When diagnosed at early stages (stages I and II), the 5-year survival rate is between 80-90%, but at advanced stages (stages III and IV) these values drop drastically to around 20%. Although there are clear benefits from an early detection, doing so is very challenging due to the lack of specific symptoms, so in most cases, when discovered, ovarian cancer is already at an advanced stage - for example, for EOC, only 25% of the cases diagnosed are stage I (Gupta and Lis 2009, Aggarwal and Kehoe 2010).
Currently, screening is based on transvaginal ultrasound and measurement of the serum disease biomarker, cancer antigen 125 (CA-125). With the first one it is only possible to detect masses and alterations of the ovarian volume. However, it is not possible to distinguish between benign/malignant tumors (Karst and Drapkin 2010).
CA-125 is a mucin that is present in all healthy individuals, at low levels (< 35 U/ml), but in cases of ovarian cancer, there is a significant increase in the presence of this glycoprotein in the serum. This glycoprotein is used not only as a biomarker of the disease but also to monitor the response to the treatment, and to do the follow up of the patients once they finish it.
Although CA-125 is the most used biomarker to detect ovarian cancer in the clinic, it has some disadvantages associated with its sensitivity and specificity. For example, the
2
increase of CA-125 happens in about 80-90% of the cases of ovarian carcinoma but only 50% of the women with ovarian cancer, at an early stage, exhibit an increase in the mucin level. In terms of specificity, levels of CA-125 can be elevated by other conditions like: benign ovarian cysts, endometriosis, and pelvic inflammatory disease (Aggarwal and Kehoe 2010, Karst and Drapkin 2010).
Many studies related with the molecular and cellular mechanisms associated with cancer are performed with cell models cultivated in vitro. These have many advantages in tumor related studies where, for example, it is possible to have different cell lines representative of various stages and histotypes of the tumor. Moreover, tumor cell lines conserve the hallmarks of cancer, are easily propagated and it is possible to obtain reproducible results.
1.2 Protein glycosylation
1.2.1 Biosynthesis of glycans
Glycosylation is an important post-translational modification (PTM) of proteins and lipids that occur in all living beings. Almost all membrane and secreted proteins are glycosylated and this PTM is involved in many biological functions like: cell interactions with the microenvironment (cell proliferation, differentiation, migration, and adhesion), immune surveillance, inflammatory reactions, host–pathogen interactions and protein folding (Moremen et al. 2012, Christiansen et al. 2014)
Protein glycosylation can be of the N- or O-linkage type depending on the site where the glycan is bound. In N-glycosylation, the attachment of the oligosaccharide occurs to an asparagine (Asn) residue, in a consensus peptide sequence: Asn-X-Ser/Thr, commonly via N-acetylglucosamine (GlcNAc). N-glycans have a common pentasaccharide core region: Manα1
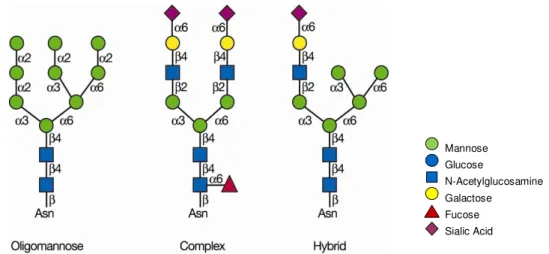
-6(Manα1-3)Manβ1-4GlcNAcβ1-4GlcNAc1-Asn-X-Ser/Thr and can be divided in three main classes according to their structure: oligomannose or high mannose in which only mannose residues are attached to the core, complex that also contain other monosaccharide residues, including galactose, sialic acid and fucose, or hybrid in which only mannose residues are attached to the Manα1–6 arm of the core and one or two complex antennae are on the Manα1–
3 arm (Fig. 1.1) (Varki et al. 2009).
Figure 1.1 – Main classes of N-glycans. N-glycans share a common core region Man3GlcNAc2 and
can be divided into three classes: oligomannose or high-mannose, complex and hybrid. After Varki et al. 2009.
Mannose Glucose
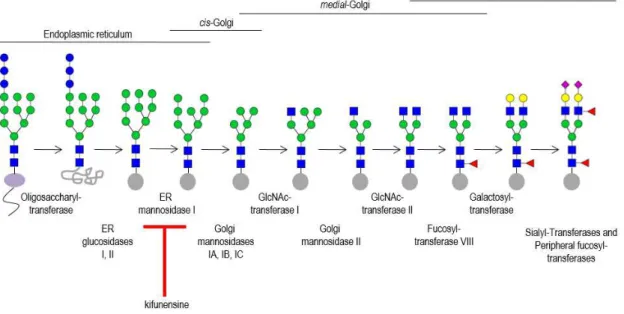
3 In eukaryotes, the synthesis of N-glycans starts in the endoplasmic reticulum (ER) with the formation of the N-glycan precursor, a 14-sugar glycan (Glc3Man9GlcNAc2), catalyzed by the
action of specific glycosyltransferases. Then, this N-glycan precursor is transferred from dolichol phosphate to the nascent polypeptide chain, in a reaction catalyzed by oligosaccharyltransferase present in the ER membrane.
After this step, the processing of Glc3Man9GlcNAc2 begins with the sequential removal
of glucose residues by α-glucosidase I, II and the removal of terminal α1-2Man by the ER α -mannosidase I, yielding Man8GlcNAc2 isomer. In the cis-Golgi, trimming of α1–2Man residues are catalyzed by the action of α1–2 mannosidases IA, IB, and 1C, originating Man5GlcNAc2.
For the biosynthesis of complex and hybrid N-glycans, Man5GlcNAc2 is processed in
medial-Golgi by the enzyme N-acetylglucosaminyltransferase I (GlcNAcT I). Next, the terminal
α1-3Man and α1-6Man residues are removed by the enzyme Golgi α-mannosidase II, forming GlcNAcMan3GlcNAc2. Then, a second GlcNAc is added to the α1–6Man, in the core, by the
action of GlcNAcT II, yielding the precursor for all biantennary, complex N-glycans. This precursor can be further processed by different enzymes like fucosyltransferase VIII (adds proximal fucose), galactosyltransferases (add galactose), sialyltransferases (add sialic acid), peripheral fucosyltransferases (add peripheral fucose) and N-acetylglucosamine transferases (add branches originating tri- and tetra-antennary glycans). In the synthesis of hybrid N-glycans, GlcNAcMan5GlcNAc2 is not processed by α-mannosidase II (Fig. 1.2) (Varki et al.
2009, Taylor and Drickamer 2011).
In O-glycosylation, diversity is higher, mucin type O-glycans are attached to the peptide backbone on the hydroxyl group of a serine (Ser) or a threonine (Thr) residue, through N-acetylgalactosamine (GalNAc), a structure named Tn antigen. The most common O-GalNAc
glycan is Galβ1-3GalNAc and it is termed T antigen. These two are only some examples of mucin type O-glycans with many other structures being found (Varki et al. 2009).
4
1.2.2 Glycosylation in cancer
Protein glycosylation is an important PTM for cell maintenance and survival. Overall, tumor cells present abnormal glycosylation patterns that can be caused by several factors like changes in the expression levels of glycosyltransferases, due, among other factors, to dysregulation at the transcriptional level, nucleotide sugar donor and substrate availability and localization of enzymes in secretory compartments (Stowell et al. 2015).
In cancer cells, one common alteration is the increase of β1,6 branching of N-glycans caused by augmented activity of the enzyme β1,6-N-acetylglucosaminyltransferase V (GlcNAcT V), coded by the gene MGAT5. This modification is associated with an enhanced capacity of the tumor to metastasize (Pinho and Reis 2015). An increase in invasion and metastasis was observed in mouse mammary cancer cell lines overexpressing the enzyme GlcNAcT V (Seberger and Chaney 1999).
Another common feature is an increase in fucosylation. Particularly, N- and O-glycans
can carry α2,3/4-linked fucose residues originating the formation of Lewis blood group antigens (Lewisx, Lewisy, Lewisa, Lewisb), whose expression is elevated in several types of cancer like
colon and breast cancer (Christiansen et al. 2014). Moreover, the Lewisx and Lewisa antigens can be sialylated with the addition of α2,3-linked sialic acid, generating sialyl-Lewisx and sialyl-Lewisa antigens. Both have been associated with cancer and expression of sialyl-Lewisx has been related with poor prognosis in cancer (Pinho and Reis 2015).
Bearing in mind the existence of distinct patterns of glycosylation between healthy and tumor cells, it is essential to study and compare them, in order to find new disease biomarkers and therapeutic targets. Lectins and antibodies are widely used reagents for the identification of glycan motifs. Lectins are glycan-binding proteins, with diverse origins, that are capable of binding specific glycan structures, with great affinity. On the other hand, antibodies are capable of recognizing determinants associated with cancer that lectins do not, like the Lewis blood group antigens. These two are used in diverse biochemical techniques like lectin/western blotting, histo/immunohistochemistry, flow cytometry and affinity chromatography (Varki et al. 2009).
Other techniques can be used for the study of cellular glycan composition like mass spectrometry. This technique has the possibility to discover new structures that are not identifiable by other methods referred above.
5
1.3 Extracellular vesicles
1.3.1 Characteristics
Extracellular vesicles (EVs) are released by almost all types of cells, including stem, immune and tumor cells, and are also present in body fluids like saliva, urine, breast milk and malignant ascites. They are a very heterogeneous group that contains vesicles with different cellular origins, sizes, morphology and composition (Colombo et al. 2014). EVs are typically classified by its size and origin, and there are three classes: exosomes, with an endosomal origin and a size between 30-150 nm, microvesicles resulting from the budding of the plasma membrane, size between 50-2000 nm and apoptotic bodies originating from the fragmentation of apoptotic cells with a size between 50 and 5000 nm (Vader et al. 2014).
The nomenclature of EVs has not been a consensual subject among the scientific community because there are several biophysical common characteristics between exosomes and microvesicles. Besides that, there is not an efficient and standardized protocol allowing the isolation of each type of EVs. The most used methodologies for EVs purification consists of successive low speed centrifugations followed by an ultracentrifugation, where the resulting pellet contains different EVs but possibly also unwanted protein aggregates (Colombo et al. 2014). Given the low efficacy of this purification process, other techniques have been employed based on the size of vesicles like density gradient centrifugation, where exosomes float between 1.13 and 1.19 g/ml, size exclusion chromatography, ultrafiltration and methods based in the biological composition of vesicles like immunoaffinity chromatography (Taylor and Shah 2015).
Isolated vesicles have been observed by electron microscopy where exosomes present a cup-shaped form but when observed by cryo–electron microscopy, these vesicles present a perfectly round shape. It is thought that this difference is due to the fixation/contrast step necessary for the EM protocol (Raposo and Stoorvogel 2013).
6
1.3.2 EVs biogenesis
In the endocytic pathway, early endosomes are originated by the budding of the plasma membrane and then they evolve into late endosomes that can fuse with lysosomes or with the plasma membrane and release its contents outside the cell. During the maturation the limiting membrane of endosomes starts to invaginate towards the lumen, originating intraluminal vesicles (ILVs) that are inside multivesicular bodies (MVBs) and there is the accumulation of cytosolic proteins and lipids. In ILVs, the transmembrane proteins maintain the same topological orientation that they had in the plasma membrane. After all these processes, MVBs fuse with lysosomes or with the plasma membrane. If the second path occurs, ILVs are released outside the cell where they are designated as exosomes (Fig. 1.4) (Colombo et al. 2014, Kourembanas 2015).
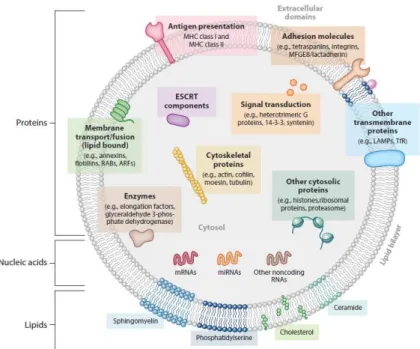
Figure 1.3 – Schematic representation of EVs composition. EVs have a diverse composition in
proteins, lipids and nucleic acids. After Colombo et al. 2014.
Figure 1.4 – Schematic representation of EVs subpopulations. Microvesicles formed by the
7 Exosome biogenesis can occur in different ways – one is dependent on the action of the endosomal sorting complex required for transport (ESCRT). This machinery has four complexes, ESCRT-0, ESCRT-I, ESCRT-II and ESCRT-III, which are responsible for this process. ESCRT-0 is a heterodimer formed by two subunits, HRS (hepatocyte growth factor-regulated tyrosine kinase substrate) and STAM 1/2 (signal transducing adaptor molecule). These two subunits have different motifs capable of binding phosphatidylinositol 3-phosphate, recognizing and sequestering monoubiquitinated cargo into the endosome and interacting with the complex ESCRT-I, through its protein Tsg101.
Therefore, ESCRT-0 recruits ESCRT-I, via Tsg101, and they are responsible for the monoubiquitinated cargo sorting into the MVBs, since ESCRT-I is also capable of recognizing ubiquitin. Besides Tsg101, ESCRT-I is formed by other subunits that recruit ESCRT-II and together, these two complexes are responsible for the membrane budding and stability (Babst 2011, Hanson and Cashikar 2012).
The complex ESCRT-III is distinct from the other three because it is formed by monomeric proteins that only assemble when recruited and this only happens by the interaction between the complexes –II e –III. Once assembled, ESCRT-III recruits the enzyme Doa4 (degradation of alpha 4) that is responsible for cargo deubiquitination. It is thought that complex ESCRT-III is responsible for neck constriction and vesicle scission. In the last step, complex ESCRT–III recruits the ATPase Vps4, leading to its own disassembling, in an energy consuming process, and this is crucial for the ESCRT machinery recycling (Henne et al. 2011, Hanson and Cashikar 2012, Kowal et al. 2014).
Recruitment to exosomes can also use a pathway independent of the ESCRT machinery which involves lipids,tetraspanins and heat shock proteins, which induce the inward curvature of MVBs (Kowal et al. 2014). In a study performed in oligodendroglial cells it was observed that the sorting of proteolipid protein to exosomes requires the synthesis of ceramide (Trajkovic et al. 2008). N-glycans can also be involved in the sorting of glycoproteins into the EVs. In a recent study, sorting of the glycoprotein EWI-2 into EVs, secreted by Sk-Mel-5 cells, was dependent on its N-glycan sites (Liang et al. 2014).
1.3.3 EVs in cancer
8
or be internalized via the endocytic pathway where they fuse with the endosomal delimiting membrane, delivering their cargo (Raposo and Stoorvogel 2013, Colombo et al. 2014).
As referred above, tumor cells also release EVs that have been demonstrated to carry proteins associated with cancer (oncoproteins) and RNAs that contribute to tumor progression and metastasis, angiogenesis and immune suppression (Vader et al. 2014). In fact, evidence has demonstrated the presence of oncoproteins and RNAs that contribute to cancer development. EVs derived from a human squamous carcinoma cell line contain EGFR, and can transfer it to endothelial cells. Upon transfer, endothelial cells secreted elevated amounts of VEGF, a signaling molecule that contributes to angiogenesis (Al-Nedawi et al. 2009). In another study, glioblastoma derived EVs showed an enrichment in mRNA transcripts, compared to donor cells. Also, these same vesicles were capable to enter and to translate a reporter mRNA to brain microvascular endothelial cells (Skog et al. 2008).
Given the crucial role that EVs have in cancer, they have been proposed as potential biomarkers once they carry cargo that reflects characteristics of the donor cell. Another advantage is that EVs can be easily isolated from patients’ blood. However, there is a technological challenge associated with EVs isolation and difficulties in distinguishing tumor derived EVs from EVs released by healthy cells (Vader et al. 2014). Recently, it was identified a surface proteoglycan, glypican-1, that was enriched in serum exosomes derived from patients with pancreatic cancer. The levels of this proteoglycan were correlated with tumor burden and showed a sensitivity and specificity of 100%, in each stage of the disease, being a potential biomarker (Melo et al. 2015). In ovarian cancer, it was observed that the protein cargo of exosomes varies among patients but in general display proteins associated with tumor growth like the protein EMMPRIN/CD147 (Keller et al. 2009). Another study, in ovarian cancer, described an increase in EVs circulating in the serum of patients and differences in the protein profile. EVs from patients showed an increase in TGF-β1 and MAGE 3/6 when compared with patients with benign tumors or healthy individuals (Szajnik et al. 2013).
Besides the EVs cargo, the analysis of EVs glycosylation is also a potential way to find new biomarkers since altered glycosylation is a common feature in cancer cells. A study concerning the glycosignatures of EVs purified from melanoma cells, colon cancer cells, T cells and breast milk showed that EVs had specific glycosignatures but they retained some characteristics of the parent cells (Batista et al. 2011). In an ovarian cancer cell line, purified exosomes exhibited enrichment of sialic acid-containing glycoproteins (Escrevente et al. 2011).
1.4 Thesis Objectives
The main objective of this work was to study the composition and glycosylation patterns of EVs secreted by OVMz cells, a human ovarian carcinoma cell line.
9 The second objective consisted in the analysis of MBs and EVs protein profiles, by SDS-PAGE, and the proteins enriched in each fraction were identified, after trypsin digestion, by MALDI-TOF/TOF.
The third objective consisted in the comparison of MBs and EVs glycosylation profiles, by lectin blotting, using nine different lectins. Since each lectin recognize a different glycan structures, it was possible to identify which glycan motifs were enriched in the EVs fraction.
11
2. Material and Methods
2.1 Cell Culture and EVs production
The human ovarian cancer OVMz cell line was grown in Dulbecco's Modified Eagle Medium-High Glucose (Sigma), supplemented with 10% fetal bovine serum (Gibco), 100 units/ml penicillin and 0.1 mg/ml streptomycin (Gibco), at 37 °C, in 5% CO2.
For cell counting, a Fuchs-Rosenthal chamber was used and for cell viability the trypan blue exclusion test was performed. This dye only crosses the plasma membrane of dead cells, so these cells are blue when observed at the microscope.
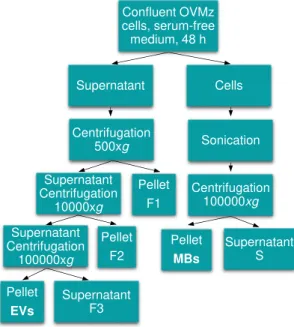
For the production of EVs, OVMz confluent cells were cultivated for 48 h in serum-free medium, to avoid contaminations by EVs from the bovine serum. The supernatant was collected and successively centrifuged at 500 and 10000xg for 10 and 20 min, to remove dead cells and cell debris, respectively. The supernatant was centrifuged at 100000xg for 120 min and the pellet consisted of the EVs fraction (Fig. 3.3). All the centrifugations were performed at 4 ºC (Escrevente et al. 2013).
For the study of glycosylation inhibition, kifunensine (KIF) (Sigma) was solubilized in serum-free medium and added to confluent cells, at 5 µM, for 48 h. Cells were grown in 24-well-plates to determine cell concentration and viability or in T75 flasks for EVs production. Statistical analysis was done using GraphPad Prism6 (GraphPad Software Inc.).
2.2 Protein quantification
Total protein concentration was determined by the bicinchoninic acid (BCA) method (Sigma) after protein precipitation with sodium deoxycholate and trichloroacetic acid to remove interfering compounds that could be present. The BCA method is based on the reduction of Cu2+ to Cu+ by the amino acids cysteine, tryptophan, tyrosine and by the peptide bond. The
amount of Cu reduced is proportional to the amount of protein present. Then, BCA forms a blue-purple complex with the ions Cu+ that have an absorption maximum at 562 nm, allowing the
quantification of total protein.
2.3 Preparation of cellular extract and total cell membranes fraction
To obtain cellular extract (CE), cells were collected with a cell scraper in phosphate-buffered saline (PBS) (10 mM Na2HPO4.2H2O, 2 mM KH2HPO4 pH 7.2, 140 mM NaCl, 2.7 mM
KCl) and centrifuged at 500xg for 5 min. Then, they were solubilized in 50 mM Tris-HCl pH 7.5, containing 5 mM ethylenediamine tetraacetic acid (EDTA), 1% (w/v) Triton X-100, 0.02% protease inhibitors cocktail, Complete (Roche) for 30 min, on ice. The extract was centrifuged at 10000xg, for 10 min, at 4 ºC, to remove insoluble material, and the supernatant corresponded to the CE fraction.
12
collected as the pellet of a 100000xg centrifugation, for 1 h (Pilobello et al. 2007). The diagrammatic representation of the procedures is shown in figure 3.3.
2.4 SDS-PAGE, immunoblotting and lectin blotting analysis
Proteins from MBs and EVs were analyzed by SDS-PAGE, in 10% acrylamide gels (T= 30.8%, C=2.6%). Proteins were solubilized in reducing sample buffer (0.08 M Tris-HCl pH 6.8,
2% SDS, 5% β-mercaptoethanol, 10% glycerol, 0.005% bromophenol blue) and incubated at 99 ºC, for protein denaturation. Gels were stained with Coomassie Blue R-250 (Merck) and destained with 25% methanol and 7% acetic acid.
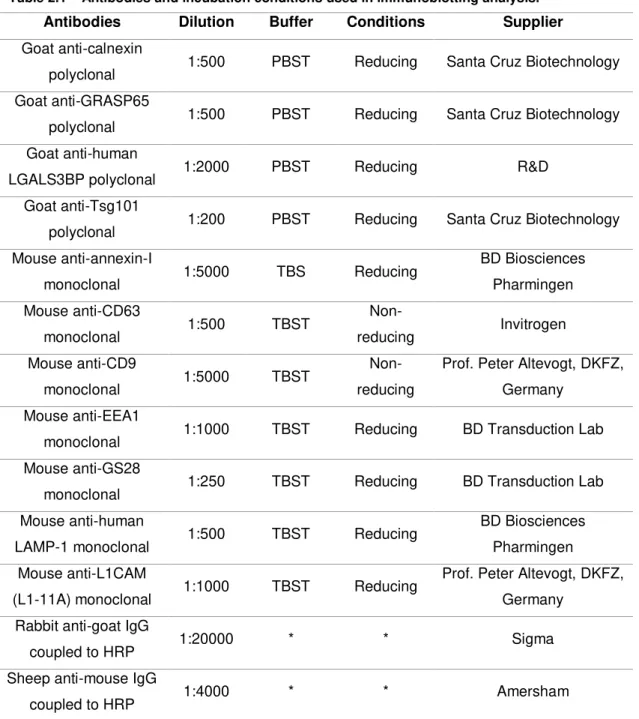
For immunoblotting, proteins were separated by SDS-PAGE and transferred to polyvinylidene fluoride membranes. These were blocked for 1 h with 5% defatted dry milk (Nestlé) in PBS with 0.1% (w/v) Tween-20 (PBST) or in buffered saline (TBS) (20 mM Tris-HCl pH 7.5, 150 mM NaCl) with 0.1% (w/v) Tween-20 (TBST). Tween-20 was used to avoid non-specific binding of proteins to the polyvinylidene fluoride membrane. The membranes were incubated with the primary antibodies overnight, and with the secondary antibodies coupled to horseradish peroxidase (HRP) for 2 h. The incubation conditions and antibodies used are indicated in table 2.1.
Washings after the primary and secondary antibodies incubations were performed with PBST or TBST, four times, for 5 min.
Protein detection was performed with the Immobilon Western chemiluminescent HRP substrate (Millipore). This is based on the luminol oxidation, a reaction that emits light and it is catalyzed by peroxidase, coupled to the secondary antibody. Image acquisition was done in Chemidoc XRS+ Imaging System (BioRad).
13 Table 2.1 – Antibodies and incubation conditions used in immunoblotting analysis.
r
-G
–
*The buffers used for the secondary antibodies were the same as for the corresponding primary antibodies.
Then, blots were incubated with 0.1 μg/ml streptavidin−peroxidase (Sigma) for 1 h and washed four times, for 5 min, with the corresponding buffer. Detection was performed with the Immobilon Western chemiluminescent HRP substrate (Millipore).
As control for non-specific binding, lectin incubations were done in the presence of competitive sugars: fucose (Fuc), methyl-α-D-mannopyranoside (α-MM), lactose (Lac), galactose (Gal), N-acetylgalactosamine (GalNAc) and N-acetylglucosamine (GlcNAc), after a pre-incubation of 15 min of the lectin with the sugar (Table 2.2).
To confirm MAL and SNA specificities, MBs and EVs were incubated with sialidase from
Vibrio cholerae (Roche) that hydrolyzes α2,3- α2,6- and α2,8-linked neuraminic acid. The
Antibodies Dilution Buffer Conditions Supplier
Goat anti-calnexin
polyclonal 1:500 PBST Reducing Santa Cruz Biotechnology Goat anti-GRASP65
polyclonal 1:500 PBST Reducing Santa Cruz Biotechnology Goat anti-human
LGALS3BP polyclonal 1:2000 PBST Reducing R&D
Goat anti-Tsg101
polyclonal 1:200 PBST Reducing Santa Cruz Biotechnology Mouse anti-annexin-I
monoclonal 1:5000 TBS Reducing
BD Biosciences Pharmingen Mouse anti-CD63
monoclonal 1:500 TBST
Non-reducing Invitrogen
Mouse anti-CD9
monoclonal 1:5000 TBST
Non-reducing
Prof. Peter Altevogt, DKFZ, Germany
Mouse anti-EEA1
monoclonal 1:1000 TBST Reducing BD Transduction Lab
Mouse anti-GS28
monoclonal 1:250 TBST Reducing BD Transduction Lab
Mouse anti-human
LAMP-1 monoclonal 1:500 TBST Reducing
BD Biosciences Pharmingen Mouse anti-L1CAM
(L1-11A) monoclonal 1:1000 TBST Reducing
Prof. Peter Altevogt, DKFZ, Germany
Rabbit anti-goat IgG
coupled to HRP 1:20000 * * Sigma
Sheep anti-mouse IgG
14
reaction was carried out overnight, at 37 ºC, with 15 mU sialidase in 50 mM sodium acetate pH 5.5 containing 4 mM CaCl2 (Escrevente et al. 2011).
Lectin Concentration
(µg/ml) Salts Supplier Competitive Sugar
AAL 1 – Galab Technologies 0.1 M Fuc
Con A 25 1 mM CaCl2 +
1 mM MnCl2
Sigma 0.1 M α-MM
ECL 0.5 1 mM CaCl2 +
1 mM MnCl2
Galab Technologies 0.5 M Lac
MAL 5 – Galab Technologies Incubation with
V.cholerae sialidase
PNA 0.5 1 mM CaCl2 +
1 mM MgCl2
Galab Technologies 0.3 M Gal
E-PHA 0.5 1 mM CaCl2 +
1 mM MnCl2
Vector Laboratories 0.4 M GalNAc
SNA 0.5 – Galab Technologies Incubation with
V.cholerae sialidase
WGA 0.1 – Galab Technologies 0.5 M GlcNAc
WFA 1 – Vector Laboratories 0.1 M GalNAc
2.5 Immunoprecipitation and deglycosylation of LGALS3BP
The protein LGALS3BP was immunoprecipitated from EVs solubilized in RIPA buffer (50 mM Tris-HCl pH 7.5, 150 mM NaCl, 0.1% SDS, 1% sodium deoxycholate, 1% (w/v) Triton-X 100, 0.02% protease inhibitors cocktail, Complete, Roche). First, the extract was pre-cleared by incubation with 20 µl of Protein A/G-agarose beads (Santa Cruz Biotechnologies) for 20 min, at 4 ºC, with constant rotation. This fraction was centrifuged at 10000xg for 5 min, at 4 ºC and the supernatant corresponded to the pre-cleared EVs fraction.
For each immunoprecipitation, 20 µl of Protein A/G-agarose beads were incubated with 5 µl of goat anti-human LGALS3BP polyclonal antibody (R&D) for 20 min, at 4 ºC, with constant rotation in RIPA buffer. Then, these beads were incubated for 1 h, at 4 ºC, with constant rotation, with the pre-cleared EVs. Washings were done with 250 µl RIPA buffer, three times, for 5 min.
For the deglycosylation of LGALS3BP, beads were incubated with 0.5% SDS, 1% β -mercaptoethanol and 0.02% protease inhibitors cocktail, Complete (Roche), for 10 min, at 99 ºC. After cooling, the beads were incubated at 37 ºC, overnight, either with 5 mU endoglycosidase H (Endo H; Roche) in 50 mM sodium citrate pH 5.5 or with 2.5 mU peptide N-glycosidase F (PNGase F; Prozyme) in 50 mM sodium phosphate pH 7.5 with 10 mM EDTA
Table 2.2 – Lectins, competitive sugars and conditions used in lectin blotting analysis.
15 and 1% (w/v) Nonidet P-40. For sialidase digestion, beads were incubated with neuraminidase from Vibrio cholerae in the conditions described above.
2.6 Nanoparticle tracking analysis
Concentration and size distribution of EVs were measured using a NanoSight NS500 (NanoSight Ltd). The samples were diluted in sterile PBS to get a particle concentration in the instrument linear range (108-109 particles/mL). All measurements were performed at 22 °C.
Sample videos were analyzed with the Nanoparticle Tracking Analysis (NTA) 2.3 Analytical software – release version build 0025. Videos of 60-second were acquired and the average of ten measurements was considered as a representative result. Capture settings (shutter and gain) were adjusted manually. The mean size and standard deviation values of the major peak were calculated by taking into account all measurements.
2.7 MALDI-TOF/TOF analysis and protein identification
17
3. Results
3.1 Characterization of OVMz cell line
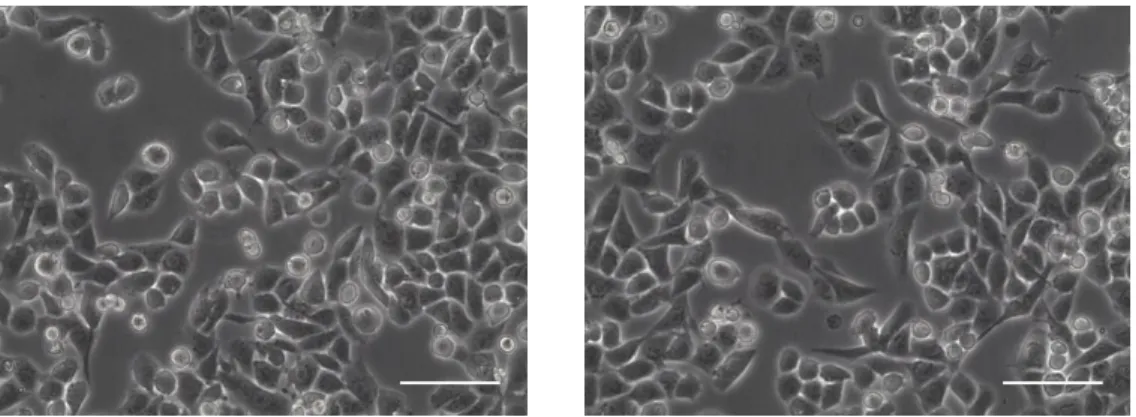
In this work, the human ovarian carcinoma cell line, OVMz, was used (Fig. 3.1), as an experimental cell model for ovarian cancer.
The growth of OVMz cells was monitored during five days and it is represented in figure 3.2. Cells were counted and cell viability was determined by the trypan blue exclusion test.
Initially there was a decrease in cell density. This could be due to the cells not being adherent or being dead in suspension. After the second point (t=4 h) there was an increase and cells continued to grow during approximately three days. After that (t=70 h) cells entered a stationary phase in which they had already reached maximum confluence.
3.2 Isolation and characterization of EVs and MBs
EVs were isolated from OVMz confluent cells that were cultivated in serum-free medium, for 48 h. Cell viability was 99±1% (n=18), therefore, the absence of serum did not affect cell integrity. In this way, apoptotic vesicles were not significant contaminants of the EVs fraction.
Figure 3.1 – Optical microscopy visualization of OVMz cells. The scale bar corresponds to 100 µm.
Figure 3.2 – Growth curve of OVMz cells. Cell density (closed symbols) and viability (open symbols) curves are presented. Results correspond to duplicates or triplicates and are presented as means±SD. 0 20 40 60 80 100 0.0 0.5 1.0 1.5 2.0 2.5 3.0 3.5 4.0
0 20 40 60 80
C ell Viabilit y (%) C ell D ens ity (x 10
5 c
ells
/c
m
2)
18
The cell supernatant was collected and sequentially centrifuged at 500, 10000 and 100000xg for 10, 20 and 120 min, respectively (Fig. 3.3) (Escrevente et al. 2013). The amount of protein recovered was typically 130 µg/T175 as evaluated by the BCA quantification method.
The fractions recovered during the EVs isolation and the cellular extract were analyzed by immunoblotting to detect several EVs markers: CD63 (Escola et al. 1998, Lamparski et al. 2002), Tsg101 (Bobrie et al. 2012) found in exosomes (EVs from endosomal origin), CD9, described in microvesicles (EVs from plasma membrane budding) (Bobrie et al. 2012), L1CAM detected on the plasma membrane and exosomes (Stoeck et al. 2006), and LGALS3BP described in exosomes (Escrevente et al. 2013) (Fig. 3.4A). Here, the EVs fraction was strongly enriched in all these proteins, indicating that it contained microvesicles and exosomes.
Figure 3.3 – Diagrammatic representation of the EVs and MBs isolation procedure.
Centrifugation 500xg Supernatant Cells Supernatant Centrifugation 10000xg Pellet F1 Supernatant Centrifugation 100000xg Pellet F2 Pellet EVs Supernatant F3 Sonication Centrifugation 100000xg Supernatant S Pellet MBs Confluent OVMz cells, serum-free
medium, 48 h
Figure 3.4 – Isolation of EVs from OVMz cells. (A) Immunoblotting of EVs markers in cellular
extracts (CE), fractions collected during the purification (F1, F2, F3) and extracellular vesicles (EVs).
Three μg of total protein were applied per lane with the exception of CE where ten μg of total protein
were used. Detection was by the chemiluminescent method. Results were representative of two experiments; (B) NTA distribution profile of a representative population of EVs diluted in sterile PBS
and analyzed using NanoSight NS500 equipment.
0 1 2 3 4 5 6 7
0 200 400 600 800 1000
Con ce ntrat ion ( 10 6pa rticl es/m l)
Particle size (nm) A 110 80 60 50 30 CD63
kDa CE F1 F2 F3 EVs
19 The EVs were also analyzed by NTA and a representative population is shown in figure 3.4B. The EVs fraction was diluted in sterile PBS in order to have a particle concentration of 108-109 particles/mL, within the instrument linear range. Taking in account all the measurements done, the population observed was very heterogeneous with sizes between 30 and 900 nm. The primary peak ranged between 91 and 191 nm and the mean average was 145±26 nm, n=24. The heterogeneity of the population is explained by the EVs isolation method used, an ultracentrifugation at 100000xg, which allows different subtypes of vesicles to co-sediment (Colombo et al. 2014).
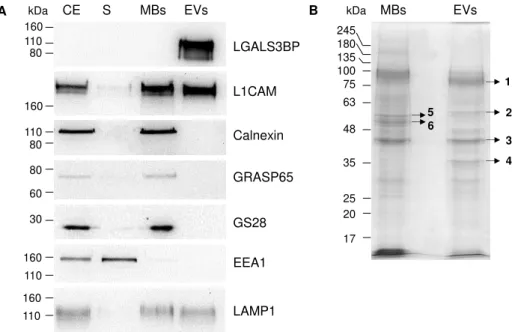
Total cell membranes (MBs) were obtained for protein profile comparison with the EVs. MBs were isolated as a pellet of a 100000xg centrifugation, after cell sonication on ice. The MBs fraction was characterized by immunoblotting to detect proteins present in cellular membranes: L1CAM from the plasma membrane, calnexin from the endoplasmic reticulum, GRASP65 and GS28 from the Golgi apparatus, EEA1 from the early endosomes and LAMP-1 from the lysosomes (Fig. 3.5A).
The MBs fraction was enriched in all the proteins tested indicating that this fraction contained membranes from different cellular organelles (Fig. 3.5A). For EEA1, the signal was more intense in the corresponding supernatant because EEA1 is a peripheral membrane protein, which was probably released by the sonication process. The protein LGALS3BP was not detected in the MBs fraction but was enriched in EVs.
Figure 3.5 – Comparison of protein profiles of MBs and EVs from OVMz cells. (A) Immunoblotting
of cellular extracts (CE), post-100000xg supernatant from MBs isolation (S), MBs and EVs. Ten μg of
total protein were applied per lane with the exception of EVs in the incubation with LGALS3BP where
three μg of total protein were used. Detection was by the chemiluminescent method. Results were representative of three experiments; (B) SDS-PAGE analysis of proteins of MBs and EVs. Ten μg of
protein were applied per lane. Protein detection was with Coomassie R-250.
A B
1
2
3
4
kDa MBs EVs
5 6 245 180 135 100 75 63 48 35 25 20 17 160 110 80 LGALS3BP 160 L1CAM 110 80 Calnexin 160 110 LAMP1 160 110 EEA1 30 GS28 80 60 GRASP65
20 A B PNGaseF Sialidase EndoH
kDa EVs Ctr bufH bufH+ bufF bufF+
EndoH PNGaseF IP 135 100 75 63 48 35 25 20
kDa EVs w/o w/o Ctr bufS bufS+ EVs Ab sialidase
IP 160 110 80 60
*
*
*
*
3.3 MALDI-TOF/TOFProteins from MBs and EVs fractions were analyzed by SDS-PAGE and distinct protein profiles were observed (Fig. 3.5B). The protein bands enriched in each of the fractions were excised from the gel, digested with trypsin and identified by MALDI-TOF/TOF. The results are shown in table 3.1.
The extracellular matrix protein LGALS3BP was identified in the EVs fractions. This protein has a nominal mass of approximately 65 kDa but it appeared at around 110 kDa in the immunoblotting (Fig. 3.4A) since the protein is heavily glycosylated with seven N-glycosylation sites, which are occupied for truncated forms expressed in HEK293 cells (Hellstern et al. 2002). All the other identified proteins had a cytoplasmic origin and they were either cytoskeleton constituents (actin, tubulin, vimentin), present on MBs and EVs fractions, or enzymes (pyruvate kinase and glyceraldehyde-3-phosphate dehydrogenase), only identified on the EVs fraction. All proteins had already been previously identified in EVs (Vesiclepedia, http://microvesicles.org/).
3.4 LGALS3BP glycosylation
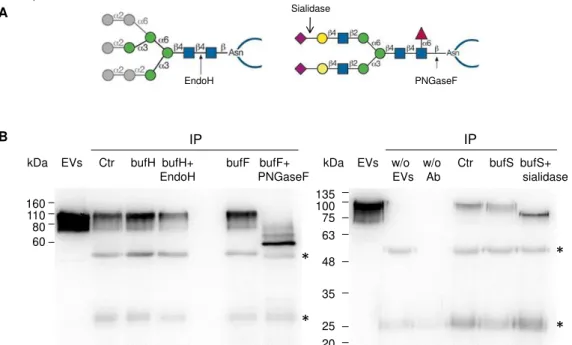
In order to study the glycosylation of LGALS3BP, this protein was immunoprecipitated from EVs fraction and deglycosylated with the enzymes: Endo H, PNGase F and V. cholerae sialidase. PNGase F hydrolyzes the bond between Asn and GlcNAc in all types of N-glycans.
Endo H cleaves the bond between GlcNAcβ1-4GlcNAc only in oligomannose and hybrid N-glycans. V. cholerae sialidase hydrolyzes α2,3-, α2,6- and α2,8- linked N-acetylneuraminic acid (Fig. 3.6A).
Figure 3.6 – Deglycosylation of immunoprecipitated LGALS3BP. (A) Schematic representation of
enzymatic action of Endo H, PNGase F and V.Cholerae sialidase. (B) LGALS3BP was deglycosylated with Endo H, PNGase F, and V. cholera sialidase after immunoprecipitation from EVs (Ctr). The input
EVs contained three μg of total protein. As control for the digestion the immunoprecipitate was incubated with the corresponding buffer (bufH for Endo H, bufF for PNGase F and bufS for sialidase). The controls of the immunoprecipitation without EVs (w/o EVs) and without antibody (w/o Ab) were also shown in the second panel. The blots are representative of two (Endo H) or four (PNGase F and sialidase) experiments. Immunoglobulin G bands are represented with *.
21
Gel
band Protein name
UniProt identifier
Gene Name
Nominal mass (Mr)
Protein Score
Sequence coverage (%)
Queries
Matched Vesiclepedia
1
Galectin-3-binding
protein LG3BP_HUMAN
LGALS3B
P 65289
460 27 13 +
Alpha-actinin-4 ACTN4_HUMAN ACTN4 104788 50 10 8 +
2 Pyruvate kinase PKM KPYM_HUMAN PKM 57900 47 18 7 +
3
Actin, cytoplasmic
2 ACTG_HUMAN ACTG1 41766 447 50 15 +
Actin, alpha cardiac muscle Actin, alpha skeletal muscle ACTC_HUMAN ACTS_HUMAN ACTC1 ACTA1 41992 42024
166 19 7 +
+
4
Glyceraldehyde-3-phosphate
dehydrogenase G3P_HUMAN GAPDH 36030 157 52 16 +
Ezrin Moesin Radixin EZRI_HUMAN MOES_HUMAN RADI_HUMAN EZR MSN RDX 69370 67778 68521
69 3 3 + +
+
5 Vimentin VIME_HUMAN VIM 53619 415 48 21 +
6
Keratin, type II
cytoskeletal 8 K2C8_HUMAN KRT8 53671 84 21 12 +
Tubulin alpha-1B
chain TBA1B_HUMAN TUBA1B 50120 74 22 7 +
Tubulin beta-4A chain Tubulin beta-4B chain TBB4A_HUMAN TBB4B_HUMAN TUBB4A TUBB4B 49554
49799 54 18 6
+
+
Table 3.1 – List of proteins identified in EVs and MBs from OVMz cells using MALDI-TOF/TOF after SDS-PAGE separation. Bands were excised from the gel shown in figure 3.5B. The data analysis was kindly performed by Dr. Patrícia Gomes-Alves.
22
The results showed that controls of immunoprecipitation (w/o EVs and w/o Ab) were efficient since non-specific bindings were not detected. LGALS3BP was successfully immunoprecipitated from EVs fraction since a band at 110 kDa was observed on the immunoprecipitation control (Ctr) (Fig. 3.6B).
LGALS3BP was not deglycosylated by Endo H since the signal was similar to the control. Incubation with PNGase F caused a shift to a mass of approximately 60 kDa corresponding most likely to the fully deglycosylated form. Other bands less intense with superior molecular mass were also observed that could correspond to protein forms not fully deglycosylated or to another type of PTM. Digestion with V. cholerae sialidase also caused a downward shift of LGALS3BP indicating the presence of sialic acid. Altogether, these results indicate that LGALS3BP is a sialoglycoprotein with complex N-glycans (Fig. 3.6).
3.5 Glycosignatures of EVs and MBs
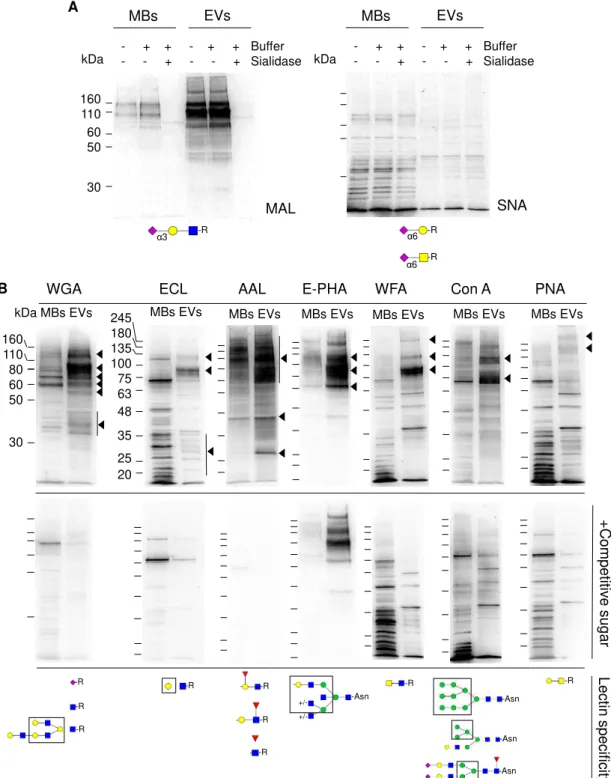
MBs and EVs glycan profiles were also compared by lectin blotting with nine different lectins (MAL, SNA, WGA, ECL, AAL, E-PHA, WFA, Con A and PNA). The lectins specificity is indicated in figure 3.7 below the blots. The results showed specific distinct glycosylation patterns between MBs and EVs (Fig 3.7).
EVs were enriched in glycoproteins containing α2,3-linked sialic acid, detected with MAL, and a strong band was observed at approximately 110 kDa. MAL binding was specific since it disappeared after sialidase digestion (Fig. 3.7A). The 110 kDa band consisted of LGALS3BP since immunoprecipitated LGALS3BP was detected by MAL (data not shown).
The cells did not contain glycoproteins with α2,6-linked sialic acid since the signal obtained with SNA was not specific as it persisted after sialidase incubation (Fig. 3.7A).
23 Figure 3.7 – Comparison of glycosignatures from MBs and EVs. (A) Lectin blotting with biotinylated MAL and SNA. As control for the lectin blotting, the samples were desialylated with V.
cholera sialidase. (B) Lectin blotting with biotinylated WGA, ECL, AAL, E-PHA, WFA, and PNA, and
non-biotinylated Con A (upper panels). Controls with competitive sugars as indicated in Material and Methods, are shown in the lower panels. Lectin specificities (Varki et al. 2009) are shown below the blots. Glycan representation is according to the nomenclature of the Consortium of Functional Glycomics. The lanes contained ten μg of total protein. Detection was by the chemiluminescent method. Major specific bands are indicated on the right with arrowheads. The blots are representative of at least three experiments.
+C om pet itiv e sugar Lec tin spec ific ity -Asn -Asn -R -R -Asn +/ --R --R --R --R -R -R -R -Asn B
kDa MBs EVs 245 MBs EVs 180 135 100 75 63 48 35 25 20
MBs EVs MBs EVs MBs EVs MBs EVs MBs EVs
WGA ECL AAL E-PHA WFA Con A PNA
160 110 80 60 50 30 160 110 60 50 30 - + + - + + - - + - - + MBs EVs Buffer Sialidase MAL kDa SNA - + + - + + - - + - - + MBs EVs Buffer Sialidase kDa -R
α3 α6 -R
α6 -R
24
3.6 Effect of kifunensine
Since EVs displayed specific glycosignatures (Fig. 3.7), the impact of glycosylation inhibition on EVs (glyco)protein composition was studied. In order to do that, confluent cells were cultured in serum free medium in the presence of 5 µM of KIF for 48h. KIF inhibits the
enzyme α-mannosidase I causing the accumulation of Man7-9GlcNAc2, and leads to the absence
of complex and hybrid N-linked glycans in glycoproteins (Varki et al. 2009).
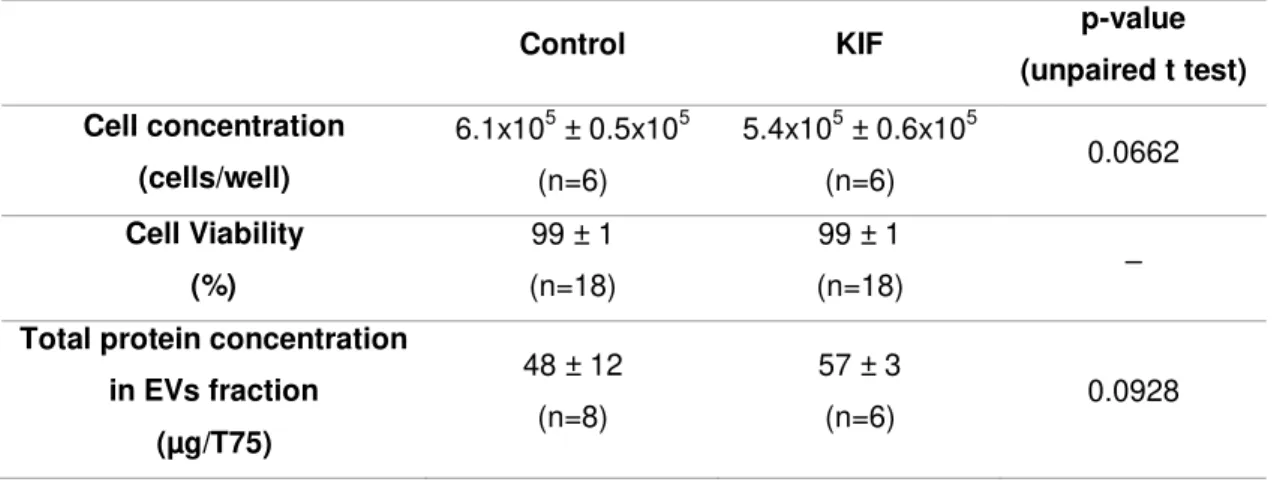
Cell concentration, cell viability and total protein concentration of EVs fraction were measured, in the presence or absence of KIF (Table 3.2). Cell viability was not affected by the inhibitor. On the other hand, KIF caused a trend towards a decrease in cell concentration and an increase in total protein concentration in the EVs fraction but the differences were not statistically significant (p>0.05).
Proteins from the MBs and EVs fractions recovered in the absence (control) or presence (KIF) of KIF were analyzed by SDS-PAGE (Fig. 3.8A). The lane intensities were comparable and for LGALS3BP a downwards shift was observed indicating a transition from complex N-glycans to high mannose N-glycans. Indeed, high mannose N-glycans have lower molecular mass (e.g. Man9GlcNAc2 has 1883 Da) than complex glycans (e.g. complex sialylated
diantennary with proximal fucose has 2369 Da or complex sialylated tetraantennary with proximal fucose has 3681 Da).
The effect of KIF on the recruitment of the glycosylated (CD63, LGALS3BP, L1CAM, CD9) and non-glycosylated (Tsg101, annexin-I) EVs markers into vesicles, was studied by immunoblotting (Fig. 3.8B). The KIF concentration efficiently inhibited glycosylation since for the glycoproteins CD63, LGALS3BP and L1CAM a downwards shift was observed which corroborates the results from figure 3.8A.
KIF caused a decrease in the intensity of the bands corresponding to CD63, LGALS3BP, L1CAM, CD9, Tsg101 and annexin-I (Fig. 3.8B). These results were supported by the values of the ratio KIF/control obtained from a semi-quantitative analysis of the immunoblottings (six replicates) (Fig. 3.8C). Particularly, the level of Tsg101 in EVs was the lowest whereas the level of annexin-I was the highest.
Control KIF p-value
(unpaired t test)
Cell concentration
(cells/well)
6.1x10⁵ ± 0.5x10⁵
(n=6)
5.4x10⁵ ± 0.6x10⁵
(n=6) 0.0662
Cell Viability
(%)
99 ± 1 (n=18)
99 ± 1
(n=18) –
Total protein concentration
in EVs fraction
(µg/T75)
48 ± 12 (n=8)
57 ± 3
(n=6) 0.0928
Table 3.2 – Effect of 5 µM KIF on cell concentration, cell viability and total protein concentration in EVs fraction.
25 Rati o KI F/Cont rol 0 0,2 0,4 0,6 0,8 1 1,2 C
kDa MBs EVs MBs EVs
KIF Control B CD63 63 48 35 LGALS3BP 100 75 245 L1CAM 25 20 CD9 48 Tsg101 Annexin-I 35 A 245 180 135 100 75 63 48 35 25 20
kDa MBs EVs MBs EVs
KIF Control
27
4. Discussion
Ovarian cancer is the most lethal gynecological cancer and its early detection is a key factor to a positive therapeutic outcome. The biomarker used in clinics, CA-125, lacks sensitivity since its levels are only increased in 50% of the women with ovarian cancer, at an early stage. Also, this marker is found overexpressed in other pathologies, thus hindering its specificity. Taking these in to account there is an urgent need to find novel biomarkers for ovarian cancer.
EVs can have an endosomal origin or be formed by plasma membrane budding. They are secreted by various cell types and are also present in biological fluids. These vesicles are important mediators of intercellular communication, carry information from cells and participate in many biological processes. As such, targeting EVs, in particular by studying protein cargo and patterns of glycosylation, which are altered in cancer, is now seen as a novel potential target of biomarker identification.
In this work, a human ovarian carcinoma cell line, OVMz, was used as an experimental model for ovarian cancer. The isolated EVs secreted by these cells were enriched in specific EVs markers and the vesicles population had an average size of 145 nm. Also, EVs displayed specific glycosignatures distinct from their parent cell membranes, with a strong enrichment in
α2,3-linked sialic acid, fucose and bisecting GlcNAc. Finally, the inhibition of complex and hybrid N-linked glycans caused decreased levels of EVs markers, including glycoproteins into the vesicles.
4.1 EVs characterization and purification
EVs were isolated from confluent OVMz cells by sequential centrifugations. In order to confirm the identity of the isolated EVs and to monitor the isolation process, all the recovered fractions as well as the cellular extract were analyzed by immunoblotting to detect the following EV markers: CD63 (Escola et al. 1998, Lamparski et al. 2002), Tsg101 (Bobrie et al. 2012), CD9 (Lamparski et al. 2002), L1CAM (Stoeck et al. 2006) and LGALS3BP (Escrevente et al. 2013). The tetraspanin CD63 and Tsg101, proteins involved in exosome biogenesis, were particularly enriched in the EVs fraction and were also detected in the cellular extract. This result was expected since these two proteins are specific exosome markers.
The enrichment of the tetraspanin CD9 was also detected on the EVs fraction where two bands were observed (Fig. 3.4A). This indicated that different forms of CD9 probably with different post-translational modifications would be present in the EVs since this protein has two potential N-glycosylation sites and can be palmitoylated (Charrin et al. 2002). The tetraspanin CD9 is also a microvesicle (vesicles originated from the budding of the plasma membrane) marker and its presence on larger vesicles, pelleted at 10000xg, had previously been detected (Bobrie et al. 2012). Considering these facts, the presence of CD9 also in the F2 fraction was expected.
28
several enzymes in different locations converting the transmembrane protein into a soluble form (Mechtersheimer et al. 2001). A difference in migration of L1-CAM for F3 and EVs fractions was observed (Fig. 3.4A) so the L1CAM present in F3 could be a soluble form of this protein, resulting from the ectodomain cleavage. Moreover, in the cellular extract lane, two bands with molecular mass above 160 kDa were also detected indicating that different L1CAM forms could be present in this fraction. In fact, different L1CAM forms were detected in several cellular compartments and exosomes secreted by two ovarian cancer cell lines (Stoeck et al. 2006).
The glycoprotein LGALS3BP had previously been identified as exosome marker in SKOV3 ovarian cancer cells (Escrevente et al. 2013) and also other cells (Vesiclepedia, http://microvesicles.org/). In OVMz cells, an enrichment of this protein in the EVs fraction was also detected, by immunoblotting (Fig. 3.4A). LGALS3BP was also detected in the F3 fraction but not in the cellular extract. This protein is from the extracellular matrix and is capable of binding different cell surface proteins like collagens IV, V, VI, fibronectin, nidogen, integrin β1 and the lectin galectin-3 (Sasaki et al. 1998), which are all present in EVs (Vesiclepedia, http://microvesicles.org/). It is possible that LGALS3BP interacts with these proteins extracellularly explaining its presence in EVs and F3 fractions. However, further studies are necessary to understand the LGALS3BP localization and interactions on the EVs. One possibility could be the detection of LGALS3BP by imaging techniques including immunofluorescence microscopy of cells and electron microscopy with immunogold labeling of EVs.
29 approximately 100 nm and smaller vesicles with a size between 30-50 nm were visible, however, in crude exosomes larger vesicles and vesicle aggregates were also observed (Escrevente et al. 2013). These results suggest that although a crude preparation of EVs can be isolated by ultracentrifugation, the method is not ideal to purify EVs subpopulations, such as exosomes.
Altogether, these results indicated that the fraction isolated by ultracentrifugation contained extracellular vesicles since it was enriched in specific EVs markers and the vesicle size agreed with reported results from the literature.
4.2 Protein sorting and glycosylation
The glycosylation patterns of EVs and MBs were compared by lectin blotting, using nine lectins with different specificities. The results showed that EVs displayed specific glycosignatures very distinct from their parent cell membranes. Previous results from the literature had already reported that EVs secreted by other cells, such as, T-cell lines (Jurkat, SupT1 and H9), colon cancer lines (HCT-15 and HT-29), skin cancer line (SkMel-5) (Batista et al. 2011) and SKOV3 ovarian cancer cells (Escrevente et al. 2011) had specific glycosignatures.
The EVs fraction showed an enrichment in glycoproteins with α2,3-linked sialic acid (recognized by MAL lectin) but glycoproteins with α2,6-linked sialic acid (recognized by SNA lectin) were not detected. These findings are distinct from previous ones where glycoproteins from SKOV3 ovarian cancer cells, had sialic acid in both types of linkage (Escrevente et al. 2011). This difference could be explained by the different cell line used. Major glycoproteins detected with MAL were also detected with WGA, which also recognizes sialic acid. Sialic acid has an important role in protein glycosylation since it is involved in different biological processes like cellular recognition, cell adhesion and cell signaling (Christiansen et al. 2014). In cases of cancer, increased expression of sialylated glycoproteins promotes the disruption of cell–cell adhesion, improving tumorigenesis (Pinho and Reis 2015).
Another structure that was found highly enriched in EVs was fucose as detected by AAL
binding. Since AAL recognizes α1-2,-3, or -6-linked Fuc (Varki et al. 2009) but considering that OVMz cells did not express Lewisy or Lewisx antigens (Escrevente et al. 2006), then the signal
obtained with AAL probably corresponded to proximal fucose (Fucα1-6GlcNAc). In agreement,
no specific binding was detected with UEA lectin that recognizes Fucα1-2Gal (data not shown). The bisecting GlcNAc structure, detected by E-PHA lectin, was specifically enriched in the EVs fraction. This structure had already been identified in human endometrioid ovarian cancer tissues (Abbott et al. 2008). It was also found in membrane proteins of serous ovarian cancer cell lines (Anugraham et al. 2014) and in human primary endometrioid and serous ovarian cancer tissues (Allam et al. 2015).