Abstract
We present a computer program developed for estimating penetrance rates in autosomal dominant diseases by
means of family kinship and phenotype information contained within the pedigrees. The program also determines the
exact 95% credibility interval for the penetrance estimate. Both executable (PenCalc for Windows) and web versions
(PenCalcWeb) of the software are available. The web version enables further calculations, such as heterozygosity
probabilities and assessment of offspring risks for all individuals in the pedigrees. Both programs can be accessed
and down-loaded freely at the home-page address http://www.ib.usp.br/~otto/software.htm.
Key words:
penetrance (rate, value), computer program, maximum likelihood estimation.
Received: March 1, 2010; Accepted: May 5, 2010.
Accurate penetrance estimates are important for
de-termining genetic disease recurrence risks in families
where incompletely penetrant Mendelian disorders are
seg-regating or for establishing genetic map locations by
link-age analysis. While crude penetrance estimates can be
rapidly derived by dividing the number of observed
indi-viduals expressing a disease phenotype by a rough estimate
of the probable number of carriers in a given pedigree
ex-hibiting autosomal dominant inheritance, deriving exact
maximum likelihood estimates of carrier status at an
indi-vidual level is time consuming and tedious. In this paper,
we describe the structure and use of a computer program
designed to be user friendly and assist genetic counselors
and gene mappers to make accurate penetrance estimates in
all sizes and complexities of autosomal dominant
pedi-grees, including those containing consanguineous loops
and twin pairs.
The program deals with the situation of a single
monogenic locus (
A, a
), with allele
A
dominant in relation
to allele
a
. In the case of human autosomal dominant
dis-eases, the homozygous condition
AA
is generally either
un-known or very rare (given a low population frequency of
the pathogenic allele
A
), so that in pedigrees with cases of
autosomal dominant disease the affected individuals are
al-most invariably
Aa
heterozygotes, while normal
individu-als are either
aa
homozygotes or non-penetrant
Aa
hetero-zygotes. In this sense, the penetrance rate
K
is assumed to
be the probability of an
Aa
heterozygote being affected:
K = Prob(affected|Aa).
The penetrance rate estimation can be performed for
polymorphic traits from familial aggregates including pairs
of twins or other groups of close relatives, or, in the case of
rare human diseases, through the analysis of phenotype
segregation in pedigrees (a complete revision on this
sub-ject can be found in Horimoto and Otto, 2008). The
algo-rithms are based on methods detailed by Rogatko (1986)
and Horimoto (2009).
PenCalc for Windows was developed using
Micro-soft Visual Basic 6.0. This compressed, self-installing
pro-gram can be obtained free of charge from the home page
http://www.ib.usp.br/~otto/software.htm. The same page
contains the access link to the PenCalcWeb Internet (www)
program, developed using Active Server Pages (ASP),
through the languages VBScript and Jscript. Both
pene-trance programs are the intellectual property of the authors,
and as such, any use of or reference to the materials
in-cluded in them, must contain an explicit reference to their
origin. Feedback from users is welcome and will be used to
improve the program and to correct unforeseen flaws.
Both programs are described in figures obtained
di-rectly in real time from screen images generated by the
pro-grams themselves.
First we describe PenCalc for Windows. To illustrate
the operation of the program, we will use as example the
hypothetical pedigree shown in Figure 1. At left of this
fig-ure is represented the whole pedigree and at right the
fil-tered genealogy from which we identify the following tree
structures pertinent to penetrance estimation: three affected
(penetrant) individuals (II-4, III-4, and IV-1); four obligate
non-penetrant individuals (I-1, II-1, II-3, and III-1); two
normal individuals without offspring descending from an
obligate (penetrant or non-penetrant) carrier of the gene
(II-5 and II-6); and two 2-generation trees of normal
indi-viduals, one with two individuals in the second generation
(II-2, III-2, and III-3), the other with three
second-generation individuals (III-5, IV-2 to IV-4).
Options
File
,
Data Input
and
Help
appear in the
main menu of the program’s opening page. The
File
menu
accesses options for exiting the program, for saving or
printing the text file generated by the program to show the
likelihood function, the estimate of K (penetrance value)
and its exact 95% credibility interval. The
Data Input
menu program allows the writing of a data file through the
File
submenu option
Create
(Figure 2), accessing an
exist-ing data file through the
File
submenu option
Open
, or
en-tering the data through specific program forms (
Screen
option, Figures 3, 4, 6, and 7). The
Help
menu accesses a
graphic interface with the program credits (option
About...
) or gives information on the use of the user’s
Manual
in pdf format.
The input of consanguineous structures is far more
complicated; we shall use the example shown in Figure 5,
where individuals I-1 and II-2 are assumed to be both
descendents of related obligate carriers. In order to simplify
not only the calculations but also the input of data, it is
as-sumed that the dominant allele has been transmitted to the
Figure 1- Hypothetical pedigree with individuals affected by an autosomal dominant disease. The whole pedigree is shown on the left; on the right all in-dividuals and tree structures pertinent to penetrance estimation are shown – the gray boxes indicate the two trees of normal inin-dividuals that occur in the fil-tered pedigree.Figure 2- Interface for pedigree data input. Information on the pedigree structure under study is typed into the text box in a standardized manner using commas to separate items on the same line and carriage return to ter-minate lines (for full details, refer to the pdf manual). The data on the first line(3,4,2)indicates the number of affected penetrant individuals, obli-gate non-penetrant individuals and normal individuals without offspring descending from obligate carriers (penetrant or non-penetrant), respec-tively. In the second line(2,2,3), the first figure (2)is the number of 2-generation trees of normal individuals; the digits that follow(2,3)are their corresponding offspring numbers. The next three lines containing one zero indicate, respectively, that no trees exist of normal individuals with 3, 4, or 5 generations; the line with three zeros, that there are no same-sex twin-pairs with both individuals normal, or one normal and one affected, or both affected; the zero on the last line, that no consanguineous trees occurred in the pedigree. TheBackcommand button returns the main screen without saving the input data. TheSave Asbutton uses Windows standard commands for saving the data. When this takes place, the program automatically exhibits the results on the graphic interface (see Figure 8).
Figure 4- Final aspect of the graphic interface for data input for 2-gene-ration trees of normal individuals, after the number(2)of two-generation trees of normal individuals is entered and theOKcommand button is keyed in. TheEnterbutton saves the data in the boxes labeled Tree 1 and Tree 2 and then returns to the initial screen of data input (Figure 3). Similar graphic interfaces are presented for data input of 3-, 4-, and 5-generation trees of normal individuals (details on data input for these cases are ex-plained in the program manual).
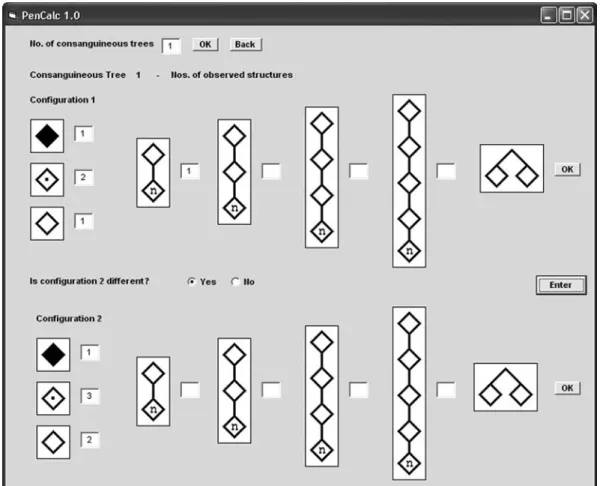
Figure 5- Example of a consanguineous tree (at left) that is split into two different configurations, 1 and 2. Configuration 1 has the following struc-tures: one two-generation tree of normal individuals (I-1 and II-1), two non-penetrant obligate carriers (II-2 and III-1), one affected (penetrant) in-dividual (IV-2) and one normal inin-dividual without offspring (IV-1), born to an obligate carrier. Configuration 2 has the following structures: three obligate non-penetrant carriers (I-1, II-1, and III-1), one affected (pe-netrant) individual (IV-2), and two normal individuals without offspring (II-2 and IV-1), both born to obligate carriers. All these data should be en-tered into the input window for consanguineous data shown in Figure 6.
We next describe the program PenCalcWeb. Initially,
the program shows graphic interfaces for entering data,
similar to those for PenCalc for Windows. Because of the
flexibility of the programming language, PenCalcWeb is
far more intuitive to use than PenCalc for Windows. Only
the final screen with results is shown in Figure 10.
Figure 7- Data input of possible types of twin-pair occurrences (bothnormal individuals; one normal individual and one affected; both af-fected). These structures did not occur in the example pedigree of Fig-ure 1 and the data input window is shown here just for descriptive pur-poses. The window above is accessed through data input windows shown in Figures 3 and 6 (respectively for non-consanguineous and consanguineous trees).
Figure 8- Interface showing the final results derived from the example pedigree given in Figure 1. After all the pertinent data are keyed in, the program exhibits the estimate of the penetrance rate K, its exact 95% credibility interval, and (inside the text box) the formula for the corre-sponding likelihood function. A blank field with the option to identify the pedigree is also presented by the interface. The results can be re-corded or printed through theFilesubmenus optionsSave asorPrint. TheFilesubmenu optionExitcloses the program, erasing all data that were not saved.
Figure 9- Interface of the program with the results for a pedigree contain-ing two consanguineous trees (example adapted from Naveedet al., 2006). The final likelihood function of the family consists of a common non-inbred part multiplied by each one of the four possible combinations of the formulae of one split tree from the first consanguineous tree and one from the other. The final estimate of K for the whole pedigree is obtained by weighing each of these four estimates K11, K12, K21, and K22 by the cor-responding reciprocals of their variances. The lower and upper limits of the 95% credibility interval of the final estimate are also obtained by weighing the individual lower and upper limits of each Kij estimate by the corresponding reciprocals of the variances var(Kij). In the case of the worked example of Figures 5 and 6, there is just one consanguineous tree and the final K estimate is obtained by combining the separate estimates for each of the two possible configurations.