ABSTRACT:Thermal comfort is of great importance in preserving body temperature homeosta-sis during thermal stress conditions.Although the thermal comfort of horses has been widely studied, there is no report of its relationship with surface temperature (TS). This study aimed to assess the potential of data mining techniques as a tool to associate surface temperature with thermal comfort of horses. TS was obtained using infrared thermography image processing. Physiological and environmental variables were used to defi ne the predicted class, which clas-sifi ed thermal comfort as “comfort” and “discomfort”. The variables of armpit, croup, breast and groin TS of horses and the predicted classes were then subjected to a machine learning process. All variables in the dataset were considered relevant for the classifi cation problem and the decision-tree model yielded an accuracy rate of 74 %. The feature selection methods used to reduce computational cost and simplify predictive learning decreased model accuracy to 70 %; however, the model became simpler with easily interpretable rules. For both these selection methods and for the classifi cation using all attributes, armpit and breast TS had a higher power rating for predicting thermal comfort. Data mining techniques show promise in the discovery of new variables associated with the thermal comfort of horses.
Keywords:feature selection methods, data mining, surface temperature, infrared thermography, thermoregulation
Introduction
Horses are homeothermic animals, i.e., they are capable of maintaining their internal body temperature relatively constant regardless of external infl uence. Ho-meothermy is achieved by activating thermoregulatory mechanisms. Among these, physiological mechanisms such as sweating and changes in heart rate, respiratory rate, and skin blood fl ow play especially important roles (Jodkowska et al., 2011; McKeever et al., 2010).
The effect of the thermal environment on thermo-regulation of horses has been studied previously by as-sessing heart and respiratory rate, sweat production, and rectal temperature (Castanheira et al., 2010; Kohn and Hinchcliff, 1995). However, no studies to date have eval-uated skin blood fl ow as a thermoregulatory response. Peripheral blood fl ow plays an important role in regulat-ing body temperature. The amount of peripheral blood fl ow produces thermal changes in the temperature at the surface of the body (Tattersall and Cadena, 2010). There-fore, the surface temperature of horses may constitute an indicator of change in thermoregulation (Jodkowska et al., 2011).
Infrared thermography permits the visualization of thermal superfi cial temperature variation and has been used to examine surface temperature in different regions of horse bodies (Autio et al., 2006; Jodkowska et al., 2011). The need for information and knowledge in this area makes data mining techniques a promising tool. Such techniques involve the use of sophisticated data analysis, including machine learning methods and math-ematical algorithms, to discover previously unknown patterns and relationships in datasets (Han et al., 2011).
Among the classifi cation techniques in data min-ing, decision tree models are popular because they are practical and simple to understand. A decision tree is a decision support tool that uses a tree-like graph or model of decisions, where each node denotes a test of an at-tribute value, each branch represents an outcome of the test, and the leaves represent the predicted classes. Clas-sifi cation rules can be easily extracted from a decision tree (Tsang, 2011).
The aim of this study was to investigate the po-tential of data mining techniques as a tool for predicting thermal comfort of horses using surface temperature in different points as the parameter.
Materials and Methods
This study was carried out in an equestrian center located in Campinas, São Paulo, Brazil (22°54’ S; 47°03’ W; 855 m a.s.l.), from Feb to Apr 2010. Five dark brown Anglo-Arab horses (Equus caballus) were studied during eight days. All horses had the same history of housing, management, and acclimation to exercise. Data were collected at the hottest time of the day, between 13h00 and 15h00, in different thermal conditions. Before data collection, horses were in their stalls and all measure-ments were taken inside the facility.
Air temperature (Tair) and relative humidity (RH) were monitored simultaneously during data collection. Tair was registered using a hot wire anemometer (-18 to 93 °C; resolution = 0.1 °C) and RH was measured using a Thermo-hygro-decibelimeter-luximeter (THDL) with an RH sensor (ranging from 25 to 95 %; accuracy = ± 5 %).
Received December 06, 2012
Accepted July 24, 2013
¹UNICAMP/FEAGRI, Av. Candido Rondon, 501, Barão Geraldo – 13083-875 – Campinas, SP – Brasil.
2Embrapa Informática Agropecuária, Av. Dr. André Tosello, 209 – 13083-970 – Campinas, SP – Brasil.
3Universidade Federal de Santa Maria/CESNORS, Av. Independência, 3571, Centro – 98300-000 – Palmeira das Missões, RS – Brasil.
4Faculdade de Jaguariúna, Rod. Ademar de Barros, km 127 Sul (SP-340) – Jaguariúna, SP – Brasil.
*Corresponding author <[email protected]>
Edited by: Concepta Margaret McManus Pimentel
A decision-tree-based model for evaluating the thermal comfort of horses
Ana Paula de Assis Maia1*, Stanley Robson de Medeiros Oliveira1,2, Daniella Jorge de Moura1, Juliana Sarubbi3, Rimena do Amaral
378
Maia et al. Decision tree applied to horse thermal comfort
To assess environmental conditions, a Comfort In-dex (CI), as previously used by Jones (2009), was calcu-lated as shown in equation 1:
CI = Tair (°F) + RH (%) (1)
Heart rate was measured using a stethoscope. Res-piration rate was counted by watching the torso for the movement of the ribcage and belly. Rectal temperature was measured with a mercury thermometer introduced into the rectum.
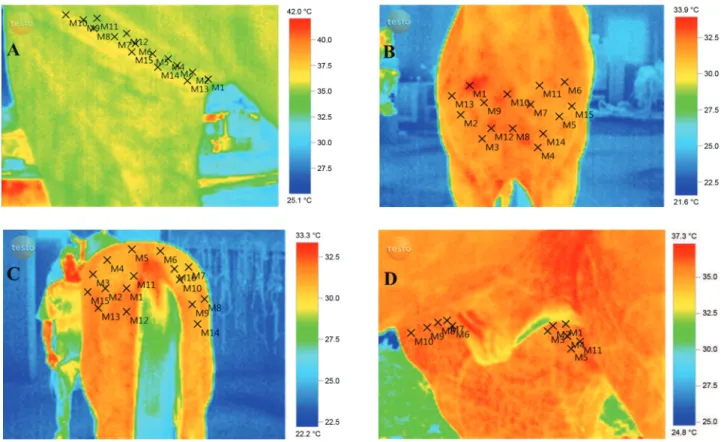
Surface temperature (TS) was assessed using an in-frared thermal imaging camera (accuracy = ± 0.1 °C; spectrum range = 7.5 to 13 µm) at four sites of the ani-mals´ bodies, with 15 randomly chosen points in each site (Figure 1). The camera was placed about 0.7 m from each horse´s armpit and groin and 1.6 m from the croup and breast. The measurements were taken at different distances calculated as indicated in the camera user's manual in order to measure the largest surface area possible. The thermal images were analyzed with Testo IRSoft® software, applying a cold/hot color scheme and
temperature scale between 17 °C and 40 °C. The emis-sivity coeffi cient () was set to 0.95 on all pictures, fol-lowing Autio et al. (2006).
The armpit and groin regions were chosen because they are highly vascularized (McCutcheon and Geor, 2008) and few studies have reported on the effective
participation of such body parts in the thermoregulation process. The croup is a region that is highly exposed to environmental conditions and it was used as a reference in the study of Kohn et al. (1999). The breast region pres-ents high thermal variability and can be estimated as representative of the average body surface area (Marlin et al., 1998).
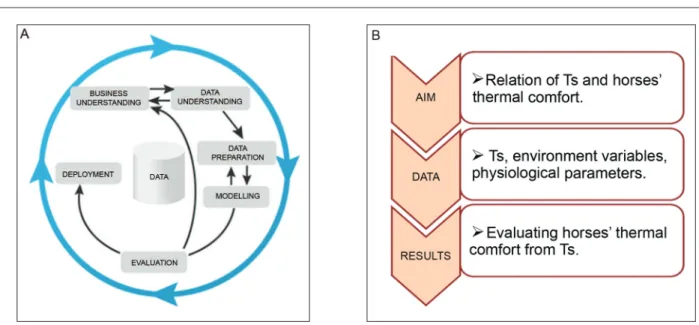
For data analysis (Data Mining), a learning algo-rithm for inducing decision trees was used to determine the relationship between TS and the thermal comfort of horses. The data mining (DM) project was performed in accordance with the six phases of the Cross-Industry Standard Process for Data Mining (CRISP-DM) meth-odology, as described by Chapman et al. (2000) (Figure 2A).
The fi rst phase included establishing the objectives and then converting them into a DM problem (Figure 2B). According to the aim of this project, CI and physio-logical parameters were used to determine the predicted class (thermal comfort). The next phase, called data un-derstanding, involved a literature review and initial data collection. Subsequently, the data preparation phase took place with the tabulation of data. Tair and RH data were converted into CI (Equation 1). To classify the pre-dicted class, physiological parameters and CI received a binary designation (0- inadequate and 1 - adequate) ac-cording to a range recommended in the literature (Table 1). Summing these adjustments yielded positive integer
The knowledge acquired from the decision tree can be represented by IF-THEN Rules for Classifi cation. Each classifi cation rule is a path from the root node to a leaf (a predicted class). Thus, it is possible to visualize these paths over the branches. Rules are the basis for predictive modeling. All generated decision trees were compared for accuracy rate, complexity based on the number of rules generated, and ability to understand these rules according to expert opinion. The experts were veterinarians who work in the equestrian center, researchers, and professors in animal thermal comfort. They possessed the knowledge and expertise required to make recommendations regarding selected thermal com-fort rules for horses.
There was a class imbalance problem in the data-set: 405 out of 600 instances were classifi ed as "discom-fort". Three balancing methods were used, including over-sampling (which randomly replicates samples from the minority class) and under-sampling (which random-ly eliminates samples from the majority class) (Batista et al., 2004).
The process of balancing classes changes the class distribution of training data, allowing the model to learn with minority class examples. This approach provides more accurate results (Batista et al., 2004; Laurikkala, 2001). A stratifi ed sample consisting of 10 % of the data was set apart for testing the built model, while 90 % of the remaining data were subjected to some methods that aim to balance class distribution, in-cluding sampling methods (Resampling), the Neighbor-hood Cleaning Rule (NCL), and the Synthetic Minor-ity Over-sampling Technique (SMOTE), summarized in Table 2.
For the Resampling method, three bias values were tested, which impact the distribution of data. The numbers from 0 to 4. From these summations, we
la-beled thermal comfort as "comfort" if the sum was 3 or 4, and "discomfort" if the sum was 0, 1 or 2.
After defi ning the predictive class (Thermal Com-fort), physiological parameters and CI were no longer used for further evaluations and thus excluded from the fi nal database. Hence, fi ve attributes composed the fi nal database: TS of four body parts (armpit, croup, breast and groin) as numerical variables and the predicted class, classifi ed as “comfort” and “discomfort”.
The decision tree was built using Weka®3.6.2.
soft-ware (Witten et al., 2011), notably the algorithm J48, referred to as C4.5 (Quinlan, 1993). The Weka default setting for parameters were used, except for the level of pre-pruning (minNumObj) that was set from 5 to 60. For testing the generated model, a 10-fold cross validation approach was used, i.e., the initial data were randomly partitioned into ten mutually exclusive subsets or folds, each of approximately equal size. Training and testing were performed ten times. The estimated accuracy of the model was the average of correct classifi cations from the ten iterations. In general, stratifi ed 10-fold cross-validation is recommended for estimating accu-racy due to its relatively low bias and variance (Han et al., 2011).
Figure 2 – A) Data mining phases according to CRISP-DM (Chapmanet al., 2000); B) Understanding the aim of the study: converting this knowledge into a DM problem.
Table 1 – Ideal ranges of variables used in the class attribute classifi cation.
Variables Ideal Range
380
Maia et al. Decision tree applied to horse thermal comfort
values used were 0 (data distribution is maintained); 1 (the classes of the training set are sampled according to the uniform distribution); and 0.5 (classes are balanced intermediately), as used and described by Crivelenti et al. (2009).
After applying the balancing methods to the data, feature selection methods were used to reduce the com-putational cost and simplify the model. These methods also identify the relevance of variables and their contri-bution to the model. The CFS, Infogain, Gainration, Chi-square, and Wrapper methods (Table 3) were compared. The analyses of data balancing and feature selection were performed using the Weka environment.
Results and Discussion
Model accuracy decreased gradually, almost 1 % for every additional fi ve objects per leaf (Figure 3). Like-wise, the number of generated rules decreased as objects per leaf increased. The higher the level of pre-pruning, the less specifi c the coverage of the classifi cation rules. Similar results were found by Sikora (2011). While Criv-elenti et al. (2009) found that model accuracy did not differ for pre-pruning levels used in their study because
they used a very large dataset, they did observe a reduc-tion in the number of rules.
Pruning is an adjustment to avoid data over-fi tting and to minimize noise or details of a training data set (Wang et al., 2010). Thus, the learning model is more comprehensive by reducing the generated tree. Pre-pruning of ten objects per leaf presented the highest ac-curacy (77 %) and generated 13 rules. However, some rules are redundant, which complicates their interpre-tation. The number of rules dropped 42 % when com-paring pre-pruning of 20 and 25 objects per leaf, and accuracy remained at 76 %. However, neither trees are practical because of the high number of rules: 12 and 7, respectively. These trees do assist, nevertheless, in the understanding and analysis of the data partitioning.
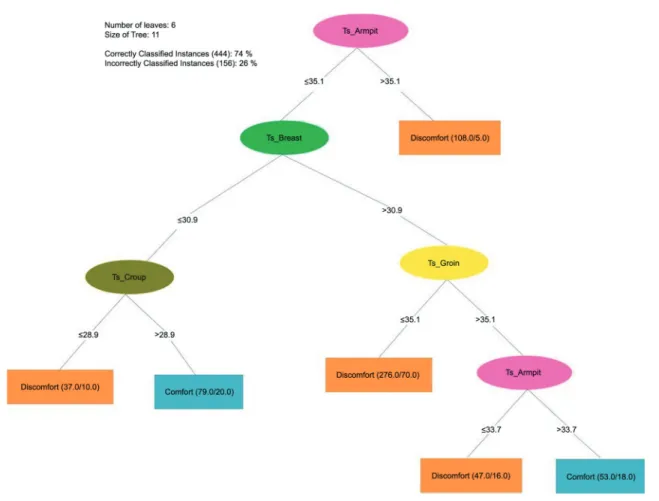
Sometimes it is more advantageous to choose a model with a smaller number of rules, even with a loss of accuracy, when the generated rules match the opin-ion of experts in animal thermal comfort. Thus, the best results were obtained for the level of pre-pruning of 35 objects per leaf, according to expert opinion. The accu-racy rate of that model was 74 % and six relevant rules were generated (Figure 4).
The problem of imbalanced data deserves particu-lar attention, since it can compromise the accuracy of the classifi er due to a possible introduction of bias into the model. As expected, the balancing methods altered the class distribution in the training set (Table 4). For example, NCL, an under-sampling method, caused a decrease of 42 % in the number of instances of the majority class (dis-comfort). In contrast, SMOTE, an over-sampling method, increased the minority class examples (comfort) in 44 %.
The balancing class methods did not improve mod-el accuracy and the built modmod-el (after sampling method for bias 0.5 and 1) presented the best results for accu-racy. In addition, this accuracy value was closer to that of the model generated with unbalanced data, although the decision tree was more complex due to a larger num-ber of rules. The precision for the "discomfort" class was greater than that for the "comfort" class. Corroborating results can be found in Crivelenti et al. (2009) and Wit-ten et al. (2011). These authors reported cases in which balancing methods did not affect model accuracy. In our case, results may be attributed to the small size of the Table 2 – Description of balancing methods.
Method Type Description Reference
Sampling Weka Filter
Balances the data set by means of a sampling replacement.
Witten and Frank, 2005
NCL sampling
Under-Removes examples from the majority class emphasizing data cleanliness using heuristics based
on K-nearest neighbor algorithm.
Laurikkala, 2001
SMOTE sampling
Over-Inserts elements in the minor-ity class by creating synthetic examples from an interpolation between the nearest neighbors of
the minority class.
Chawla et al., 2002
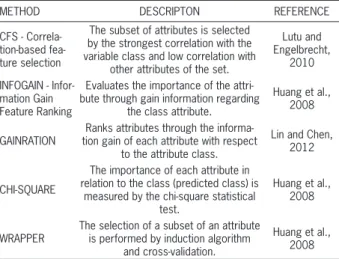
Table 3 – Description of feature selection algorithms.
METHOD DESCRIPTON REFERENCE
CFS - Correla-tion-based fea-ture selection
The subset of attributes is selected by the strongest correlation with the variable class and low correlation with
other attributes of the set.
Lutu and Engelbrecht,
2010
INFOGAIN - Infor-mation Gain Feature Ranking
Evaluates the importance of the attri-bute through gain information regarding
the class attribute.
Huang et al., 2008
GAINRATION
Ranks attributes through the informa-tion gain of each attribute with respect
to the attribute class.
Lin and Chen, 2012
CHI-SQUARE
The importance of each attribute in relation to the class (predicted class) is
measured by the chi-square statistical test.
Huang et al., 2008
WRAPPER
The selection of a subset of an attribute is performed by induction algorithm
and cross-validation.
Huang et al., 2008
database used to build the model, which has only 600 instances (observations).
The problem of class imbalance is relative and de-pends on the complexity and size of the database (Japko-wicz, 2003). In small unbalanced data sets, the minority class is represented by an exceedingly small number of examples, being less representative in the sample, which may not be suffi cient for the learning process (Batista et al., 2004).
Depending on the structure and size of the dataset, splitting criteria of nodes in decision trees are insensitive to the class distribution (Witten et al., 2011). In these cases, artifi cially balancing class distribution does not have much effect on the performance of the induced classifi ers.
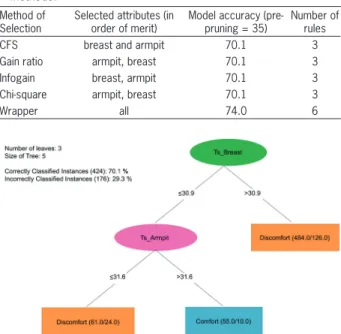
Although the number of variables analyzed in this study was small, some feature selection methods were evaluated, since they are able to improve the perfor-mance of models by eliminating inconsistent and redun-dant variables (Vale et al., 2008). Except for Wrapper, all feature selection methods used identifi ed breast and armpit TS as relevant variables (Table 5). Thus, classifi er performance was the same for all methods in terms of accuracy (70 %) and number of rules (3) (Figure 5).
Wrapper selected all the attributes of the original dataset as relevant and yielded the highest classifi cation accuracy (74 %), but in a tree composed of more rules (6). This result was expected, since all parts of the body chosen in this study are anatomically vascularized and have effi cient vasomotor mechanisms (Hogdson et al., 1994). Together they contribute effectively to thermal regulation of the animal, and, therefore, tend to have greater predictive power when combined.
Figure 4 – Classifi cation tree for thermal comfort of horses. The expression (x/y) in the leaf of a tree means that x instances reached that leaf, of which y are classifi ed incorrectly. (level of pre-pruning = 35 objects per leaf).
Table 4 – Number of instances, classifi er accuracy, and number of rules for decision trees built with different balancing methods.
Balancing Method
Number of instances Accuracy (%)
Number of Rules Total Class Model Class
D C D C
Raw data 600 405 195 74.0 75.9 66.4 6
Sampling (Bias)
0 540
353 187 65.0 72.7 43.8 7
0.5 308 232 73.3 79.1 58.8 9
1 256 284 73.3 80.5 57.9 10
NCL 412 236 176 70.0 75.6 53.3 6
SMOTE 716 364 352 71.6 83.3 54.2 9
382
Maia et al. Decision tree applied to horse thermal comfort
In the representation of decision trees built with raw data (Figure 4) and with attribute selection (Fig-ure 5), all feat(Fig-ure selection methods ranked armpit and breast TS as most relevant, and in the classifi cation using all attributes, both had the highest power rating. These results are consistent with those published in the litera-ture (Marlin et al., 1998; McCutcheon and Geor, 2008). The armpit is a highly vascularized area and has an enormous capacity for increasing blood fl ow (vasodi-lation) to meet the thermal needs of the animal (McCon-aghy et al., 1996). In addition, the breast participates in heat exchange, since it is highly correlated with changes in heart rate and breathing. In agreement with this study, Autio et al. (2006) studied differences in heat loss be-tween different breeds of horses at low temperatures and observed body heat dissipation by the groin and armpit during thermal stress. These fi ndings confi rm the partici-pation of these regions in thermoregulation. By contrast, Jodkpwska et al. (2011) determined maximum surface temperatures in different regions of the horse body at rest and after competition at an ambient temperature of 14 ºC, and observed a moderate impact of physical ef-fort on the increase in temperature in the breast region. The greatest increase in surface temperature following stressful conditions was found in the croup region (3.3 ºC). The authors considered that this region played the greatest role in releasing heat from the horse body gen-erated by effort during extreme exercise.
The divergence between our fi ndings and those obtained by Jodkpwska et al. (2011) may be explained by the fact that in our study data were collected only from horses at rest and not after competition. From these data, a model generated with raw data also considered the croup region to play an important role in thermo-regulation, but not the most important, while the model generated with feature selection methods considered breast and armpit TS as the most important variables for thermoregulation during rest.
The accuracy of both trees (Figures 4 and 5) is good and these trees are interesting to experts because their rules are simple and small, which could facilitate their practical use. The class precisions were very simi-lar (Table 6 and 7), which suggests that it may be advan-tageous to choose the model with fewer rules, even if it has lower accuracy. In this context, the tree generated with feature selection has rules that are more compact and more representative for experts.
Conclusion
The decision tree for classifying the thermal com-fort of horses from TS yielded an accuracy rate of 74 % and contained six relevant rules. The feature selec-tion methods highlighted armpit and breast TS, resulting in a tree with low precision, but with rules that were more compact and relevant according to expert opinion. The best classifi cation results were thus obtained from a model with fewer rules in detriment of accuracy. The decision tree classifi er proved to be a promising tool for generating new knowledge and identifying new variables related to the thermal comfort of horses, such as TS.
Acknowledgements
We wish to thank the São Paulo Research Foun-dation (FAPESP, Brazil) for awarding a PhD scholarship to Ana Paula Maia. The authors gratefully acknowledge FEAGRI/UNICAMP.
Table 5 – Results of the evaluation of different feature selection methods.
Method of Selection
Selected attributes (in order of merit)
Model accuracy (pre-pruning = 35)
Number of rules
CFS breast and armpit 70.1 3
Gain ratio armpit, breast 70.1 3
Infogain breast, armpit 70.1 3
Chi-square armpit, breast 70.1 3
Wrapper all 74.0 6
Table 6 – Confusion matrix for the decision tree shown in Figure 4, built with original data, representing the instances that were correctly classifi ed as true positive (TP) and true negative (TN).
Class Predictions Discomfort Comfort Model Ac-curacy
Discomfort 365 (TP) 40
74 %
Comfort 116 79 (TN)
Class Precision 75.9 % 66.4 %
Table 7 – Confusion matrix for the decision tree shown in Figure 5, built after feature selection, representing the instances that were correctly classifi ed as true positive (TP) and true negative (TN).
Class Predictions Discomfort Comfort Model Accuracy
Discomfort 372 (TP) 33
70.1 %
Comfort 143 52 (TN)
Class Precision 72.2 % 61.2 %
References
Autio, E.; Neste, R.; Airaksinen, S.; Heiskanen, M. 2006. Measuring the heat loss in horses in different seasons by infrared thermography. Journal of Applied Animal Welfare Science 9: 211-221.
Batista, G.H.A.P.A.; Prati, R.C.; Monard, M.C. 2004. A study of the behavior of several methods for balancing machine learning training data. SIGKDD Explorations 6: 20-29.
Castanheira, M.; Paiva, S.R.; Louvandini, H.; Landim, A.; Fiorvanti, M.C.S.; Paludo, G.R.; Dallago, B.S.; McManus, C. 2010. Multivariate analysis for characteristics of heat tolerance in horses in Brazil. Tropical Animal Health and Production 42: 185-191.
Chapman, P.; Clinton, J.; Kerber, R.; Khabaz, T.; Reinartz, T.; Shearer, C.; Wirth, R. 2000. CRISP-DM 1.0: Step-by-step data
mining guide. The CRISP-DM consortium. SPSS. Available
at: http://www.spss.ch/upload/1107356429_CrispDM1.0.pdf [Accessed Nov 21, 2011]
Chawla, N.V.; Bowyer, K.W.; Hall, L.O.; Kegelmeyer, W.P. 2002. SMOTE: Synthetic Minority Over-Sampling Technique. Journal of Artifi cial Intelligence Research 16: 321-357.
Crivelenti, R.C.; Coelho, R.M.; Adami, S.F.; Oliveira, S.R.M. 2009. Data mining to infer soil-landscape relationships in digital soil mapping. Pesquisa Agropecuária Brasileira 44: 1707-1715 (in Portuguese, with abstract in English).
Cunningham, J.G. 2002. Textbook of Veterinary Physiology. Saunders, Philadelphia, PA, USA.
Han, J.; Kamber, M.; Pei, J. 2011. Data Mining: Concepts and Techniques. Morgan Kaufmann, San Francisco, CA, USA. Huang, C-J.; Yang, D-X.; Chuang, Y-T. 2008. Application of
wrapper approach and composite classifi er to the stock trend prediction. Expert Systems with Applications 34: 2870-2878. Japkowicz, N. 2003. Class imbalances: are we focusing on the
right issue? Available at: http://www.site.uottawa.ca/~nat/ Papers/papers.html [Accessed Oct 16, 2012]
Jodkowska, E.; Dudek, K.; Przewozny, M. 2011. The maximum temperatures (Tmax) distribution on the body surface of sport horses. Journal of Life Sciences 5: 291-297.
Jones, S. 2009. Horseback riding in the dog days. Animal Science e-News University of Arkansas 2: 3-4. (The Cooperative Extension Divison, 7p.) Available at: http://www.aragriculture. org/news/animal_science_enews/2009/july2009.htm [Accessed Oct 16, 2012]
Kohn, C.W.; Hinchcliff, K.W. 1995. Physiological responses to the endurance test of a 3-day-event during hot and cool weather. Equine Veterinary Journal 20: 31-36.
Kohn, C.W.; Hinchcliff, K.W.; McKeever, K.H. 1999. Evaluation of washing with cold water to facilitate heat dissipation in horses exercised in hot, humid conditions. American Journal of Veterinary Research 60: 299-305.
Laurikkala, J. 2001. Improving identifi cation of diffi cult small classes by balancing class distribution. p. 63-66. In: Quaglini, S.; Barahona, P.; Andreassen, S., eds. Artificial intelligence in Medicine. Springer-Verlag, Berlin, Germany.
Lin, S.-W.; Chen, S.-C. 2012. Parameter determination and feature selection for C4.5 algorithm using scatter search approach. Software Computer 16: 63-75.
Lutu, P.E.N.; Engelbrecht, A.P. 2010. A decision rule-based method for feature selection in predictive data mining. Expert Systems with Applications 37: 602-609.
Marlin, D.J.; Scott, C.M.; Roberts, C.A.; Casas, I.; Holah, G.; Schroter, R. 1998. Post exercise changes in compartmental body temperature accompanying intermittent cold water cooling in the hyperthermic horse. Equine Veterinary Journal 30: 28-34. McConaghy, F.F.; Hodgson, D.R.; Rose, R.J.; Hales, J.R. 1996.
Redistribution of cardiac output in response to heat exposure in the pony. Equine Veterinary Journal Supplement 22: 42-46. McCutcheon, L.J.; Geor, R.J. 2008. Thermoregulation and
exercise-associated heat stress. p. 382-396. In: Hinchcliff, K.W.; Geor, R.J.; Kaneps, A.J., eds. Equine exercise physiology: the science of exercise in the athletic horse. Elsevier Health Sciences, Philadelphia, PA, USA.
McKeever, K.H.; Eaton, T.L.; Geiser, S.; Kearns, C.F.; Lehnhard, R.A. 2010. Age related decreases. I. Thermoregulation and cardiovascular function in horses. Equine Veterinary Journal 42: 449-454.
Quinlan, J.R. 1993. C4.5: Programs for Machine Learning. Morgan Kaufmann, San Francisco, CA, USA.
Sikora, M. 2011. Induction and pruning of classifi cation rules for prediction of microseismic hazards in coal mines. Expert Systems with Applications 38: 6748-6758.
Tattersall, G.J.; Cadena, V. 2010. Insights into animal temperature adaptations revealed through thermal imaging. The Imaging Science Journal 58: 261-268.
Tsang, S.; Kao, B.; Yip, K.Y.; Ho, W.; Lee, S.D. 2011. Decision tree for uncertain data. IEEE Transactions on Knowledge and Data Engineering 23: 64-78.
Vale, M.M.; Moura, D.J.; Nääs, I.A.; Oliveira, S.R.M.; Rodrigues, L.H.A. 2008. Data mining to estimate broiler mortality when exposed to heat wave. Scientia Agricola 65: 223-229.
Wang, T.; Qin, Z.; Jin, Z.; Zhang, S. 2010. Handling over-fi tting in test cost-sensitive decision tree learning by feature selection, smoothing and pruning. The Journal of Systems and Software 83: 1137-1147.