Species richness and community structure of arboreal spider
assemblages in fragments of three vegetational types at Banhado
Grande wet plain, Gravataí River, Rio Grande do Sul, Brazil
Alexandre B. Bonaldo1, Maria Aparecida L. Marques2, Ricardo Pinto-da-Rocha3 & Toby Gardner4
1. Coordenação de Zoologia, Museu Paraense Emílio Goeldi, Caixa Postal 399, 66040-170 Belém, Pará, Brazil. ([email protected])
2. Museu de Ciências Naturais, Fundação Zoobotânica do Rio Grande do Sul, Rua Dr. Salvador França, 1427, 90690-000 Porto Alegre, RS, Brazil. ([email protected])
3. Departamento de Zoologia, Instituto de Biociências, Universidade de São Paulo, Caixa Postal 11461, 05422-970 São Paulo, SP, Brazil. ([email protected])
4. School of Environmental Sciences, University of East Anglia, Norwich, NR4 7TJ, United Kingdom. ([email protected])
ABSTRACT. The taxonomic composition, observed and estimated species richness, and patterns of community structure of arboreal spider assemblages in eleven sites surrounding the “Banhado Grande” wet plain in the state of Rio Grande do Sul, Brazil, are presented. These sites represent three different vegetational types: hillside (four sites), riparian (five sites) and flooded forests (two sites). The spiders were captured by beating on foliage and “aerial litter”. A sample was defined as the result of beating on twenty bushes, tree branches or “aerial litter” clusters, which roughly corresponds to one-hour search effort per sample. Fifty five samples (five per site) were obtained, resulting in an observed richness of 212 species present as adult or identifiable juveniles. The total richness for all samples was estimated to be between 250 (Bootstrap) to 354 species (Jackknife 2). Confidence intervals of both sample and individual-based rarefaction curves for each vegetation type clearly indicated that flooded forest is the poorest vegetation type with respect to spider species richness, with hillside and riparian forests having a similar number of species. The percentage complementarity between the eleven sites indicated that all sites contain a distinct set of species, irrespective of their vegetation types. Nevertheless, the spider assemblages in riparian and hillside forests are more similar with respect to each other than when compared to flooded forest. Both cluster and nonmetric multidimensional scaling analyses showed no strong correspondence between the spider arboreal fauna and the three vegetation types. Moreover, a Mantel test revealed no significant association between species composition and geographic distance among sites.
KEYWORDS. Arboreal spiders, taxonomic composition, species richness, wet plain, southern Brazil.
RESUMO. Riqueza de espécies e estrutura da comunidade de assembléias de aranhas arbóreas em fragmentos de três tipos de vegetação na planície inundável do Banhado Grande, rio Gravataí, Rio Grande do Sul, Brasil. Apresenta-se a composição taxonômica e a riqueza de espécies, tanto observada quanto estimada, de aranhas arborícolas em onze fragmentos florestais nos arredores do Banhado Grande, Rio Gravataí, Rio Grande do Sul, Brasil. Estes fragmentos representam três tipos de vegetação: floresta de encosta (quatro áreas), floresta ripária (cinco áreas) e floresta paludosa (duas áreas). As aranhas foram capturadas em folhagem e “serapilheira suspensa” com auxílio de um guarda-chuva entomológico. Cada amostra foi definida como o resultado da coleta em vinte arbustos, galhos de árvores ou aglomerado de serapilheira suspensa, o que correspondeu a aproximadamente uma hora de coleta contínua por amostra. Cinqüenta e cinco amostras (cinco por área) foram obtidas, resultando em uma riqueza observada de 212 espécies representadas por adultos ou jovens identificáveis. A riqueza total para todas as amostras foi estimada entre 250 (Bootstrap) a 354 (Jackknife 2) espécies. Intervalos de confiança das curvas de rarefação baseadas tanto em amostras quanto em indivíduos para cada tipo de vegetação demonstraram claramente que a floresta paludosa é mais pobre em espécies do que as florestas ripária e de encosta, apontando que a riqueza de espécies de aranhas é similar nas florestas de encosta e ripária. A complementaridade percentual entre as onze áreas indica que todas as áreas apresentam composições taxonômicas consideravelmente diferentes, independentemente do tipo de vegetação em cada área. Entretanto, as assembléias de aranhas nas florestas de encosta e ripária são mais similares entre si do que quando comparadas com as da floresta paludosa. Análises de agrupamento e de escalonamento multidimensional não-métrico (NMDS) não mostraram forte correlação entre a fauna de aranhas arborícolas e os três tipos de vegetação. Uma análise de Mantel indicou que a associação entre composição de espécies e distância geográfica entre áreas não é significativa.
PALAVRAS-CHAVE. Aranhas arborícolas, composição taxonômica, riqueza de espécies, áreas úmidas, sul do Brasil.
The use of distribution data on megadiverse taxa in conservation decision making has been limited by the low availability of collections produced by structured inventories. Generally, the data generated by arthropod inventory projects are simple non-standardized species lists, which do not allow reliable comparisons of diversity among different areas or habitats. Support for standard effort sampling of invertebrates has been provided by CODDINGTON
et al. (1991), who proposed the practice of routinely recording sampling efforts through the use of standard protocols. They also stressed the importance of species richness, the simplest, and perhaps most meaningful
component of biological diversity for priority setting in conservation (MAGURRAN, 1988). Moreover, strong support
has been given for the inclusion of megadiverse taxa, such as Araneae, in the planning and execution of Rapid Assessment Programs (RAPs), claimed by FONSECA (2001)
as a fundamental tool for the task of documenting the remaining Brazilian biological diversity.
tributaries are covered by riparian forest and patches of a third vegetation type, the flooded forest, are found inside the wet plain. Due to the proximity of the metropolitan perimeter of Porto Alegre, the largest urban center in southern Brazil, the region as a whole has been depauperated. The deforestation of the Atlantic Forest for agriculture has left a mosaic landscape on the hillsides; cattle use riparian and flooded forests as shelter during the winter, and much of the original wet plain vegetation has been replaced by rice crops. This paper presents a first attempt to quantify the species richness and assemblage composition of arboreal spider assemblages for eleven forest fragments in the study area, characterizing differences among forest types for the sampled assemblage and testing the effect of distance between sampling sites on faunistic similarity. The data presented here provide a basis for the monitoring of arboreal spider species diversity patterns in the Banhado Grande wet plain.
MATERIAL AND METHODS
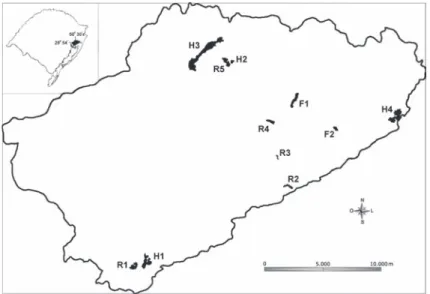
Samples were taken from 11 forested fragments, each one covering between 10 - 100 hectares of continuous forest, in Banhado Grande wet plain (Fig. 1). These sites, representing three vegetation types, hillside, riparian and flooded forest, are listed below with their abbreviations and sampling data. Hillside forests: H1, Médio Arroio Pesqueiro, Viamão (30o
09’ S, 50o
57’ W), V.30.2000; H2, São João, Glorinha (29o
51’ S, 50o
48’ W), VII.14.2000; H3, Morro do Tigre, Gravataí (29o 50’ S, 50o 52’ W), VII.15.2000; H4, Morro Grande, Santo Antonio da Patrulha (29o
55’ S, 50o
30’ W), VII.18.2000. Riparian forests: R1, Beco do Pesqueiro, Viamão (30o
09’ S, 50o
58’ W), V.31.2000; R2, Sanga da Rapadura, Santo Antonio da Patrulha (29o 55’ S, 50o 30’W), VI.01.2000; R3, Foz da Sanga da Porteira, Viamão (29o
59’ S, 50o
43’ W), VI.01.2000; R4, Arroio Três Figueiras, Viamão (29o
56’ S, 50o
45’ W), VII.13.2000; R5, São João, Glorinha (29o
52’ S, 50o
48’ W), VII.14.2000. Flooded forests: F1, Arroio Miraguaia, Santo Antonio da Patrulha (29o
54’ S, 50o
42’ W), VII.19.2000; F2,
Fazenda Paulo Lompra, Chico Lomã, Santo Antonio da Patrulha (29o 57’ S, 50o 37’ W), VI.02.2000.
The floristic composition of the forest fragments in Banhado Grande can be described as follows: the emergent trees in the hillside forests can reach 20 m tall, but larger trees such as Ficus organensis Miq. (Moraceae) reaching 25 m tall can also be found. The epiphytic flora is relatively scarce and composed by species of Piperaceae, Bromeliaceae and few Pteridophyta. The intermediate arboreal strata is dominated by Trichilia claussenii C. DC. (Meliaceae), Cupania vernalis Cambess. (Sapindaceae) and Nectandra megapotamica (Spreng.) Mez. (Lauraceae). The riparian forests are located on stream margins. The less exploited fragments still contain large emergent trees and an abundance of epiphytic plants. In the intermediary strata Zanthoxylum rhoifolium Lam. (Rutaceae), Allophylus edulis (A. St.-Hil., Cambess. & A. Juss.) Radlk. (Sapindaceae), Campomanesia xanthocarpa O. Berg (Myrtaceae) and Trichilia claussenii can be found. Common small trees are Trichilia elegans A. Juss. (Meliaceae), Casearia sylvestris SW. (Flacourtiaceae) and Vitex megapotamica (Spreng.) Moldenke (Verbenaceae). Species of Myrtaceae are also abundant in these strata. The flooded forest fragments contain few large emergent trees and their intermediate arboreal stratum is composed mainly of Myrtaceae, such as Eugenia spp., Gomidesia spp., Myrcia glabra, Campomanesia xanthocarpa and Myrcianthes spp.The epiphytic flora is abundant, and dominated by the Bromeliaceae, represented by at least five species of Vriesea and Tillandsia (Maria de Lourdes Abruzzi A. de Oliveira, pers. comm.).
In this study, only a fraction of the total spider fauna of Banhado Grande was sampled, defined as the understory fauna to be found between 0.5 to 2.5 m high. Our sampling method was restricted to diurnal species which are active during the sampling period or nocturnal ones that could be found hidden in the foliage. All samples were obtained by the senior author, with a 0.8 m2 beating tray. Each sampling period lasted nearly one hour, covered no more than 5 ha
Table I. Composition of the arboreal spider assemblages sampled in eleven sites, between May 2000 and July 2000, in the surroundings of Banhado Grande wet plain, State of Rio Grande do Sul, Brazil.
Family total unidentifiable identifiable adults identifiable % of all % of recognizable % of specimens juveniles juveniles specimens specimens identifiable species recognizable
specimens species
Theridiidae 1,735 301 310 1,124 1,434 25.63 82.65 6 4 30.19
Anyphaenidae 1,095 1,034 1 8 4 3 6 1 16.18 5.57 1 0 4.72
Araneidae 980 851 1 0 119 129 14.48 13.16 2 4 11.32
Salticidae 955 822 0 133 133 14.11 13.93 3 2 15.09
Thomisidae 912 794 2 116 118 13.47 12.94 1 9 8.96
Tetragnathidae 162 151 0 1 1 1 1 2.39 6.79 6 2.84
Linyphiidae 142 4 0 0 102 102 2.10 71.83 1 7 8.02
Pisauridae 106 106 0 0 0 1.57 0 0 0
Mimetidae 102 6 4 0 3 8 3 8 1.51 37.25 4 1.89
Uloboridae 9 0 8 1 0 9 9 1.33 1 0 4 1.89
Pholcidae 8 4 5 3 0 3 1 3 1 1.24 36.9 3 1.42
Corinnidae 7 5 4 9 3 2 3 2 6 1.11 34.67 6 2.83
Deinopidae 6 5 6 2 0 3 3 0.96 4.62 2 0.94
Clubionidae 6 1 0 6 1 0 6 1 0.90 100 1 0.47
Sparassidae 3 2 2 3 6 3 9 0.47 28.13 1 0.47
Senoculidae 3 1 3 1 0 0 0 0.46 0 0 0
Gnaphosidae 3 0 2 0 0 1 0 1 0 0.44 33.33 2 0.94
Theridiosomatidae 2 1 2 0 0 1 1 0.31 4.76 1 0.47
Selenopidae 1 7 1 4 0 3 3 0.25 17.65 2 0.94
Oxyopidae 1 5 1 5 0 0 0 0.22 0 0 0
Dictynidae 1 4 6 0 8 8 0.22 57.14 3 1.42
Oonopidae 1 1 0 0 1 1 1 1 0.16 100 6 2.83
Philodromidae 1 0 1 0 0 0 0 0.15 0 0 0
Amaurobiidae 8 8 0 0 0 0.12 0 0 0
Scytodidae 8 4 0 4 4 0.12 5 0 1 0.47
Miturgidae 2 0 2 0 2 0.03 100 1 0.47
Segestriidae 2 0 0 2 2 0.03 100 1 0.47
Caponiidae 1 0 0 1 1 0.01 100 1 0.47
Filistatidae 1 1 0 0 0 0.01 0 0 0
Hahniidae 1 0 0 1 1 0.01 100 1 0.47
Sicariidae 1 1 0 0 0 0.01 0 0 0
All families 6769 4561 412 1796 2208 100 32.62 212 100
and represents the spiders captured in 20 bushes, tree branches or “aerial litter” clusters. “Aerial litter” is defined as clumps of falling dry leaves which do not reach the ground, remaining suspended by plant structures. Re-sampling of the same bush, tree branch or “aerial litter” cluster was avoided. During the collecting, no prior assumptions on spider maturity were made. Five samples were obtained from each site, totaling fifty-five samples, twenty from hillside forests, twenty five from riparian forests and ten from flooded forests. Unidentifiable juveniles were sorted by family and discarded. The unidentified species were recorded as morphospecies. Juveniles of the following species were considered as reliably identifiable and were included in the analyses: Alpaida ericae Levi, 1988, A. truncata (Keyserling, 1865); Taczanowskia striata Keyserling, 1879 (Araneidae); Anyphaenoides clavipes (Mello-Leitão, 1922) (Anyphaenidae); Corinna sp. 1 (Corinnidae); Elaver brevipes (Keyserling, 1891) (Clubionidae); Cheiracanthium inclusum (Hentz, 1847) (Miturgidae); Polybetes rubrosignatus Mello-Leitão, 1943 (Sparassidae); Achaearanea altiventer (Keyserling, 1884), A. bellula (Keyserling, 1891), A. hirta (Taczanowski, 1873), A. passiva (Keyserling, 1891), A. triguttata (Keyserling, 1891), Chrysso nigrosterna Keyserling, 1891, Chrosiothes perfidus Marques & Buckup, 1997, Emertonella taczanowskii
(Keyserling, 1886), T. plaumanni Levi, 1963, T. positivum Chamberlin, 1924, T. striatum Keyserling, 1884, Thwaitesia affinis O. P.-Cambridge, 1882, Wamba crispulus (Simon, 1895) (Theridiidae) and Sidymella kolpogaster (Lise, 1973) (Thomisidae). This procedure improves the reliability of abundance data, particularly in Theridiidae (see Tab. I). In addition, nine of the species were identified only from juveniles (Alpaida ericae, A. truncata, Taczanowskia striata, Anyphaenoides clavipes, Cheiracanthium inclusum, Corinna sp. 1, Elaver brevipes, Chrosiothes perfidus and Theridion striatum), thereby improving the accuracy of the observed species richness values. The vouchers are deposited in the arachnological collection of Museu de Ciências Naturais, Fundação Zoobotânica do Rio Grande do Sul (MCN), Porto Alegre, Brazil.
The data were analyzed with EstimateS Version 7.5 (COLWELL, 2005) and EcoSim v. 7 (GOTELLI & ENTSMINGER,
100 times for richness estimators calculations. The following estimators were used: Chao 1, Chao 2, first order Jackknife, second order Jackknife, ACE, ICE and Bootstrap. For a detailed explanation of each of these estimators see COLWELL
& CODDINGTON (1994) and SANTOS (2003). Differences on
species richness in each vegetation type were visualized through the inspection of the 95% confidence intervals of both sample and individual-based rarefaction curves. Sample-based rarefaction has the advantage of accounting for natural levels of heterogeneity (patchiness) in the data (GOTELLI & COLWELL, 2001). However, the x-axis of both
figures is scaled to represent the number of individuals (not number of samples), as standardization by number of individuals is necessary to evaluate patterns of richness at comparable levels of sampling effort when data sets are likely to differ systematically in the mean number of individuals per sample (GOTELLI & COLWELL, 2001).
Sample-based rarefaction curves were calculated using EstimateS 7.5, while individual-based curves were calculated using EcoSim 7. The sample intensity (CODDINGTONet al., 1996) was calculated for each vegetation type. In the present case, sampling intensity is the ratio of identifiable individuals (adults plus identifiable juveniles) to species. To compare taxonomic lists obtained in each site and in the three vegetation types sampled, percentage complementarity (as described by SILVA, 1996) and Morisita-Horn similarity index
were calculated, also using EstimateS (see also MAGURRAN,
1988). The cluster analysis of the eleven sampling sites, using the UPGMA clustering method and Morisita similarity index, was performed in MVSP 3.1(KOVACH, 1999). To better
observe the patterns of community structure among the eleven sites a non-metric multidimensional scaling (NMDS) ordination was also performed using the Bray-Curtis similarity index. NMDS is preferable to other ordination methods (PCA, CA, DCA) because it does not make any assumptions about the pattern of species abundance distributions (MCCUNE & GRACE, 2002). Analyses were
conducted using both quantitative (abundance) and qualitative (presence-absence) data for comparison. For the analysis of the abundance data the matrix was first standardized (to remove the effects of overall differences in abundance between sites) and the individual values square-root transformed (to reduce the influence of the most abundant species). An Analysis of Similarities (ANOSIM, CLARKE & WARWICK, 2001) was conducted to test for
significant differences in community structure among vegetation types. Only the 39 more abundant species (those with more than 10 individuals) were included in all community analyses. Rare species were not used because they may be poor representatives of the overall community and their occurrence may be strongly influenced by sampling effort. To analyze the relationship between similarity (Bray-Curtis index) and geographic distance between neighboring sites, we used a Mantel Test (FORTIN & GUREVITCH, 1993) based on
1000 permutations, performed with XLSTAT (ADDINSOFT,
2005).
RESULTS AND DISCUSSION
Assemblage composition. From a total of 6,769 spiders collected, 4,561 (67.4%) were unidentified juveniles and 2,208 (32.6%) were adults (1,796; 26.5%) or identifiable juveniles (412, 6.1%). Representatives of 31 spider families were
sampled (Tab. I). The most abundant families were Theridiidae, which contributed with 25.63% of all captures, and Anyphaenidae, with 16.17%. Theridiidae was also the family with the largest number of identifiable specimens (1,434 of 1,735) and recognized species (64), far more than any other spider family. In contrast, from 1,095 anyphaenids collected, only 61 were identifiable and this family contributed with only ten of the 212 species in the analysis. The second dominant group of families comprised the orb weavers Araneidae (980 individuals, 129 identifiable individuals, 24 species), the active hunters Salticidae (955, 133, 32) and the ambushers Thomisidae (912, 118, 19). All other families were represented by less than 200 individuals each, and contributed with only 64 out of 212 species. Four families were represented only by singletons and seven were represented only by unidentified juveniles (Tab. I).
Considering only identifiable specimens (Tab. II), from the remaining 24 families, three (Caponiidae, Hahniidae and Theridiosomatidae) were represented by singletons. The occurrence of these specimens in foliage or even in “aerial litter” may be occasional, as representatives of these families are generally found in soil litter (HÖFER & BRESCOVIT, 2001).
Our results confirm the pattern of few abundant and many rare species which is expected for spider assemblages (TOTI
et al., 2000; SØRENSENet al., 2002). From 212 species recorded in all fragments, 83 were singletons (39% of all species) and 28 were doubletons (13%). Only 22 species (16 Theridiidae, two Araneidae, one Mimetidae, one Thomisidae, one Clubionidae and one Linyphiidae) were represented by more than 20 specimens. These 22 species were responsible for 65.8% of the identifiable specimens. The most abundant species was Dipoena atlantica Chickering, 1943 (Theridiidae) (252 individuals), but the vast majority of these catches were from a single flooded site (F2), where the Bromeliaceae Tillandsia usneoides (L.) L. was especially abundant. Nearly all specimens of D. atlantica caught at F2 were from the dense suspended clusters of this plant. Two other more uniformly distributed Theridiidae species, occurring across all sites, were also very abundant: Achaearanea passiva (115 individuals) and Wamba crispulus (105 individuals). Overall abundance was similar in flooded and riparian forests (817 and 845 individuals, respectively), despite the fact that a much less intense sampling effort was conducted in the former. This suggests that the density of spiders is much higher in the flooded forest. Hillside forest produced only 546 individuals, although the sample effort in this vegetation type was twice as intense as in flooded forest. These differences are reflected in sample intensity ratios, higher in flooded (10.9) than in riparian (6.5) or hillside (4.5) forests.
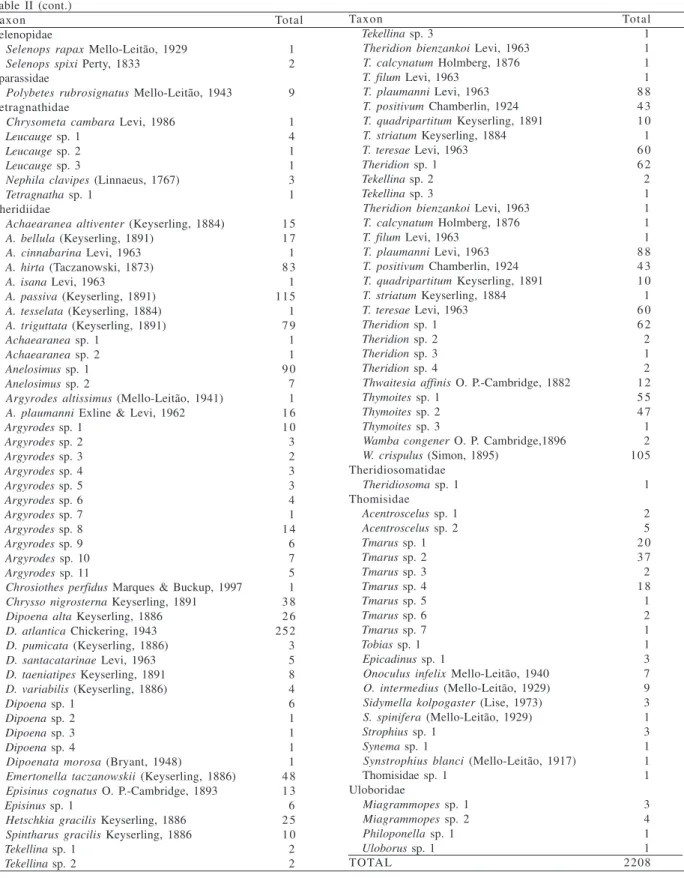
Table II. Species collected in eleven sites in the surroundings of Banhado Grande wet plain, State of Rio Grande do Sul, Brazil, between May 2000 and July 2000.
Taxon Total
Anyphaenidae
Anyphaenoides clavipes (Mello-Leitão, 1922) 1 8 Aysha helvola (Keyserling,1891) 3
Aysha sp. 1 2
Sanogasta sp. 1 7
Katissa sp. 1 2
Otoniela sp. 1 1
Patrera sp. 1 3
Sillus sp. 1 1 0
Anyphaenidae sp. 1 1 4
Anyphaenidae sp. 2 1
Araneidae
Alpaida canoa Levi, 1988 2 5 A. ericae Levi, 1988 5 A. scriba (Mello-Leitão, 1940) 9 A. truncata (Keyserling, 1865) 5 Araneus unanimus (Keyserling, 1879) 2 A. venatrix (C. L. Koch, 1879) 1 Cyclosa camargoi Levi, 1999 1 C. inca Levi, 1999 1
Eustala sp. 1 1
Eustala sp. 2 1
Eustala sp. 3 1
Eustala sp. 4 1
Eustala sp. 5 3 9
Eustala sp. 6 7
Eustala sp. 7 8
Mangora sp. 1 2
Mangora sp. 2 2
Metazygia genialis (Keyserling, 1892) 1 M. rogenhoferi (Keyserling, 1878) 9 Micrathena nigrichelis Strand, 1908 2 Pozonia bacillifera (Simon, 1897) 1 Taczanowskia striata Keyserling, 1879 2 Tatepeira itu Levi, 1995 1 Testudinaria bonaldoi Levi, 2005 2 Caponiidae
Nops sp. 1 1
Clubionidae
Elaver brevipes (Keyserling, 1891) 6 1 Corinnidae
Corinna nitens (Keyserling, 1891) 1
Corinna sp. 1 3
Paradiestus vitiosus (Keyserling, 1891) 1
Orthobula sp. 1 1
Trachelas sp. 1 9
Trachelopachys gracilis (Keyserling, 1891) 1 1 Deinopidae
Deinops sp. 1 2
Deinops sp. 2 1
Dictynidae
Dictyna sp. 1 1
Dictyna sp. 2 3
Dictyna sp. 3 4
Gnaphosidae
Apodrassodes taim Brescovit & Lise, 1993 9
Camillina sp. 1 1
Hahniidae
Hahniidae sp. 1 1
Linyphiidae
Anodoration claviferum Millidge, 1991 2
Dubiaranea sp. 1 2
Dubiaranea sp. 2 1
Meioneta sp. 1 1
Scolecura sp. 1 1
Sphecozone rostrata Millidge, 1991 4 9
Taxon Total
Sphecozone sp. 1 8
Sphecozone sp. 2 4
Sphecozone sp. 3 1
Tutaibo sp. 1 5
Tutaibo sp. 2 1 0
Linyphiidae sp. 1 1
Linyphiidae sp. 2 1
Linyphiidae sp. 3 2
Linyphiidae sp. 4 2
Linyphiidae sp. 5 4
Linyphiidae sp. 6 8
Mimetidae
Ero sp. 1 2 6
Ero sp. 2 4
Ero sp. 3 1
Mimetus hieroglyphicus Mello-Leitão, 1929 7 Miturgidae
Cheiracanthium inclusum (Hentz, 1847) 2 Oonopiidae
Orchestina sp. 1 1
Orchestina sp. 2 3
Oonopiidae sp. 1 3
Oonopiidae sp. 2 1
Oonopiidae sp. 3 2
Oonopiidae sp. 4 1
Pholcidae
Mesabolivar luteus (Keyserling, 1891) 1 5
Metagonia sp. 1 1 5
Pholcidae sp. 1 1
Salticidae
Asaphobelis physonychus Simon, 1902 5
Ashtabula sp. 1 1
Beata aenea (Mello-Leitão, 1945) 1
Beata sp. 1 3
Beata sp. 2 1
Beata sp. 3 2
Bellota sp. 1 1
Bellota sp. 2 1
Breda apicalis Simon, 1901 1 Chira thysbe Simon, 1902 9
Chira sp. 1 1
Coryphasia albibarbis Simon, 1902 1 6
Cotinusa sp. 1 1 9
Cotinusa sp. 2 1 5
Cotinusa sp. 3 4
Cotinusa sp. 4 1
Cotinusa sp. 5 1
Cylistella cuprea (Simon,1864) 1 7
Cylistella sp. 1 3
Lyssomanes sp. 1 1
Pensacola sp. 1 3
Sarinda sp. 1 1
Tulpius gauchus Bauab-Vianna & Soares, 1983 1
Salticidae sp. 1 1
Salticidae sp. 2 2
Salticidae sp. 3 1
Salticidae sp. 4 1 0
Salticidae sp. 5 1
Salticidae sp. 6 1
Salticidae sp. 7 7
Salticidae sp. 8 1
Salticidae sp. 9 1
Scytodidae
Scytodes globula Nicolet, 1849 4 Segestriidae
Table II (cont.)
Taxon Total
Selenopidae
Selenops rapax Mello-Leitão, 1929 1 Selenops spixi Perty, 1833 2 Sparassidae
Polybetes rubrosignatus Mello-Leitão, 1943 9 Tetragnathidae
Chrysometa cambara Levi, 1986 1
Leucauge sp. 1 4
Leucauge sp. 2 1
Leucauge sp. 3 1
Nephila clavipes (Linnaeus, 1767) 3
Tetragnatha sp. 1 1
Theridiidae
Achaearanea altiventer (Keyserling, 1884) 1 5 A. bellula (Keyserling, 1891) 1 7 A. cinnabarina Levi, 1963 1 A. hirta (Taczanowski, 1873) 8 3 A. isana Levi, 1963 1 A. passiva (Keyserling, 1891) 115 A. tesselata (Keyserling, 1884) 1 A. triguttata (Keyserling, 1891) 7 9
Achaearanea sp. 1 1
Achaearanea sp. 2 1
Anelosimus sp. 1 9 0
Anelosimus sp. 2 7
Argyrodes altissimus (Mello-Leitão, 1941) 1 A. plaumanni Exline & Levi, 1962 1 6
Argyrodes sp. 1 1 0
Argyrodes sp. 2 3
Argyrodes sp. 3 2
Argyrodes sp. 4 3
Argyrodes sp. 5 3
Argyrodes sp. 6 4
Argyrodes sp. 7 1
Argyrodes sp. 8 1 4
Argyrodes sp. 9 6
Argyrodes sp. 10 7
Argyrodes sp. 11 5
Chrosiothes perfidus Marques & Buckup, 1997 1 Chrysso nigrosterna Keyserling, 1891 3 8 Dipoena alta Keyserling, 1886 2 6 D. atlantica Chickering, 1943 252 D. pumicata (Keyserling, 1886) 3 D. santacatarinae Levi, 1963 5 D. taeniatipes Keyserling, 1891 8 D. variabilis (Keyserling, 1886) 4
Dipoena sp. 1 6
Dipoena sp. 2 1
Dipoena sp. 3 1
Dipoena sp. 4 1
Dipoenata morosa (Bryant, 1948) 1 Emertonella taczanowskii (Keyserling, 1886) 4 8 Episinus cognatus O. P.-Cambridge, 1893 1 3
Episinus sp. 1 6
Hetschkia gracilis Keyserling, 1886 2 5 Spintharus gracilis Keyserling, 1886 1 0
Tekellina sp. 1 2
Tekellina sp. 2 2
Taxon Total
Tekellina sp. 3 1
Theridion bienzankoi Levi, 1963 1 T. calcynatum Holmberg, 1876 1 T. filum Levi, 1963 1 T. plaumanni Levi, 1963 8 8 T. positivum Chamberlin, 1924 4 3 T. quadripartitum Keyserling, 1891 1 0 T. striatum Keyserling, 1884 1 T. teresae Levi, 1963 6 0
Theridion sp. 1 6 2
Tekellina sp. 2 2
Tekellina sp. 3 1
Theridion bienzankoi Levi, 1963 1 T. calcynatum Holmberg, 1876 1 T. filum Levi, 1963 1 T. plaumanni Levi, 1963 8 8 T. positivum Chamberlin, 1924 4 3 T. quadripartitum Keyserling, 1891 1 0 T. striatum Keyserling, 1884 1 T. teresae Levi, 1963 6 0
Theridion sp. 1 6 2
Theridion sp. 2 2
Theridion sp. 3 1
Theridion sp. 4 2
Thwaitesia affinis O. P.-Cambridge, 1882 1 2
Thymoites sp. 1 5 5
Thymoites sp. 2 4 7
Thymoites sp. 3 1
Wamba congener O. P. Cambridge,1896 2 W. crispulus (Simon, 1895) 105 Theridiosomatidae
Theridiosoma sp. 1 1 Thomisidae
Acentroscelus sp. 1 2 Acentroscelus sp. 2 5
Tmarus sp. 1 2 0
Tmarus sp. 2 3 7
Tmarus sp. 3 2
Tmarus sp. 4 1 8
Tmarus sp. 5 1
Tmarus sp. 6 2
Tmarus sp. 7 1
Tobias sp. 1 1
Epicadinus sp. 1 3
Onoculus infelix Mello-Leitão, 1940 7 O. intermedius (Mello-Leitão, 1929) 9 Sidymella kolpogaster (Lise, 1973) 3 S. spinifera (Mello-Leitão, 1929) 1
Strophius sp. 1 3
Synema sp. 1 1
Synstrophius blanci (Mello-Leitão, 1917) 1
Thomisidae sp. 1 1
Uloboridae
Miagrammopes sp. 1 3 Miagrammopes sp. 2 4 Philoponella sp. 1 1
Uloborus sp. 1 1
TOTAL 2208
Comparing the three observed sampling accumulation curves at the 10th
added sample, the flooded, riparian and hillside forests accumulated 75, 86 and 87 species respectively. At the twentieth added sample, the observed curves for riparian forest accumulated 118 species, while the curve for hillside forest accumulated 120 species. These comparisons are based on the accumulation of standardized sampling units and, according to GOTELLI & COLWELL (2001), are more
the point which permits the comparison of the three vegetation types (546o individual), flooded forest accumulated only 63 species, while hillside and riparian forests accumulated 120 and 109 species, respectively. The individual-based curves showed very similar results at the 516o individual added: flooded forest with 63 species, hillside forest with 118 and riparian forest with 108. For both sets of curves the differences between flooded forest and the other vegetation types are significant given the calculated confidence intervals (α=0.05), but there was no significant
difference in the number of species found in hillside and riparian forests.
Complementarity and similarity. The complementarity between pairs of sites is generally high, demonstrating that the taxonomic composition of arboreal spider assemblages differs greatly among sites (Tab. III). The most complementary assemblages are those from hillside site H3 and flooded site F1 whilst the least complementary ones are those from two riparian sites, R3 and R4. The differences were less striking when taxonomic lists were organized according to vegetation types. The highest complementarity was between hillside and flooded forests, with the lowest complementarity being between hillside and riparian forests. These results can be strongly influenced by the incidence of singletons. Removing the 83 species that were only represented as singletons from the matrix resulted in lower complementarity values among vegetation types, but did not change the rank order, indicating that singletons were
evenly distributed among hillside, riparian and flooded forests. The Morisita-Horn similarity index for pairs of sites and for the vegetation types are also given (Tab. III). In contrast to the complementarity results, these indices indicated that a flooded (F1) and a riparian (R3) are the most similar sites in terms of species composition, whilst interestingly, two other flooded and riparian sites (F2 and R5) are the least similar ones. However, when comparing between vegetation types the same pattern is produced using either the similarity index or percentage complementarity, indicating that flooded and hillside forests are the least similar whilst the most similar are hillside and riparian. This also indicates that the comparisons of community structure are likely to be more robust between vegetation types than among sites owing to a higher degree of sample representation in the former. As the Morisita-Horn index is strongly influenced by information from abundant species, the similarity results were not markedly affected by the removal of singletons, as occurred with the complementarity results.
The cluster analysis for all sampled sites based on Morisita similarity indexes of all species sampled was strongly biased by the anomalously high abundance of a single species (the theridiid Dipoena atlantica) in one flooded forest site and its incidence in only two sites (H4 - 1 individual; F2 - 251 individuals). In this dendrogram (Fig. 4, upper panel), the flooded site where D. atlantica was extremely abundant (F2) appears as an isolated group. All
Fig. 3. Individual-based rarefaction curves for riparian, hillside and flooded forests, in the surroundings of Banhado Grande wet plain, State of Rio Grande do Sul, Brazil, with their respective 95 % confidence interval lower and upper bounds. Solid lines, riparian forest; small-dotted lines, hillside forest; large-dotted lines, flooded forest.
Fig. 4. Cluster analyses based on Morisita similarity index of the eleven sites in the surroundings of Banhado Grande wet plain, State of Rio Grande do Sul, Brazil, regarding arboreal spider species, using UPGMA clustering method. Upper panel: results on the full data matrix. lower panel: results obtained excluding data on Dipoena atlantica (Theridiidae). Solid lines, riparian forest; small dotted lines, hillside forest; large dotted lines, flooded Forest.
other sites were grouped together, and organized into two main subgroups, one composed by three hillside and one riparian site and another composed by a single hillside and the remaining flooded and riparian sites. Excluding D. atlantica from the data matrix placed F2 into the main flooded-riparian subgroup (Fig. 4, lower panel). In both dendrograms, a riparian site (R5) appears in the main hillside
subgroup and a hillside site (H1) is more similar to the flooded-riparian subgroup than to the others hillside sites. On the other hand, in the second dendrogram (excluding D. atlantica), both flooded sites are more related to riparian sites than to each other. These inconsistencies could be partially explained by geographic proximity between related sites, as H1 and R1 are separated by less than one kilometer
Table III. Percent complementarity (upper right half) and Morisita-Horn similarity index (bottom left half) for eleven sites in the surroundings of Banhado Grande wet plain, State of Rio Grande do Sul, Brazil (212 spider species). Highest and lowest values are underlined. These indexes are also given for the three vegetation types, for all 212 species (below, left) and for 129 species represented in the samples by two or more individuals (below, right).
Hillside Riparian Flooded
H1 H2 H3 H4 R1 R2 R3 R4 R5 F1 F2
H1 # 76% 81% 83,5% 73% 83% 76% 72% 82% 81% 77%
H2 0.28 # 76% 80% 76% 79% 81% 74% 72% 85% 83%
H3 0.13 0.28 # 77% 77% 86% 88% 82% 76% 89% 82%
H4 0.26 0.45 0.32 # 82% 84% 83% 76% 79% 83% 80%
R1 0.47 0.33 0.38 0.36 # 78% 77% 71% 73% 82% 82%
R2 0.33 0.19 0.06 0.32 0.43 # 66% 71% 80% 76% 72%
R3 0.42 0.37 0.16 0.44 0.59 0.67 # 63% 82% 66% 67%
R4 0.47 0.43 0.24 0.52 0.5 0.49 0.71 # 79% 70% 65%
R5 0.29 0.55 0.42 0.37 0.23 0.07 0.1 0.17 # 85% 86%
F1 0.28 0.3 0.16 0.38 0.44 0.45 0.74 0.58 0.1 # 71%
F2 0.07 0.05 0.03 0.11 0.11 0.2 0.16 0.15 0.02 0.18 #
All species Hillside Riparian Flooded No singletons Hillside Riparian Flooded
Hillside # 68% 77% Hillside # 51% 68%
Riparian 0.73 # 71% Riparian 0.74 # 58%
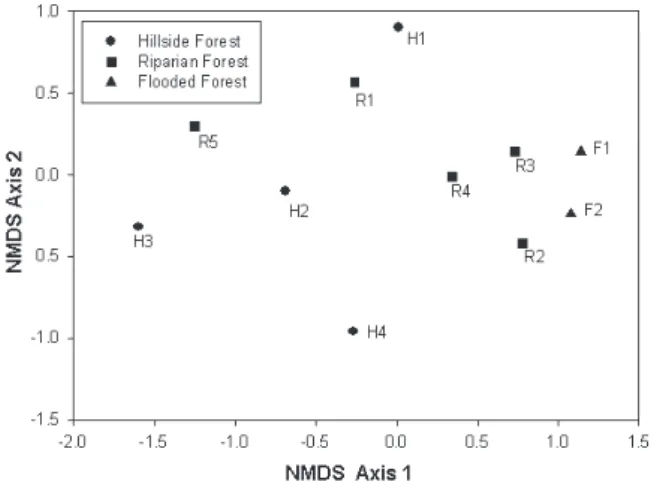
Fig. 5. Non-metric multidimensional scaling (NMDS) plot based on a Bray-Curtis abundance matrix, showing patterns of community structure among all eleven sites of three vegetation types for the arboreal spider assemblage in the Banhado Grande area, State of Rio Grande do Sul, Brazil, May 2000 to July 2000.
Recebido em abril de 2005. Aceito em outubro de 2006. ISSN 0073-4721 Artigo disponível em: www.scielo.br/isz
and H2 and R5 are even closer (Fig. 1). The distribution of sites, as showed by the non-metric multidimensional scaling (NMDS) ordination, revealed no strong association between site location and vegetation type regarding patterns of community structure (Fig. 5), a conclusion also supported by the result of the ANOSIM test (R = 0.18, p = 0.14). However, whilst there was no clear distinction in the location of hillside and riparian sites on the NMDS ordination, flooded forest sites were more similar to each other than either was to any site from another vegetation type. Similar results were obtained when using either abundance or incidence data indicating that the observed patterns are strongly influenced by differences in species composition. In order to test the hypothesis that the geographical proximity between sites would overwhelm the influence of habitat preferences on the distribution of spider species a Mantel test was performed. This test showed a non-significant relationship (r: -0.3804; P=0.982), indicating that geographical distance is not important in determining patterns of community structure.
The present dataset indicates that differences in vegetation types do not explain much of the variability in spider assemblages between sites. Further research should be conducted to determine which factors (vegetation structure, abiotic characteristics of environments, forest fragment size, degree of connectivity or isolation between sites) can influence spider species richness, community structure and species composition in Banhado Grande wet plain area. From a conservation perspective, the results presented here suggest that riparian forest fragments can be as important as the hillside forest fragments regarding maintenance of spider diversity, despite the fact that these forests are severely altered by cattle farming. Both kinds of fragments deserve strong conservation measures to be successfully preserved. On the other hand, the preservation of the remaining flooded forest patches in Banhado Grande wet plain is highly desirable as its spider assemblages appears to be complementary to hillside and riparian ones.
Acknowledgments. To Dr. Maria de Lourdes Abruzzi A. de Oliveira (MCN), for the information on plant composition of the study area. Also, we thanks two anonymous referees for valuable comments. Support in the field was provided by Fundação Zoobotânica do Rio Grande do Sul (FZB-RS). This paper was also financially supported by CNPq (ABB grant #303591/2006-3 / RPR grant #476523/2003-6).
REFERENCES
ADDINSOFT. 2005. XLSTAT-Pro Your data analysis solution. Software. Avaliable at: <http://www.xlstat.com>. Access on: 04.2005.
CLARKE, K. R. & WARWICK, R. M. 2001. Change in marine communities: an approach to statistical analysis and interpretation. Plymouth, Primer-E. 172p.
CODDINGTON, J. A.; YOUNG, L. H. & COYLE, F. A. 1996. Estimating spider species richness in a Southern Appalachian cove hardwood forest. The Journal of Arachnology 24:111-128. CODDINGTON, J. A.; GRISWOLD, C.; SILVA, D. D.; PEÑARANDA, E. &
LARCHER, S. F. 1991. Designing and testing sampling protocols to estimate biodiversity in tropical ecossistems. In: DUDLEY, E. C. ed. The unity of evolutionary biology: proceedings of the fourth international congress of sistematics and evolutionary biology. Portland, Dioscorides. v. 1, p.44-60. COLWELL, R. K. 2005. EstimateS: Statistical estimation of species richness and shared species from samples. Version 7.5. User’s Guide and application. Available at: <http://purl.oclc.org/estimates>. Access on: 04.2005. COLWELL, R. K. & CODDINGTON, J. A. 1994. Estimating terrestrial
biodiversity through extrapolation. Philosophical Transactions of the Royal Society (Series B) 345:101-118. FONSECA, G. A. B. 2001. Proposta para um programa de avaliação
rápida em âmbito nacional. In: GARAY, I. & DIAS, B. Conservação da biodiversidade em ecossistemas tropicais: avanços conceituais e novas metodologias de avaliação e monitoramento. Petrópolis, Vozes. v.1, p.150-156. FORTIN, M. J. & GUREVITCH, J. 1993. Mantel tests: spatial structure
in field experiments. In: SCHEINER, S. M. & GUREVITCH, J. eds. Design and analysis of ecological experiments. Boca Raton, Chapman & Hall. p.342-359.
GOTELLI, N. J. & COLWELL, R. K. 2001. Quantifying biodiversity: procedures and pitfalls in the measurement and comparison of species richness. Ecology Letters 4:379-391.
GOTELLI, N. J. & ENTSMINGER, G. L. 2001. EcoSim: Null models software for ecology. Version 7.0. Acquired Intelligence Inc. & Kesey-Bear. Available at: <http://homepages.together.net/ ~gentsmin/ecosim.htm>. Access on: 04.2005.
HÖFER, H. & BRESCOVIT, A. D. 2001. Species and guild structure of a Neotropical spider assemblage (Araneae) From Reserva Ducke, Amazonas, Brazil. Andrias 15:99-120.
KOVACH, W. L. 1999. MVSP - A Multivariate Statistical Package for Windows, ver. 3.1. Pentraeth, Kovach Computing Services. 133p.
MAGURRAN, A. E. 1988. Ecological diversity and its measurement. Princeton, Princeton University. 179p. MCCUNE, B & GRACE, J. B. 2002. Analysis of Ecological
Communities. Gleneden Beach, MJM Software Designs. SANTOS, A. J. 2003. Estimativas de riqueza em espécies. In:
CULLEN, L., JR.; RUDRAN, R. & VOLLADARES-PADUA, C. orgs. Métodos de estudos em biologia da conservação & manejo da vida silvestre. Curitiba, UFPR. p.19-41. SILVA, D. 1996. Species composition and community structure
of Peruvian Rainforest spiders: a case study from a seazonally innunded forest along the Samiria River. Revue Suisse de Zoologie, vol. hors ser., 597-610.
SØRENSEN, L. L.; CODDINGTON, J. A. & SCHARFF, N. 2002. Inventorying and estimating subcanopy spider diversity using semiquantitative sampling methods in an afromontane forest. Environmental Entomology 31(2):319-330.