14ª Conferência da Associação Portuguesa de Sistemas de Informação (CAPSI 2014) 03 e 04 de Outubro de 2014, Évora, Portugal
ISSN 2183-489X
DOI http://dx.doi.org/10.18803/capsi.v14.195-205
195
Managing Expected Returns and Downside Risk with Information from
Technical Analysis
Araújo Santos, P., Escola Superior de Gestão e Tecnologia de Santarém (ESGTS) Centro de Estatística Aplicações da Universidade de Lisboa (CEAUL), Portugal, [email protected] Carraca de Matos, P., Escola Superior de Gestão e Tecnologia de Santarém (ESGTS), Portugal,
Abstract
With the growing amount of data and information, one of the biggest challenges of information science is to transform information into useful knowledge. This paper presents an example of how we can use the scientific method to transform information from stock market data in useful knowledge, using the bootstrap methodology. We measure downside risk with a Value-at-Risk (VaR) model and take into account the joint performance in terms of returns and risks, with Sharpe type ratios. Empirical evidence presented here confirms results from previous studies that show consistently higher returns during an uptrend and the opposite during a downward trend. Additionally, provides very strong statistical evidence that downside risk is much lower during a primary uptrend than during a downward trend and performance is better in terms of Sharpe type ratios. Empirical results show that information from the primary trend obtained with a 200-days moving average is useful.
Palavras chave: Value-at-Risk, Primary trend, Bootstrap methodology
1. I
NTRODUCTIONInformation science deal with understanding how people create electronic information, how they build, design, and evaluate effective information systems and how they ultimately transform information into useful knowledge. In this paper we present an example that shows how we can transform information from stock market data into useful knowledge, using the bootstrap methodology. The application of this methodology can be extended to other technical analysis (TA) methods, allowing investors and portfolio managers to focus the attention only on the relevant information.
At least since the memorable study of Basu [Basu 1977], significant relationships between expected returns and fundamental variables such as price-earnings ratio, price-book ratio, size measured by market value, dividend yield, was documented by numerous academic studies. These fundamental variables are relevant for expected returns management. Nowadays, is accepted by many professionals and academics that investors can benefit from complement an analysis based on fundamental variables with information from past price behavior, to produce better investment and risk management decisions. TA attempt to forecast prices by the study of past prices and a few other related summary statistics about trading. TA involves numerous analysis methods, patterns and indicators. Unfortunately, much of popular TA is supported by carefully chosen charts
14ª Conferência da Associação Portuguesa de Sistemas de Informação (CAPSI 2014) 196 with partial data and not by objective statistical evidence. How can we select the TA techniques that produce relevant information for portfolio management? At least since the beginning of sixties, emerged in the academic literature some studies supporting TA techniques, with objective observation and statistical inference. Examples of important early studies are the works of Alexander [Alexander 1961] and Cootner [Cootner 1962]. More recently Aronson [Aronson 2011] proposed an evidence-based TA (EBTA), using the scientific method, as the rational way to transform information from market data into useful knowledge.
The rest of the paper is organized as follows. The second section reviews some previous research on TA. The third section reviews VaR models for measuring downside risk. The fourth section describes how we apply the bootstrap methodology. The fifth section presents the empirical results of the tests. The last section concludes the paper.
2. T
ECHNICALA
NALYSIS AND THEP
RIMARYT
RENDThe Dow Theory, is the basis of several methods from TA. Charles Dow began publishing a newspaper which he called “The Wall Street Journal”. Between 1899 and 1902, he wrote a series of editorials where he noted the tendency of share prices to move in trends. The trend is a key concept of TA. Dow never published his whole theory but followers and associates published works based on his ideas. Two of the most important contributors to the Dow theory were William Hamilton [Hamilton 1922] and Robert Rhea [Rhea 1932]. This theory holds that the market movements may be decomposed into primary, secondary and tertiary trends. The primary trend is the long term direction of the market and the most important trend. Charles Dow used Peak and Trough analysis to recognize them. The primary trend is up (Bull market) if the market is making successive higher highs and higher lows. The primary trend is down (Bear Market) with the opposite pattern. Validation of a trend change is based on the DJ Industrial Average and the DJ Rail Index with the two averages confirming each other.
Under the weak form of the efficient market hypothesis, stock prices are assumed to reflect any information contained in the past history of the price and thus it is impossible to predict the future behavior of the price series by analyzing its past behavior. Alfred Cowles [Cowles 1936] test the Dow Theory and, not taking into account repeated bull forecasts in a rising market and repeated bear forecasts in a falling market, apparently provides evidence against it and supporting the weak form of the efficient market hypothesis. Recently, Cowls evidence have been revisited by Stephen Brown, William Goetzmann and Alok Kumar [Brown et al. 1998] with risk adjusted returns and more advanced statistical methods. They present evidence that Dow Theory produced higher risk adjusted returns. Early studies support the weak form of the efficient market hypothesis, however these studies were not able to use more advanced statistical methods, such as the bootstrap methodology proposed by Bradley Efron in 1979 [Efron 1979]. More recent studies reveal that technical
14ª Conferência da Associação Portuguesa de Sistemas de Informação (CAPSI 2014) 197 analysis helps to predict stock price changes. For example, Bohan [Bohan 1981] finds strong support for “Relative Strench” analysis at the industry level and William Brock, Josef Lakonishok and Blake LeBaron [Brock et. al. 1992], applying standard statistical analysis and bootstrap techniques, provide strong support for two technical rules: moving average and trading range break. These authors, using the DJIA until 1986 and for several moving-average-oscillators presented on average a daily return for buy periods of 0.042 which is about 12% at an annual rate. For the sell periods the annual rate is negative, around -7%. These are not total returns, but only returns from price variations. Returns from distributed dividends that can be very important for some type of investments are not considered. In this paper we also consider returns from price variations.
In line with objective TA defended by Aronson [Aronson 2011] and as many market participants, we choose for determining the primary trend an objective rule, the most popular 200-day moving average. Under this popular method for identification of the trend, the primary trend is up (bull market) if the price is above the 200-day moving average and is down (bear Market) if the price is below. In Figure 1 the prices of the DJIA and 200-days moving averages (dotted line) are presented for the period between the beginning of 2005 and June 6, 2014. It is interesting to note how well this method performs during the last bear market and the current bull market. However it is not wise to take conclusions based only on a simple graph and partial data, a more rational and rigorous approach, based on the scientific method, is needed.
Figure 1 – Dow Jones Industrial Average index prices and 200-days moving averages (dotted line) between the beginning of 2005 and June 6, 2014
3. D
OWNSIDER
ISK ANDV
AR
M
ODELSThe quantification of the potential size of losses and assessing risk levels for portfolios is fundamental in designing prudent risk management and portfolio strategies. Value-at-risk (VaR) models have become an important instrument within the financial markets for quantifying and assessing market downside risks. They determine the maximum expected loss an asset or a portfolio can generate over a certain holding period, with
14ª Conferência da Associação Portuguesa de Sistemas de Informação (CAPSI 2014) 198 a pre-determined probability value. Thus, a VaR model can be used to evaluate the performance of portfolio managers b y providing downside risk quantification, together with asset and portfolio returns. It can also help to determine the most effective risk management strategy for a given situation. The calculation of VaR is not trivial(see,e.g. Kuester et al. [Kuester et al. 2006] and the references therein for a survey of competing methods). We consider the asset return process denoted by
where is the information set at time t-1 and ht is the conditional variance at time t.
The VaR measure with coverage probability, p, is defined as the conditional quantile, where
The VaR is a quantile p of the return distribution and measures the worst expected loss over a given horizon at a given level of confidence 1- p. It is usual to multiply this quantile by the amount invested and express the VaR in terms of this amount. We choose the coverage probability p = 0.01, which is consistently used in the literature and is the level established in the Basel Accord rules for computing capital requirements.
For the empirical study we choose the well-known and popular J.P. Morgan [Morgan 1996] RiskMetrics
approach which assumes , a normal distribution for and where
λ is set to 0.94 for daily data. Other more sophisticated models are the GARCH type models based on the Asymmetric Power Autoregressive Conditional Heteroscedasticity (APARCH) proposed by Ding, Granger and Engle (1993), the Filtered Historical Simulation approach (FHS), originally proposed by Barone-Adesi et al. [Barone- Adesi 1999] and the group of the EVT models such as the Conditional EVT (CEVT) and the recently proposed by Araújo Santos and Fraga Alves [Araújo Santos and Fraga Alves 2013] DPOT model. Several studies have concluded that EVT models produce better out-of-sample results to forecast one-day-ahead VaR (see, for example, McNeil and Frey [McNeil and Frey 2000], Byström [Byström 2004], Kuester et al. [Kuester et al. 2006], Ghorbel and Trabelsi [Ghorbel and Trabelsi 2008], Araújo Santos and Fraga Alves [Araújo Santos and Fraga Alves 2013], [Hammoudeh et al. 2013] and Araújo Santos et al. [Araújo Santos et al. 2013].
4. M
ETHODOLOGYThe data set used in this study is the Dow Jones Industrial Average (DJIA) from October 1,1928, until June 6, 2014. No other index of stocks has been available for a similar period of time. With the simple technical rule known as a moving-average-oscillator, the bull and bear signals are generated by two moving averages. This rule identify a bull (bear) market when the short period moving average rises above (falls below) the long
14ª Conferência da Associação Portuguesa de Sistemas de Informação (CAPSI 2014) 199 period moving average. We choose the most popular implementation of this rule with one day for the short period and 200 days for the long period.
In the important work of Brock et. al. [Brock et. al. 1992] the authors, using an advanced statistical methodology, the bootstrap methodology, compare results obtained with the original DJIA series with results obtained with bootstrap simulations, only in terms of returns and standard deviations. The main drawback of the standard deviation is that it takes into account large positive variations while the risk corresponds only to negative variations. For downside risk measurement, emerged the VaR, widely adopted during the 1990´s [Holton 2002] and described in Section 3. Here we consider this more recent method to measure downside risk. Additional we also take into account the joint performance in terms of returns and risks, with Sharpe type ratios.
We investigate if under a bull (bear) market determined by a 200-day moving average, the risk measured by the VaR model and the expected return are significantly different from the downside risks and returns under the random walk hypothesis. Additionally, we compute a Sharpe type ratio dividing the fourth column of Table 1 by the third column, adjusting returns by the downside risk incurred. Then, we also investigate if under a bull (bear) market the Sharpe type ratio is significantly different from the Sharpe type ratios under the random walk hypothesis.
With these research objectives, tree types of strategies were implemented, namely:
Bull – Long position if the price is above the 200-day moving average;
Bear – Short position if the price is below the 200-day moving average;
Buy/Hold – Always long.
To test whether the risk forecasts, returns and Sharpe type ratios, following a bull (bear) signal are “abnormal” we apply the bootstrap methodology. As noted by Brock, et.al. [Brock et. al. 1992], this methodology is superior to the traditional approach utilized in numerous studies to measure the significance of TA methods. The bootstrap methodology is a resample method proposed by Bradley Efron in 1979 [Efron 1979]. Let
be iid (independent and identically distributed) random variables, i.e., a random sample, from
distribution F. Let be a random variable which may depend directly upon F. Let the
empirical distribution function that puts mass 1/n on, The bootstrap method approximates
the distribution of under F by the distribution of under where
denotes an iid sample from Bootstrapping is done by taking B bootstrap samples, with
14ª Conferência da Associação Portuguesa de Sistemas de Informação (CAPSI 2014) 200 Simulated price series are obtained using the close price of October 1, 1928 , simulated
log returns and the equation . We obtain simulated log returns
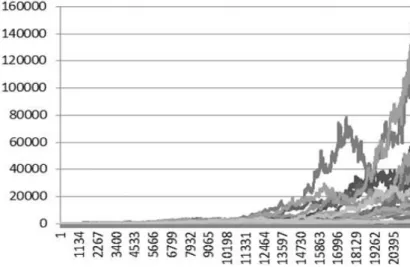
, by randomly drawing from the original DJIA log return series, with replacement. This series have the same drift in prices, the same volatility and the same unconditional distribution as the historical DJIA log return series. The log returns of these simulated series are iid and for that reason it is impossible to predict the future behavior of the price series by analyzing past price patterns. This random walk model for prices corresponds to our null hypothesis. To illustrate the process, 25 simulated price series are presented in Figure 2. We choose B=500, i.e., 500 replications of random walks with the same length as the original Dow series. This should provide a good approximation for conditional distributions under the null model. Risk forecasts, returns and Sharpe type ratios conditional on bull (bear) signals using the original DJIA data are compared to conditional (on bull or bear signals) risk forecasts, returns and Sharpe type ratios from the 500 simulated random walks.
Figure 2 – Example of 25 simulated price series under the random walk bootstraps from the DJIA log returns empirical distribution.
5. E
MPIRICALR
ESULTSResults from the three trading strategies using the original DJAI price series are presented in Table 1. Results in the fifth column show that the bull strategy produce much better results than the bear strategy and better results than the buy and hold strategy, with 9.42%, -3.7% and 4.68% annual simple returns, respectively. We recall that these are not total returns (from price variation and dividends) but only returns from price variation. In terms of returns, the results confirm the findings of previous studies, such as Cootner [Cootner
14ª Conferência da Associação Portuguesa de Sistemas de Informação (CAPSI 2014) 201 1962] and Brock, et. al. [Brock et al. 1992]. The results in the third column show that under bull conditions investors incur much less risk compared with bear conditions, the mean one-day-ahead risk forecasts is
-2.05% (maximum daily loss with 99% confidence level) compared with -3.3% when the price is below the 200-days moving average. The average daily downside risk incurred during bull markets is only 62% the same average during bear markets. Finally, the Sharpe type ratios result in the last column can be interpreted in the following way: for the bull strategy we have 0.0176 expected daily log return for each 1% of daily downside risk incurred and for the buy and hold strategy 0.0073 expected daily log return for each 1% of daily downside risk incurred. Based on this performance measure the differences between the bull and buy/hold strategies are more pronounced.
Strategy N Mean one-day-ahead
VaR forecasts Mean daily log returns Anual simple return Sharpe type ratio Bull Bear Buy/Hold 13952 7366 21318 -2,05% -3,30% -2,48% 0,036 -0,015 0,018 9,42% -3,70% 4,68% 0,0176 -0,0046 0,0073 Table 1 – Summary statistics for the tree strategies
Now we respond to the following questions:
Trends in the original DJIA series and the results of Table 1 can been produced by chance with a stock market that behaves like a random walk?
Or results are due to significant primary trends that occur in the stock market, detectable by the analysis of past price patterns, specifically, by moving averages of 200-days past prices?
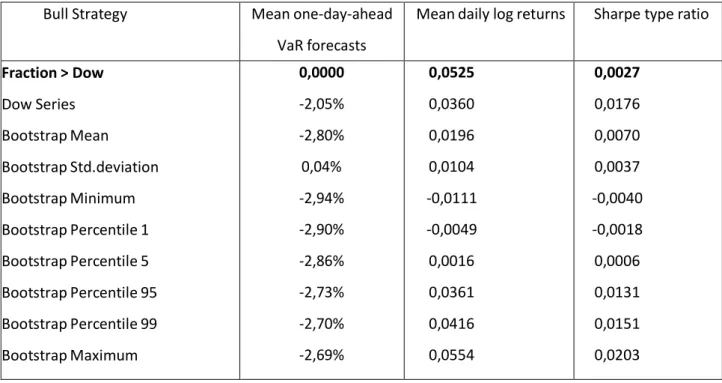
With strong statistical evidence to reject the first hypothesis we have a good rational reason to use information produced by the 200-days moving average. To answer these questions we apply the bootstrap methodology described in the previous section. Results are displayed in Table 2 for the bull strategy. The numbers in the first row are the fractions of the simulated results with higher values than the results obtained with the DJIA original series. These numbers can be thought of as simulated “p-values”. Turning to the second column, the fraction is 0, showing that all the simulated random walks generated mean one-day-ahead VaR forecasts lower than the mean one-day-ahead VaR forecast from the DJIA original series. In the case of returns alone we have a simulated “p-value” equal to 0.052, rejecting the null only with 10% significance level but very close to the
14ª Conferência da Associação Portuguesa de Sistemas de Informação (CAPSI 2014) 202 5% level. Adjusting the returns with risk, with the Sharpe ratio, again we obtain a very low simulated “p-value”. In the other rows, descriptive statistics for the simulations are presented.
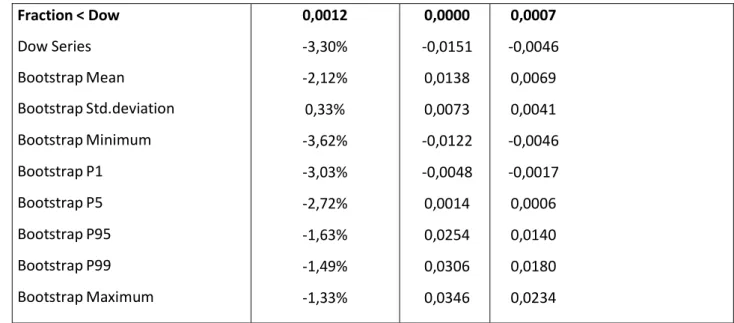
Table 3 presents similar results for the bear strategy. The simulated “p-value” in the third column is equal to 0, showing that all the simulated random walks generated mean returns higher than the mean returns from the DJIA original series. The others simulated “p-value” are all very low. In summary, we reject the null hypothesis in five cases with 1% significance level and only in one case with 10% significance level. This means that Tables 2 and 3 strongly rejects the random walk model for DJIA prices and provides very strong evidence that significant primary trends occur in the stock market, detectable by the analysis of past price patterns, specifically, by moving averages of 200-days past prices.
Bull Strategy Mean one-day-ahead
VaR forecasts
Mean daily log returns Sharpe type ratio
Fraction > Dow Dow Series Bootstrap Mean Bootstrap Std.deviation Bootstrap Minimum Bootstrap Percentile 1 Bootstrap Percentile 5 Bootstrap Percentile 95 Bootstrap Percentile 99 Bootstrap Maximum 0,0000 -2,05% -2,80% 0,04% -2,94% -2,90% -2,86% -2,73% -2,70% -2,69% 0,0525 0,0360 0,0196 0,0104 -0,0111 -0,0049 0,0016 0,0361 0,0416 0,0554 0,0027 0,0176 0,0070 0,0037 -0,0040 -0,0018 0,0006 0,0131 0,0151 0,0203 Table 2 – Random walk simulations results and tests for the bull strategy
Bear Strategy Mean
one-day-ahed VaR forecasts Mean daily log returns
14ª Conferência da Associação Portuguesa de Sistemas de Informação (CAPSI 2014) 203 Fraction < Dow Dow Series Bootstrap Mean Bootstrap Std.deviation Bootstrap Minimum Bootstrap P1 Bootstrap P5 Bootstrap P95 Bootstrap P99 Bootstrap Maximum 0,0012 -3,30% -2,12% 0,33% -3,62% -3,03% -2,72% -1,63% -1,49% -1,33% 0,0000 -0,0151 0,0138 0,0073 -0,0122 -0,0048 0,0014 0,0254 0,0306 0,0346 0,0007 -0,0046 0,0069 0,0041 -0,0046 -0,0017 0,0006 0,0140 0,0180 0,0234 Table 3 – Random walk simulations results and tests for the bear strategy
6. C
ONCLUSIONSEarly studies support the weak form of the efficient market hypothesis, however these studies were not able to use more advanced statistical methods, such as the bootstrap methodology proposed by Bradley Efron only in 1979 [Efron 1979]. More recent studies reveal that TA helps to predict stock price changes. In this line of research, the important study [Brock et. al. 1992], provide strong support for two technical rules (moving average and trading range break) applying both standard statistical analysis and bootstrap techniques. The authors of this study compute results only in terms of returns and standard deviations. The main drawback of the standard deviation is that it takes into account large positive variations while the ris k corresponds only to negative variations. We measure downside risk with a Value-at-Risk (VaR) model and take into account the joint performance in terms of returns and risks, with Sharpe type ratios. Empirical evidence presented in Section 5, with a very long data series, the Dow Jones index from 1928 to 2014, confirm results from previous studies that show consistently higher returns during an uptrend and the opposite during a downward trend. Empirical findings provide very strong statistical evidence that downside risk is much lower during a primary uptrend than during a downward trend and performance is better in terms of Sharpe type ratios. Statistical tests based on the bootstrap methodology strongly rejects the random walk model for DJIA prices and provide very strong evidence that significant primary trends occur in the stock market, detectable by moving averages of days past prices. Empirical results show that information from the primary trend obtained with a 200-days moving average is useful for managing expected returns and downside and therefore useful for investors and portfolio managers. This paper presents an example of how we can use the scientific method to transform information from stock market data in useful knowledge, using the bootstrap methodology. The study is
14ª Conferência da Associação Portuguesa de Sistemas de Informação (CAPSI 2014) 204 focused on only one very simple trading rule. Other more complex techniques may generate better results and we believe lot of them will not. Investors and portfolio managers can discard the information produced by TA methods that “fail” in the bootstrap methodology tests and focus their attention only on relevant information from TA, to complement the analysis based on fundamental variables.
R
EFERENCESAraújo Santos, P. and Fraga Alves M.I., “Forecasting Value-at-Risk with a duration-based POT method”. Mathematics and Computers in Simulation, 94 (2013), 295–309.
Araújo Santos, P., Fraga Alves, M.I. and Hammoudeh, S.“High Quantiles Estimation with Quasi-PORT and DPOT: An Application to Value-at-Risk for Financial Variables”, The North American Journal of Economics and Finance, 26 (2013), 487–496.
Alexander, S. S. “Price Movements in Speculative Markets: Trends or Random Walks”, Industrial Management Review, 2 (1961), 7-26.
Aronson, D., Evidence-Based Technical Analysis: Applying the Scientific Method and Statistical Inference to Trading Signals, Wiley, 2011.
Barone-Adesi, G., Giannopoulos, K. and Vosper. L., “VaR without correlations for portfolios of derivative securities”, Journal of Futures Markets, 19 (1999), 583-602.
Basu, S., “Investment Performance of Common Stocks in Relation to Their Price Earnings Ratios: A Test of the EÆcient Market Hypothesis”, The Journal of Finance, 32, 3 (1977), 663-82.
Bystrom, H., “Managing extreme risks in tranquil and volatile markets using conditional extreme value theory”, International Review of Financial Analysis, 13 (2004), 133-152.
Bohan, J. . Relative Strength: Further Positive Evidence. Journal of Portfolio Management, Fall, (1981), 36-39.
Brown, S.J., Goetzmann, W.N. and Kumar, A., “The Dow Theory: William Peter Hamilton’s Track Record Reconsidered”, The Journal of Finance,4 (1998), 1311-33.
Brosk, W., Lakonishok, J. and LeBaron, B. “Simple technical trading rules and stochastic properties of stock returns”, Journal of Finance, 47 (1992), 1731-1764.
Cootner, P. H., “Stock Prices: Random vs. Systematic Changes”, Industrial Management Review, 3, 2 (1962), 43.
14ª Conferência da Associação Portuguesa de Sistemas de Informação (CAPSI 2014) 205 Efron, B., “Bootstrap Methods: Another Look at the Jackknife”, The Annals of Statistics, 7, 1 (1979), 1-26.
Ghorbel, A. and Trabelsi, A., “Predictive performance of conditional Extreme Value Theory in Value-at-Risk estimation”, Int. J. Monetary Economics and Finance, 1, 2 (2008), 121- 147.
Hamilton, W., The Stock Market Barometer: A study of its Forecast value based on Charles H. Dow’s Theory of the Price Movement, Barron’s, New York, NY, 1922.
Hammoudeh, S., Araújo Santos, P. and Al-Hassan. A. “Downside risk management and VaR- based optimal portfolios for precious metals, oil and stocks” The North American Journal of Economics and Finance. 25 (2013), 318–334.
Holton, G.A., History of Value-at-Risk:1922-1998, Contingency Analysis Working Paper, July 25, 2002.
Kuester, K., Mittik, S. and Paolella, M.S., “Value-at-Risk Prediction: A Comparison of Alternative Strategies” Journal of Financial Econometrics, 4,1 (2006), 53-89.
McNeil A., and Frey R., “Estimation of tail-related risk measures for hetroscedastic financial time series: An extreme value approach” Journal of Empirical Finance, 7 (2000), 271 –300.
Morgan, J., Riskmetrics, J.P. morgan technical document, 4th Edition, New York, 1996. Rhea, R., The Dow Theory, Barron’s, New York, NY, 1932.